| Tabulation of Results | ||
| country x spr | ||
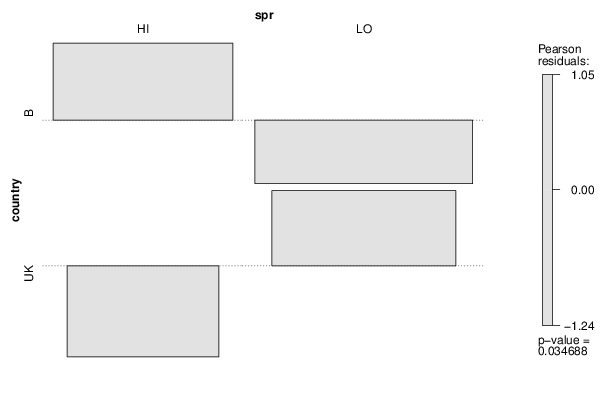
| HI | LO | B | 72 | 85 | UK | 37 | 75 |
| Tabulation of Expected Results | ||
| country x spr | ||
| HI | LO | B | 63.62 | 93.38 | UK | 45.38 | 66.62 |
| Statistical Results | |
| Pearson's Chi-squared test with Yates' continuity correction | |
| Pearson Chi Square Statistic | 3.94 |
| Degrees of Freedom | 1 |
| P value | 0.05 |