Free Statistics

of Irreproducible Research!

Author's title

Author*The author of this computation has been verified*
R Software Modulerwasp_histogram.wasp
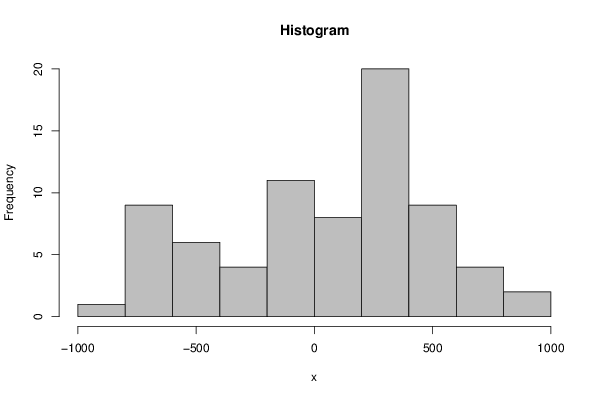
Title produced by softwareHistogram
Date of computationSat, 01 Dec 2012 10:38:30 -0500
Cite this page as followsStatistical Computations at FreeStatistics.org, Office for Research Development and Education, URL https://freestatistics.org/blog/index.php?v=date/2012/Dec/01/t1354376324pla6cja8r02y28a.htm/, Retrieved Sun, 28 Apr 2024 22:43:57 +0000
Statistical Computations at FreeStatistics.org, Office for Research Development and Education, URL https://freestatistics.org/blog/index.php?pk=195341, Retrieved Sun, 28 Apr 2024 22:43:57 +0000
QR Codes:

Original text written by user:
IsPrivate?No (this computation is public)
User-defined keywords
Estimated Impact98
Family? (F = Feedback message, R = changed R code, M = changed R Module, P = changed Parameters, D = changed Data)
-     [Skewness and Kurtosis Test] [skewness] [2012-12-01 13:21:10] [2f324ead08cc3849e52bae5d3f3d905a]
- RMPD    [Histogram] [histogramfrequenc...] [2012-12-01 15:38:30] [e357aba3893873b930815b56a53f1005] [Current]
Feedback Forum

Post a new message
Dataseries X:
-619,000000000000000
-517,699041774918000
223,514709240721000
-967,980783644196000
329,740441841572000
109,375657675839000
527,006139168516000
-117,685635420767000
502,003558006032000
302,282345107174000
-411,721926586784000
138,662015102645000
-585,358354774593000
-394,399894064740000
22,233203690404500
-768,297564043327000
280,712753803935000
-443,866135832459000
-37,377498552983500
-485,441724847306000
709,649368391671000
277,952740093246000
-76,187842608616800
222,911249368004000
-777,488410425251000
-80,018530370811300
285,688898080261000
-779,680233479605000
-17,862278616599700
269,974359677577000
-119,899207773971000
54,141514382101400
937,543513180943000
52,655911042984400
265,293832671838000
-2,836438673632070
-692,385994990975000
230,569104797780000
328,953331068020000
-391,286455127971000
323,852209620938000
-193,577487518074000
-299,836207204939000
466,779602938550000
916,652167964750000
564,082238287798000
232,502554052839000
-11,420263157457200
-370,606656030543000
339,247931065411000
40,373299886725400
-618,038225259597000
621,109997297344000
38,473958690710800
91,364060458063200
204,854892945363000
273,322692180216000
668,917389198028000
202,689246497566000
209,500963536935000
-669,769061446519000
-9,405668022114700
269,088009165802000
-755,644800443048000
660,356181723919000
-177,512389250745000
580,677655919160000
233,462518606158000
411,387253196423000
559,056459673333000
486,274899596096000
492,051493148436000
-528,089271427612000
-626,225488859407000


Summary of computational transaction
Raw Inputview raw input (R code)
Raw Outputview raw output of R engine
Computing time1 seconds
R Server'Gwilym Jenkins' @ jenkins.wessa.net

\begin{tabular}{lllllllll}
\hline
Summary of computational transaction \tabularnewline
Raw Input & view raw input (R code)  \tabularnewline
Raw Output & view raw output of R engine  \tabularnewline
Computing time & 1 seconds \tabularnewline
R Server & 'Gwilym Jenkins' @ jenkins.wessa.net \tabularnewline
\hline
\end{tabular}
%Source: https://freestatistics.org/blog/index.php?pk=195341&T=0

[TABLE]
[ROW][C]Summary of computational transaction[/C][/ROW]
[ROW][C]Raw Input[/C][C]view raw input (R code) [/C][/ROW]
[ROW][C]Raw Output[/C][C]view raw output of R engine [/C][/ROW]
[ROW][C]Computing time[/C][C]1 seconds[/C][/ROW]
[ROW][C]R Server[/C][C]'Gwilym Jenkins' @ jenkins.wessa.net[/C][/ROW]
[/TABLE]
Source: https://freestatistics.org/blog/index.php?pk=195341&T=0

Globally Unique Identifier (entire table): ba.freestatistics.org/blog/index.php?pk=195341&T=0

As an alternative you can also use a QR Code:  

The GUIDs for individual cells are displayed in the table below:

Summary of computational transaction
Raw Inputview raw input (R code)
Raw Outputview raw output of R engine
Computing time1 seconds
R Server'Gwilym Jenkins' @ jenkins.wessa.net


Frequency Table (Histogram)
BinsMidpointAbs. FrequencyRel. FrequencyCumul. Rel. Freq.Density
[-1000,-800[-90010.0135140.0135146.8e-05
[-800,-600[-70090.1216220.1351350.000608
[-600,-400[-50060.0810810.2162160.000405
[-400,-200[-30040.0540540.270270.00027
[-200,0[-100110.1486490.4189190.000743
[0,200[10080.1081080.5270270.000541
[200,400[300200.270270.7972970.001351
[400,600[50090.1216220.9189190.000608
[600,800[70040.0540540.9729730.00027
[800,1000]90020.02702710.000135

\begin{tabular}{lllllllll}
\hline
Frequency Table (Histogram) \tabularnewline
Bins & Midpoint & Abs. Frequency & Rel. Frequency & Cumul. Rel. Freq. & Density \tabularnewline
[-1000,-800[ & -900 & 1 & 0.013514 & 0.013514 & 6.8e-05 \tabularnewline
[-800,-600[ & -700 & 9 & 0.121622 & 0.135135 & 0.000608 \tabularnewline
[-600,-400[ & -500 & 6 & 0.081081 & 0.216216 & 0.000405 \tabularnewline
[-400,-200[ & -300 & 4 & 0.054054 & 0.27027 & 0.00027 \tabularnewline
[-200,0[ & -100 & 11 & 0.148649 & 0.418919 & 0.000743 \tabularnewline
[0,200[ & 100 & 8 & 0.108108 & 0.527027 & 0.000541 \tabularnewline
[200,400[ & 300 & 20 & 0.27027 & 0.797297 & 0.001351 \tabularnewline
[400,600[ & 500 & 9 & 0.121622 & 0.918919 & 0.000608 \tabularnewline
[600,800[ & 700 & 4 & 0.054054 & 0.972973 & 0.00027 \tabularnewline
[800,1000] & 900 & 2 & 0.027027 & 1 & 0.000135 \tabularnewline
\hline
\end{tabular}
%Source: https://freestatistics.org/blog/index.php?pk=195341&T=1

[TABLE]
[ROW][C]Frequency Table (Histogram)[/C][/ROW]
[ROW][C]Bins[/C][C]Midpoint[/C][C]Abs. Frequency[/C][C]Rel. Frequency[/C][C]Cumul. Rel. Freq.[/C][C]Density[/C][/ROW]
[ROW][C][-1000,-800[[/C][C]-900[/C][C]1[/C][C]0.013514[/C][C]0.013514[/C][C]6.8e-05[/C][/ROW]
[ROW][C][-800,-600[[/C][C]-700[/C][C]9[/C][C]0.121622[/C][C]0.135135[/C][C]0.000608[/C][/ROW]
[ROW][C][-600,-400[[/C][C]-500[/C][C]6[/C][C]0.081081[/C][C]0.216216[/C][C]0.000405[/C][/ROW]
[ROW][C][-400,-200[[/C][C]-300[/C][C]4[/C][C]0.054054[/C][C]0.27027[/C][C]0.00027[/C][/ROW]
[ROW][C][-200,0[[/C][C]-100[/C][C]11[/C][C]0.148649[/C][C]0.418919[/C][C]0.000743[/C][/ROW]
[ROW][C][0,200[[/C][C]100[/C][C]8[/C][C]0.108108[/C][C]0.527027[/C][C]0.000541[/C][/ROW]
[ROW][C][200,400[[/C][C]300[/C][C]20[/C][C]0.27027[/C][C]0.797297[/C][C]0.001351[/C][/ROW]
[ROW][C][400,600[[/C][C]500[/C][C]9[/C][C]0.121622[/C][C]0.918919[/C][C]0.000608[/C][/ROW]
[ROW][C][600,800[[/C][C]700[/C][C]4[/C][C]0.054054[/C][C]0.972973[/C][C]0.00027[/C][/ROW]
[ROW][C][800,1000][/C][C]900[/C][C]2[/C][C]0.027027[/C][C]1[/C][C]0.000135[/C][/ROW]
[/TABLE]
Source: https://freestatistics.org/blog/index.php?pk=195341&T=1

Globally Unique Identifier (entire table): ba.freestatistics.org/blog/index.php?pk=195341&T=1

As an alternative you can also use a QR Code:  

The GUIDs for individual cells are displayed in the table below:

Frequency Table (Histogram)
BinsMidpointAbs. FrequencyRel. FrequencyCumul. Rel. Freq.Density
[-1000,-800[-90010.0135140.0135146.8e-05
[-800,-600[-70090.1216220.1351350.000608
[-600,-400[-50060.0810810.2162160.000405
[-400,-200[-30040.0540540.270270.00027
[-200,0[-100110.1486490.4189190.000743
[0,200[10080.1081080.5270270.000541
[200,400[300200.270270.7972970.001351
[400,600[50090.1216220.9189190.000608
[600,800[70040.0540540.9729730.00027
[800,1000]90020.02702710.000135


Parameters (Session):
par2 = grey ; par3 = FALSE ; par4 = Unknown ;
Parameters (R input):
par1 = ; par2 = grey ; par3 = FALSE ; par4 = Unknown ;
R code (references can be found in the software module):
par1 <- as.numeric(par1)
if (par3 == 'TRUE') par3 <- TRUE
if (par3 == 'FALSE') par3 <- FALSE
if (par4 == 'Unknown') par1 <- as.numeric(par1)
if (par4 == 'Interval/Ratio') par1 <- as.numeric(par1)
if (par4 == '3-point Likert') par1 <- c(1:3 - 0.5, 3.5)
if (par4 == '4-point Likert') par1 <- c(1:4 - 0.5, 4.5)
if (par4 == '5-point Likert') par1 <- c(1:5 - 0.5, 5.5)
if (par4 == '6-point Likert') par1 <- c(1:6 - 0.5, 6.5)
if (par4 == '7-point Likert') par1 <- c(1:7 - 0.5, 7.5)
if (par4 == '8-point Likert') par1 <- c(1:8 - 0.5, 8.5)
if (par4 == '9-point Likert') par1 <- c(1:9 - 0.5, 9.5)
if (par4 == '10-point Likert') par1 <- c(1:10 - 0.5, 10.5)
bitmap(file='test1.png')
if(is.numeric(x[1])) {
if (is.na(par1)) {
myhist<-hist(x,col=par2,main=main,xlab=xlab,right=par3)
} else {
if (par1 < 0) par1 <- 3
if (par1 > 50) par1 <- 50
myhist<-hist(x,breaks=par1,col=par2,main=main,xlab=xlab,right=par3)
}
} else {
plot(mytab <- table(x),col=par2,main='Frequency Plot',xlab=xlab,ylab='Absolute Frequency')
}
dev.off()
if(is.numeric(x[1])) {
myhist
n <- length(x)
load(file='createtable')
a<-table.start()
a<-table.row.start(a)
a<-table.element(a,hyperlink('histogram.htm','Frequency Table (Histogram)',''),6,TRUE)
a<-table.row.end(a)
a<-table.row.start(a)
a<-table.element(a,'Bins',header=TRUE)
a<-table.element(a,'Midpoint',header=TRUE)
a<-table.element(a,'Abs. Frequency',header=TRUE)
a<-table.element(a,'Rel. Frequency',header=TRUE)
a<-table.element(a,'Cumul. Rel. Freq.',header=TRUE)
a<-table.element(a,'Density',header=TRUE)
a<-table.row.end(a)
crf <- 0
if (par3 == FALSE) mybracket <- '[' else mybracket <- ']'
mynumrows <- (length(myhist$breaks)-1)
for (i in 1:mynumrows) {
a<-table.row.start(a)
if (i == 1)
dum <- paste('[',myhist$breaks[i],sep='')
else
dum <- paste(mybracket,myhist$breaks[i],sep='')
dum <- paste(dum,myhist$breaks[i+1],sep=',')
if (i==mynumrows)
dum <- paste(dum,']',sep='')
else
dum <- paste(dum,mybracket,sep='')
a<-table.element(a,dum,header=TRUE)
a<-table.element(a,myhist$mids[i])
a<-table.element(a,myhist$counts[i])
rf <- myhist$counts[i]/n
crf <- crf + rf
a<-table.element(a,round(rf,6))
a<-table.element(a,round(crf,6))
a<-table.element(a,round(myhist$density[i],6))
a<-table.row.end(a)
}
a<-table.end(a)
table.save(a,file='mytable.tab')
} else {
mytab
reltab <- mytab / sum(mytab)
n <- length(mytab)
load(file='createtable')
a<-table.start()
a<-table.row.start(a)
a<-table.element(a,'Frequency Table (Categorical Data)',3,TRUE)
a<-table.row.end(a)
a<-table.row.start(a)
a<-table.element(a,'Category',header=TRUE)
a<-table.element(a,'Abs. Frequency',header=TRUE)
a<-table.element(a,'Rel. Frequency',header=TRUE)
a<-table.row.end(a)
for (i in 1:n) {
a<-table.row.start(a)
a<-table.element(a,labels(mytab)$x[i],header=TRUE)
a<-table.element(a,mytab[i])
a<-table.element(a,round(reltab[i],4))
a<-table.row.end(a)
}
a<-table.end(a)
table.save(a,file='mytable1.tab')
}