Free Statistics
of Irreproducible Research!
Description of Statistical Computation | |||||||||||||||||||||||||||||||||
|---|---|---|---|---|---|---|---|---|---|---|---|---|---|---|---|---|---|---|---|---|---|---|---|---|---|---|---|---|---|---|---|---|---|
| Author's title | |||||||||||||||||||||||||||||||||
| Author | *The author of this computation has been verified* | ||||||||||||||||||||||||||||||||
| R Software Module | rwasp_meanversusmedian.wasp | ||||||||||||||||||||||||||||||||
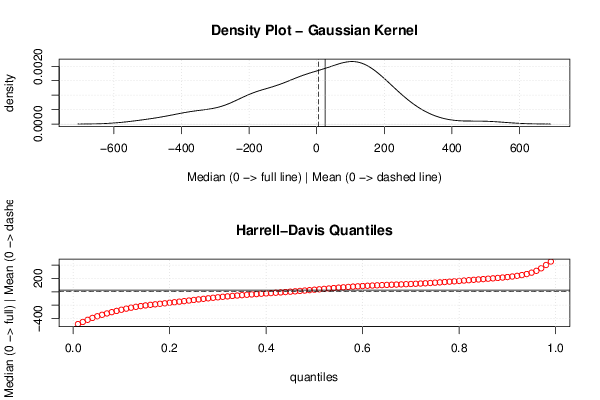
| Title produced by software | Mean versus Median | ||||||||||||||||||||||||||||||||
| Date of computation | Sat, 01 Dec 2012 09:11:11 -0500 | ||||||||||||||||||||||||||||||||
| Cite this page as follows | Statistical Computations at FreeStatistics.org, Office for Research Development and Education, URL https://freestatistics.org/blog/index.php?v=date/2012/Dec/01/t1354371091wzq15v2skbi1dnk.htm/, Retrieved Sun, 28 Apr 2024 21:01:07 +0000 | ||||||||||||||||||||||||||||||||
| Statistical Computations at FreeStatistics.org, Office for Research Development and Education, URL https://freestatistics.org/blog/index.php?pk=195311, Retrieved Sun, 28 Apr 2024 21:01:07 +0000 | |||||||||||||||||||||||||||||||||
| QR Codes: | |||||||||||||||||||||||||||||||||
|
| |||||||||||||||||||||||||||||||||
| Original text written by user: | |||||||||||||||||||||||||||||||||
| IsPrivate? | No (this computation is public) | ||||||||||||||||||||||||||||||||
| User-defined keywords | |||||||||||||||||||||||||||||||||
| Estimated Impact | 104 | ||||||||||||||||||||||||||||||||
Tree of Dependent Computations | |||||||||||||||||||||||||||||||||
| Family? (F = Feedback message, R = changed R code, M = changed R Module, P = changed Parameters, D = changed Data) | |||||||||||||||||||||||||||||||||
| - [Skewness and Kurtosis Test] [skewness] [2012-12-01 13:21:10] [2f324ead08cc3849e52bae5d3f3d905a] - RM D [Mean versus Median] [meanversusmedian] [2012-12-01 14:11:11] [e357aba3893873b930815b56a53f1005] [Current] | |||||||||||||||||||||||||||||||||
| Feedback Forum | |||||||||||||||||||||||||||||||||
Post a new message | |||||||||||||||||||||||||||||||||
Dataset | |||||||||||||||||||||||||||||||||
| Dataseries X: | |||||||||||||||||||||||||||||||||
223.778356481482000 491.188078703703000 -17.429976851852200 -30.066087962963100 51.842245370369700 -333.066087962963000 112.958912037036000 183.592245370370000 -191.899421296295000 25.142245370370800 84.092245370369700 106.158912037037000 -180.096643518518000 9.896412037038320 -378.513310185184000 110.517245370373000 -9.491087962962410 -13.232754629629200 201.417245370370000 -61.532754629628500 -28.191087962961300 130.725578703705000 -60.407754629628500 -342.632754629631000 326.653356481480000 -185.103587962964000 4.195023148147810 254.850578703705000 -309.866087962964000 152.642245370371000 -151.624421296296000 -111.199421296296000 154.183912037039000 95.933912037038700 224.133912037036000 -73.757754629628800 -166.888310185184000 -504.478587962962000 227.445023148146000 112.183912037039000 99.300578703703600 115.933912037039000 -202.457754629630000 103.883912037038000 192.892245370371000 -209.316087962961000 -31.657754629628500 172.658912037037000 51.903356481479900 -74.853587962961700 112.111689814816000 -420.399421296295000 195.300578703704000 104.808912037037000 66.792245370370400 -87.657754629630300 -99.899421296297100 -15.399421296295300 -189.074421296296000 164.658912037037000 -222.846643518518000 295.854745370370000 84.695023148149600 | |||||||||||||||||||||||||||||||||
Tables (Output of Computation) | |||||||||||||||||||||||||||||||||
| |||||||||||||||||||||||||||||||||
Figures (Output of Computation) | |||||||||||||||||||||||||||||||||
Input Parameters & R Code | |||||||||||||||||||||||||||||||||
| Parameters (Session): | |||||||||||||||||||||||||||||||||
| Parameters (R input): | |||||||||||||||||||||||||||||||||
| R code (references can be found in the software module): | |||||||||||||||||||||||||||||||||
library(Hmisc) | |||||||||||||||||||||||||||||||||