Free Statistics

of Irreproducible Research!

Author's title

Author*The author of this computation has been verified*
R Software Modulerwasp_autocorrelation.wasp
Title produced by software(Partial) Autocorrelation Function
Date of computationSat, 01 Dec 2012 07:34:12 -0500
Cite this page as followsStatistical Computations at FreeStatistics.org, Office for Research Development and Education, URL https://freestatistics.org/blog/index.php?v=date/2012/Dec/01/t1354365276cg3h0bwb9c03j1t.htm/, Retrieved Mon, 29 Apr 2024 06:38:55 +0000
Statistical Computations at FreeStatistics.org, Office for Research Development and Education, URL https://freestatistics.org/blog/index.php?pk=195267, Retrieved Mon, 29 Apr 2024 06:38:55 +0000
QR Codes:

Original text written by user:
IsPrivate?No (this computation is public)
User-defined keywords
Estimated Impact150
Family? (F = Feedback message, R = changed R code, M = changed R Module, P = changed Parameters, D = changed Data)
-     [Univariate Data Series] [Paper - exogene v...] [2010-12-01 16:02:49] [6f0e7a2d1a07390e3505a2db8288f975]
- RMP   [(Partial) Autocorrelation Function] [ACF 1] [2012-12-01 12:28:25] [aa4758794357e809405bf1fb1497cdc4]
-   P       [(Partial) Autocorrelation Function] [ACF 3] [2012-12-01 12:34:12] [4289cf790da1cc09a0cb8798de13fde3] [Current]
Feedback Forum

Post a new message
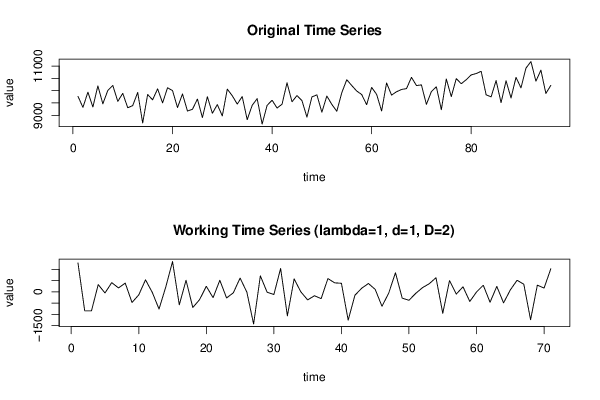
Dataseries X:
9769
9321
9939
9336
10195
9464
10010
10213
9563
9890
9305
9391
9928
8686
9843
9627
10074
9503
10119
10000
9313
9866
9172
9241
9659
8904
9755
9080
9435
8971
10063
9793
9454
9759
8820
9403
9676
8642
9402
9610
9294
9448
10319
9548
9801
9596
8923
9746
9829
9125
9782
9441
9162
9915
10444
10209
9985
9842
9429
10132
9849
9172
10313
9819
9955
10048
10082
10541
10208
10233
9439
9963
10158
9225
10474
9757
10490
10281
10444
10640
10695
10786
9832
9747
10411
9511
10402
9701
10540
10112
10915
11183
10384
10834
9886
10216


Summary of computational transaction
Raw Inputview raw input (R code)
Raw Outputview raw output of R engine
Computing time3 seconds
R Server'George Udny Yule' @ yule.wessa.net

\begin{tabular}{lllllllll}
\hline
Summary of computational transaction \tabularnewline
Raw Input & view raw input (R code)  \tabularnewline
Raw Output & view raw output of R engine  \tabularnewline
Computing time & 3 seconds \tabularnewline
R Server & 'George Udny Yule' @ yule.wessa.net \tabularnewline
\hline
\end{tabular}
%Source: https://freestatistics.org/blog/index.php?pk=195267&T=0

[TABLE]
[ROW][C]Summary of computational transaction[/C][/ROW]
[ROW][C]Raw Input[/C][C]view raw input (R code) [/C][/ROW]
[ROW][C]Raw Output[/C][C]view raw output of R engine [/C][/ROW]
[ROW][C]Computing time[/C][C]3 seconds[/C][/ROW]
[ROW][C]R Server[/C][C]'George Udny Yule' @ yule.wessa.net[/C][/ROW]
[/TABLE]
Source: https://freestatistics.org/blog/index.php?pk=195267&T=0

Globally Unique Identifier (entire table): ba.freestatistics.org/blog/index.php?pk=195267&T=0

As an alternative you can also use a QR Code:  

The GUIDs for individual cells are displayed in the table below:

Summary of computational transaction
Raw Inputview raw input (R code)
Raw Outputview raw output of R engine
Computing time3 seconds
R Server'George Udny Yule' @ yule.wessa.net


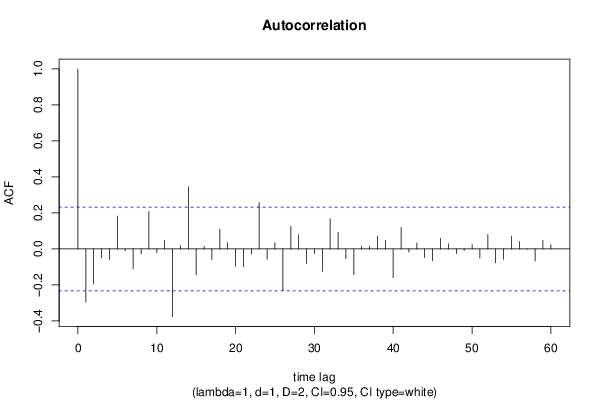
Autocorrelation Function
Time lag kACF(k)T-STATP-value
1-0.294594-2.48230.00771
2-0.195341-1.6460.052094
3-0.050545-0.42590.335736
4-0.059135-0.49830.309912
50.1824631.53750.064312
6-0.010422-0.08780.465135
7-0.111963-0.94340.174333
8-0.027179-0.2290.409758
90.2081721.75410.041865
10-0.020781-0.17510.430749
110.0486490.40990.341548
12-0.376305-3.17080.001122
130.0190890.16080.436336
140.3437452.89640.002507
15-0.142747-1.20280.116524
160.0136760.11520.454292
17-0.058551-0.49340.311642
180.1094020.92180.179867
190.0360340.30360.381151
20-0.096441-0.81260.209575
21-0.099035-0.83450.203404
22-0.027991-0.23590.407112
230.2577062.17150.016619
24-0.057423-0.48390.314988
250.0345630.29120.385862
26-0.231754-1.95280.027393
270.1252331.05520.147449
280.0796970.67150.25203
29-0.080685-0.67990.249402
30-0.025549-0.21530.415083
31-0.123394-1.03970.150994
320.1681611.41690.080436
330.0920980.7760.220154
34-0.054209-0.45680.324615
35-0.142843-1.20360.116368
360.0149120.12560.450183
370.0144810.1220.451614
380.0705150.59420.277142
390.0460060.38760.349718
40-0.159846-1.34690.09115
410.1189561.00230.159791
42-0.017233-0.14520.442478
430.0326990.27550.391856
44-0.048125-0.40550.343162
45-0.06593-0.55550.290137
460.0585450.49330.311659
470.028230.23790.406332
48-0.026122-0.22010.413208
49-0.008611-0.07260.471182
500.0240620.20280.419955
51-0.05032-0.4240.336422
520.0798140.67250.251717
53-0.07718-0.65030.258789
54-0.057393-0.48360.315077
550.0700750.59050.278379
560.0408440.34420.365871
57-0.002273-0.01920.492386
58-0.067063-0.56510.286898
590.0464540.39140.348328
600.023560.19850.421603

\begin{tabular}{lllllllll}
\hline
Autocorrelation Function \tabularnewline
Time lag k & ACF(k) & T-STAT & P-value \tabularnewline
1 & -0.294594 & -2.4823 & 0.00771 \tabularnewline
2 & -0.195341 & -1.646 & 0.052094 \tabularnewline
3 & -0.050545 & -0.4259 & 0.335736 \tabularnewline
4 & -0.059135 & -0.4983 & 0.309912 \tabularnewline
5 & 0.182463 & 1.5375 & 0.064312 \tabularnewline
6 & -0.010422 & -0.0878 & 0.465135 \tabularnewline
7 & -0.111963 & -0.9434 & 0.174333 \tabularnewline
8 & -0.027179 & -0.229 & 0.409758 \tabularnewline
9 & 0.208172 & 1.7541 & 0.041865 \tabularnewline
10 & -0.020781 & -0.1751 & 0.430749 \tabularnewline
11 & 0.048649 & 0.4099 & 0.341548 \tabularnewline
12 & -0.376305 & -3.1708 & 0.001122 \tabularnewline
13 & 0.019089 & 0.1608 & 0.436336 \tabularnewline
14 & 0.343745 & 2.8964 & 0.002507 \tabularnewline
15 & -0.142747 & -1.2028 & 0.116524 \tabularnewline
16 & 0.013676 & 0.1152 & 0.454292 \tabularnewline
17 & -0.058551 & -0.4934 & 0.311642 \tabularnewline
18 & 0.109402 & 0.9218 & 0.179867 \tabularnewline
19 & 0.036034 & 0.3036 & 0.381151 \tabularnewline
20 & -0.096441 & -0.8126 & 0.209575 \tabularnewline
21 & -0.099035 & -0.8345 & 0.203404 \tabularnewline
22 & -0.027991 & -0.2359 & 0.407112 \tabularnewline
23 & 0.257706 & 2.1715 & 0.016619 \tabularnewline
24 & -0.057423 & -0.4839 & 0.314988 \tabularnewline
25 & 0.034563 & 0.2912 & 0.385862 \tabularnewline
26 & -0.231754 & -1.9528 & 0.027393 \tabularnewline
27 & 0.125233 & 1.0552 & 0.147449 \tabularnewline
28 & 0.079697 & 0.6715 & 0.25203 \tabularnewline
29 & -0.080685 & -0.6799 & 0.249402 \tabularnewline
30 & -0.025549 & -0.2153 & 0.415083 \tabularnewline
31 & -0.123394 & -1.0397 & 0.150994 \tabularnewline
32 & 0.168161 & 1.4169 & 0.080436 \tabularnewline
33 & 0.092098 & 0.776 & 0.220154 \tabularnewline
34 & -0.054209 & -0.4568 & 0.324615 \tabularnewline
35 & -0.142843 & -1.2036 & 0.116368 \tabularnewline
36 & 0.014912 & 0.1256 & 0.450183 \tabularnewline
37 & 0.014481 & 0.122 & 0.451614 \tabularnewline
38 & 0.070515 & 0.5942 & 0.277142 \tabularnewline
39 & 0.046006 & 0.3876 & 0.349718 \tabularnewline
40 & -0.159846 & -1.3469 & 0.09115 \tabularnewline
41 & 0.118956 & 1.0023 & 0.159791 \tabularnewline
42 & -0.017233 & -0.1452 & 0.442478 \tabularnewline
43 & 0.032699 & 0.2755 & 0.391856 \tabularnewline
44 & -0.048125 & -0.4055 & 0.343162 \tabularnewline
45 & -0.06593 & -0.5555 & 0.290137 \tabularnewline
46 & 0.058545 & 0.4933 & 0.311659 \tabularnewline
47 & 0.02823 & 0.2379 & 0.406332 \tabularnewline
48 & -0.026122 & -0.2201 & 0.413208 \tabularnewline
49 & -0.008611 & -0.0726 & 0.471182 \tabularnewline
50 & 0.024062 & 0.2028 & 0.419955 \tabularnewline
51 & -0.05032 & -0.424 & 0.336422 \tabularnewline
52 & 0.079814 & 0.6725 & 0.251717 \tabularnewline
53 & -0.07718 & -0.6503 & 0.258789 \tabularnewline
54 & -0.057393 & -0.4836 & 0.315077 \tabularnewline
55 & 0.070075 & 0.5905 & 0.278379 \tabularnewline
56 & 0.040844 & 0.3442 & 0.365871 \tabularnewline
57 & -0.002273 & -0.0192 & 0.492386 \tabularnewline
58 & -0.067063 & -0.5651 & 0.286898 \tabularnewline
59 & 0.046454 & 0.3914 & 0.348328 \tabularnewline
60 & 0.02356 & 0.1985 & 0.421603 \tabularnewline
\hline
\end{tabular}
%Source: https://freestatistics.org/blog/index.php?pk=195267&T=1

[TABLE]
[ROW][C]Autocorrelation Function[/C][/ROW]
[ROW][C]Time lag k[/C][C]ACF(k)[/C][C]T-STAT[/C][C]P-value[/C][/ROW]
[ROW][C]1[/C][C]-0.294594[/C][C]-2.4823[/C][C]0.00771[/C][/ROW]
[ROW][C]2[/C][C]-0.195341[/C][C]-1.646[/C][C]0.052094[/C][/ROW]
[ROW][C]3[/C][C]-0.050545[/C][C]-0.4259[/C][C]0.335736[/C][/ROW]
[ROW][C]4[/C][C]-0.059135[/C][C]-0.4983[/C][C]0.309912[/C][/ROW]
[ROW][C]5[/C][C]0.182463[/C][C]1.5375[/C][C]0.064312[/C][/ROW]
[ROW][C]6[/C][C]-0.010422[/C][C]-0.0878[/C][C]0.465135[/C][/ROW]
[ROW][C]7[/C][C]-0.111963[/C][C]-0.9434[/C][C]0.174333[/C][/ROW]
[ROW][C]8[/C][C]-0.027179[/C][C]-0.229[/C][C]0.409758[/C][/ROW]
[ROW][C]9[/C][C]0.208172[/C][C]1.7541[/C][C]0.041865[/C][/ROW]
[ROW][C]10[/C][C]-0.020781[/C][C]-0.1751[/C][C]0.430749[/C][/ROW]
[ROW][C]11[/C][C]0.048649[/C][C]0.4099[/C][C]0.341548[/C][/ROW]
[ROW][C]12[/C][C]-0.376305[/C][C]-3.1708[/C][C]0.001122[/C][/ROW]
[ROW][C]13[/C][C]0.019089[/C][C]0.1608[/C][C]0.436336[/C][/ROW]
[ROW][C]14[/C][C]0.343745[/C][C]2.8964[/C][C]0.002507[/C][/ROW]
[ROW][C]15[/C][C]-0.142747[/C][C]-1.2028[/C][C]0.116524[/C][/ROW]
[ROW][C]16[/C][C]0.013676[/C][C]0.1152[/C][C]0.454292[/C][/ROW]
[ROW][C]17[/C][C]-0.058551[/C][C]-0.4934[/C][C]0.311642[/C][/ROW]
[ROW][C]18[/C][C]0.109402[/C][C]0.9218[/C][C]0.179867[/C][/ROW]
[ROW][C]19[/C][C]0.036034[/C][C]0.3036[/C][C]0.381151[/C][/ROW]
[ROW][C]20[/C][C]-0.096441[/C][C]-0.8126[/C][C]0.209575[/C][/ROW]
[ROW][C]21[/C][C]-0.099035[/C][C]-0.8345[/C][C]0.203404[/C][/ROW]
[ROW][C]22[/C][C]-0.027991[/C][C]-0.2359[/C][C]0.407112[/C][/ROW]
[ROW][C]23[/C][C]0.257706[/C][C]2.1715[/C][C]0.016619[/C][/ROW]
[ROW][C]24[/C][C]-0.057423[/C][C]-0.4839[/C][C]0.314988[/C][/ROW]
[ROW][C]25[/C][C]0.034563[/C][C]0.2912[/C][C]0.385862[/C][/ROW]
[ROW][C]26[/C][C]-0.231754[/C][C]-1.9528[/C][C]0.027393[/C][/ROW]
[ROW][C]27[/C][C]0.125233[/C][C]1.0552[/C][C]0.147449[/C][/ROW]
[ROW][C]28[/C][C]0.079697[/C][C]0.6715[/C][C]0.25203[/C][/ROW]
[ROW][C]29[/C][C]-0.080685[/C][C]-0.6799[/C][C]0.249402[/C][/ROW]
[ROW][C]30[/C][C]-0.025549[/C][C]-0.2153[/C][C]0.415083[/C][/ROW]
[ROW][C]31[/C][C]-0.123394[/C][C]-1.0397[/C][C]0.150994[/C][/ROW]
[ROW][C]32[/C][C]0.168161[/C][C]1.4169[/C][C]0.080436[/C][/ROW]
[ROW][C]33[/C][C]0.092098[/C][C]0.776[/C][C]0.220154[/C][/ROW]
[ROW][C]34[/C][C]-0.054209[/C][C]-0.4568[/C][C]0.324615[/C][/ROW]
[ROW][C]35[/C][C]-0.142843[/C][C]-1.2036[/C][C]0.116368[/C][/ROW]
[ROW][C]36[/C][C]0.014912[/C][C]0.1256[/C][C]0.450183[/C][/ROW]
[ROW][C]37[/C][C]0.014481[/C][C]0.122[/C][C]0.451614[/C][/ROW]
[ROW][C]38[/C][C]0.070515[/C][C]0.5942[/C][C]0.277142[/C][/ROW]
[ROW][C]39[/C][C]0.046006[/C][C]0.3876[/C][C]0.349718[/C][/ROW]
[ROW][C]40[/C][C]-0.159846[/C][C]-1.3469[/C][C]0.09115[/C][/ROW]
[ROW][C]41[/C][C]0.118956[/C][C]1.0023[/C][C]0.159791[/C][/ROW]
[ROW][C]42[/C][C]-0.017233[/C][C]-0.1452[/C][C]0.442478[/C][/ROW]
[ROW][C]43[/C][C]0.032699[/C][C]0.2755[/C][C]0.391856[/C][/ROW]
[ROW][C]44[/C][C]-0.048125[/C][C]-0.4055[/C][C]0.343162[/C][/ROW]
[ROW][C]45[/C][C]-0.06593[/C][C]-0.5555[/C][C]0.290137[/C][/ROW]
[ROW][C]46[/C][C]0.058545[/C][C]0.4933[/C][C]0.311659[/C][/ROW]
[ROW][C]47[/C][C]0.02823[/C][C]0.2379[/C][C]0.406332[/C][/ROW]
[ROW][C]48[/C][C]-0.026122[/C][C]-0.2201[/C][C]0.413208[/C][/ROW]
[ROW][C]49[/C][C]-0.008611[/C][C]-0.0726[/C][C]0.471182[/C][/ROW]
[ROW][C]50[/C][C]0.024062[/C][C]0.2028[/C][C]0.419955[/C][/ROW]
[ROW][C]51[/C][C]-0.05032[/C][C]-0.424[/C][C]0.336422[/C][/ROW]
[ROW][C]52[/C][C]0.079814[/C][C]0.6725[/C][C]0.251717[/C][/ROW]
[ROW][C]53[/C][C]-0.07718[/C][C]-0.6503[/C][C]0.258789[/C][/ROW]
[ROW][C]54[/C][C]-0.057393[/C][C]-0.4836[/C][C]0.315077[/C][/ROW]
[ROW][C]55[/C][C]0.070075[/C][C]0.5905[/C][C]0.278379[/C][/ROW]
[ROW][C]56[/C][C]0.040844[/C][C]0.3442[/C][C]0.365871[/C][/ROW]
[ROW][C]57[/C][C]-0.002273[/C][C]-0.0192[/C][C]0.492386[/C][/ROW]
[ROW][C]58[/C][C]-0.067063[/C][C]-0.5651[/C][C]0.286898[/C][/ROW]
[ROW][C]59[/C][C]0.046454[/C][C]0.3914[/C][C]0.348328[/C][/ROW]
[ROW][C]60[/C][C]0.02356[/C][C]0.1985[/C][C]0.421603[/C][/ROW]
[/TABLE]
Source: https://freestatistics.org/blog/index.php?pk=195267&T=1

Globally Unique Identifier (entire table): ba.freestatistics.org/blog/index.php?pk=195267&T=1

As an alternative you can also use a QR Code:  

The GUIDs for individual cells are displayed in the table below:

Autocorrelation Function
Time lag kACF(k)T-STATP-value
1-0.294594-2.48230.00771
2-0.195341-1.6460.052094
3-0.050545-0.42590.335736
4-0.059135-0.49830.309912
50.1824631.53750.064312
6-0.010422-0.08780.465135
7-0.111963-0.94340.174333
8-0.027179-0.2290.409758
90.2081721.75410.041865
10-0.020781-0.17510.430749
110.0486490.40990.341548
12-0.376305-3.17080.001122
130.0190890.16080.436336
140.3437452.89640.002507
15-0.142747-1.20280.116524
160.0136760.11520.454292
17-0.058551-0.49340.311642
180.1094020.92180.179867
190.0360340.30360.381151
20-0.096441-0.81260.209575
21-0.099035-0.83450.203404
22-0.027991-0.23590.407112
230.2577062.17150.016619
24-0.057423-0.48390.314988
250.0345630.29120.385862
26-0.231754-1.95280.027393
270.1252331.05520.147449
280.0796970.67150.25203
29-0.080685-0.67990.249402
30-0.025549-0.21530.415083
31-0.123394-1.03970.150994
320.1681611.41690.080436
330.0920980.7760.220154
34-0.054209-0.45680.324615
35-0.142843-1.20360.116368
360.0149120.12560.450183
370.0144810.1220.451614
380.0705150.59420.277142
390.0460060.38760.349718
40-0.159846-1.34690.09115
410.1189561.00230.159791
42-0.017233-0.14520.442478
430.0326990.27550.391856
44-0.048125-0.40550.343162
45-0.06593-0.55550.290137
460.0585450.49330.311659
470.028230.23790.406332
48-0.026122-0.22010.413208
49-0.008611-0.07260.471182
500.0240620.20280.419955
51-0.05032-0.4240.336422
520.0798140.67250.251717
53-0.07718-0.65030.258789
54-0.057393-0.48360.315077
550.0700750.59050.278379
560.0408440.34420.365871
57-0.002273-0.01920.492386
58-0.067063-0.56510.286898
590.0464540.39140.348328
600.023560.19850.421603


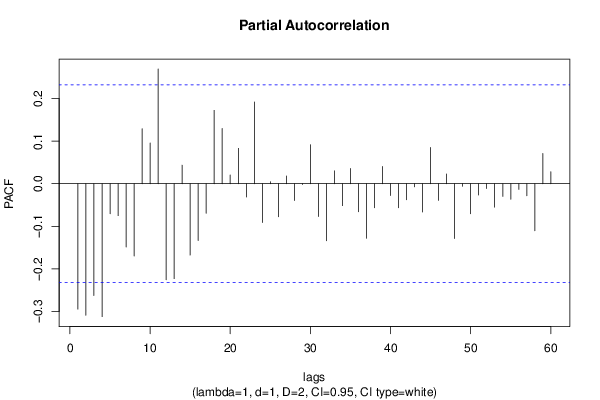
Partial Autocorrelation Function
Time lag kPACF(k)T-STATP-value
1-0.294594-2.48230.00771
2-0.308938-2.60320.005619
3-0.26255-2.21230.015082
4-0.312303-2.63150.00521
5-0.070528-0.59430.277106
6-0.074881-0.6310.265047
7-0.148723-1.25320.107129
8-0.169632-1.42930.078645
90.1291621.08830.140063
100.0958760.80790.210932
110.2697422.27290.013031
12-0.225806-1.90270.030569
13-0.223047-1.87940.032145
140.0436970.36820.356909
15-0.167662-1.41270.081049
16-0.133405-1.12410.13238
17-0.069441-0.58510.280161
180.172511.45360.075232
190.1298221.09390.138848
200.0206780.17420.431087
210.0830760.70.243104
22-0.031213-0.2630.396655
230.1919961.61780.055071
24-0.091-0.76680.222876
250.0048790.04110.483661
26-0.077428-0.65240.258117
270.018070.15230.439705
28-0.03956-0.33330.369931
29-0.001607-0.01350.494617
300.0916720.77240.221209
31-0.076967-0.64850.259364
32-0.134162-1.13050.131041
330.0303240.25550.399533
34-0.051428-0.43330.333041
350.0356620.30050.382338
36-0.065924-0.55550.290154
37-0.128041-1.07890.142144
38-0.056446-0.47560.317903
390.0404180.34060.367218
40-0.027697-0.23340.40807
41-0.056465-0.47580.317845
42-0.03755-0.31640.376314
43-0.00731-0.06160.47553
44-0.066484-0.56020.288552
450.0852350.71820.237494
46-0.039164-0.330.371186
470.0227670.19180.424207
48-0.12886-1.08580.140621
49-0.006096-0.05140.479588
50-0.07055-0.59450.277045
51-0.02645-0.22290.412137
52-0.011025-0.09290.463121
53-0.054966-0.46320.322337
54-0.029756-0.25070.401375
55-0.036283-0.30570.380353
56-0.013221-0.11140.455806
57-0.028117-0.23690.406701
58-0.110399-0.93020.177699
590.0711180.59930.275455
600.0281410.23710.406624

\begin{tabular}{lllllllll}
\hline
Partial Autocorrelation Function \tabularnewline
Time lag k & PACF(k) & T-STAT & P-value \tabularnewline
1 & -0.294594 & -2.4823 & 0.00771 \tabularnewline
2 & -0.308938 & -2.6032 & 0.005619 \tabularnewline
3 & -0.26255 & -2.2123 & 0.015082 \tabularnewline
4 & -0.312303 & -2.6315 & 0.00521 \tabularnewline
5 & -0.070528 & -0.5943 & 0.277106 \tabularnewline
6 & -0.074881 & -0.631 & 0.265047 \tabularnewline
7 & -0.148723 & -1.2532 & 0.107129 \tabularnewline
8 & -0.169632 & -1.4293 & 0.078645 \tabularnewline
9 & 0.129162 & 1.0883 & 0.140063 \tabularnewline
10 & 0.095876 & 0.8079 & 0.210932 \tabularnewline
11 & 0.269742 & 2.2729 & 0.013031 \tabularnewline
12 & -0.225806 & -1.9027 & 0.030569 \tabularnewline
13 & -0.223047 & -1.8794 & 0.032145 \tabularnewline
14 & 0.043697 & 0.3682 & 0.356909 \tabularnewline
15 & -0.167662 & -1.4127 & 0.081049 \tabularnewline
16 & -0.133405 & -1.1241 & 0.13238 \tabularnewline
17 & -0.069441 & -0.5851 & 0.280161 \tabularnewline
18 & 0.17251 & 1.4536 & 0.075232 \tabularnewline
19 & 0.129822 & 1.0939 & 0.138848 \tabularnewline
20 & 0.020678 & 0.1742 & 0.431087 \tabularnewline
21 & 0.083076 & 0.7 & 0.243104 \tabularnewline
22 & -0.031213 & -0.263 & 0.396655 \tabularnewline
23 & 0.191996 & 1.6178 & 0.055071 \tabularnewline
24 & -0.091 & -0.7668 & 0.222876 \tabularnewline
25 & 0.004879 & 0.0411 & 0.483661 \tabularnewline
26 & -0.077428 & -0.6524 & 0.258117 \tabularnewline
27 & 0.01807 & 0.1523 & 0.439705 \tabularnewline
28 & -0.03956 & -0.3333 & 0.369931 \tabularnewline
29 & -0.001607 & -0.0135 & 0.494617 \tabularnewline
30 & 0.091672 & 0.7724 & 0.221209 \tabularnewline
31 & -0.076967 & -0.6485 & 0.259364 \tabularnewline
32 & -0.134162 & -1.1305 & 0.131041 \tabularnewline
33 & 0.030324 & 0.2555 & 0.399533 \tabularnewline
34 & -0.051428 & -0.4333 & 0.333041 \tabularnewline
35 & 0.035662 & 0.3005 & 0.382338 \tabularnewline
36 & -0.065924 & -0.5555 & 0.290154 \tabularnewline
37 & -0.128041 & -1.0789 & 0.142144 \tabularnewline
38 & -0.056446 & -0.4756 & 0.317903 \tabularnewline
39 & 0.040418 & 0.3406 & 0.367218 \tabularnewline
40 & -0.027697 & -0.2334 & 0.40807 \tabularnewline
41 & -0.056465 & -0.4758 & 0.317845 \tabularnewline
42 & -0.03755 & -0.3164 & 0.376314 \tabularnewline
43 & -0.00731 & -0.0616 & 0.47553 \tabularnewline
44 & -0.066484 & -0.5602 & 0.288552 \tabularnewline
45 & 0.085235 & 0.7182 & 0.237494 \tabularnewline
46 & -0.039164 & -0.33 & 0.371186 \tabularnewline
47 & 0.022767 & 0.1918 & 0.424207 \tabularnewline
48 & -0.12886 & -1.0858 & 0.140621 \tabularnewline
49 & -0.006096 & -0.0514 & 0.479588 \tabularnewline
50 & -0.07055 & -0.5945 & 0.277045 \tabularnewline
51 & -0.02645 & -0.2229 & 0.412137 \tabularnewline
52 & -0.011025 & -0.0929 & 0.463121 \tabularnewline
53 & -0.054966 & -0.4632 & 0.322337 \tabularnewline
54 & -0.029756 & -0.2507 & 0.401375 \tabularnewline
55 & -0.036283 & -0.3057 & 0.380353 \tabularnewline
56 & -0.013221 & -0.1114 & 0.455806 \tabularnewline
57 & -0.028117 & -0.2369 & 0.406701 \tabularnewline
58 & -0.110399 & -0.9302 & 0.177699 \tabularnewline
59 & 0.071118 & 0.5993 & 0.275455 \tabularnewline
60 & 0.028141 & 0.2371 & 0.406624 \tabularnewline
\hline
\end{tabular}
%Source: https://freestatistics.org/blog/index.php?pk=195267&T=2

[TABLE]
[ROW][C]Partial Autocorrelation Function[/C][/ROW]
[ROW][C]Time lag k[/C][C]PACF(k)[/C][C]T-STAT[/C][C]P-value[/C][/ROW]
[ROW][C]1[/C][C]-0.294594[/C][C]-2.4823[/C][C]0.00771[/C][/ROW]
[ROW][C]2[/C][C]-0.308938[/C][C]-2.6032[/C][C]0.005619[/C][/ROW]
[ROW][C]3[/C][C]-0.26255[/C][C]-2.2123[/C][C]0.015082[/C][/ROW]
[ROW][C]4[/C][C]-0.312303[/C][C]-2.6315[/C][C]0.00521[/C][/ROW]
[ROW][C]5[/C][C]-0.070528[/C][C]-0.5943[/C][C]0.277106[/C][/ROW]
[ROW][C]6[/C][C]-0.074881[/C][C]-0.631[/C][C]0.265047[/C][/ROW]
[ROW][C]7[/C][C]-0.148723[/C][C]-1.2532[/C][C]0.107129[/C][/ROW]
[ROW][C]8[/C][C]-0.169632[/C][C]-1.4293[/C][C]0.078645[/C][/ROW]
[ROW][C]9[/C][C]0.129162[/C][C]1.0883[/C][C]0.140063[/C][/ROW]
[ROW][C]10[/C][C]0.095876[/C][C]0.8079[/C][C]0.210932[/C][/ROW]
[ROW][C]11[/C][C]0.269742[/C][C]2.2729[/C][C]0.013031[/C][/ROW]
[ROW][C]12[/C][C]-0.225806[/C][C]-1.9027[/C][C]0.030569[/C][/ROW]
[ROW][C]13[/C][C]-0.223047[/C][C]-1.8794[/C][C]0.032145[/C][/ROW]
[ROW][C]14[/C][C]0.043697[/C][C]0.3682[/C][C]0.356909[/C][/ROW]
[ROW][C]15[/C][C]-0.167662[/C][C]-1.4127[/C][C]0.081049[/C][/ROW]
[ROW][C]16[/C][C]-0.133405[/C][C]-1.1241[/C][C]0.13238[/C][/ROW]
[ROW][C]17[/C][C]-0.069441[/C][C]-0.5851[/C][C]0.280161[/C][/ROW]
[ROW][C]18[/C][C]0.17251[/C][C]1.4536[/C][C]0.075232[/C][/ROW]
[ROW][C]19[/C][C]0.129822[/C][C]1.0939[/C][C]0.138848[/C][/ROW]
[ROW][C]20[/C][C]0.020678[/C][C]0.1742[/C][C]0.431087[/C][/ROW]
[ROW][C]21[/C][C]0.083076[/C][C]0.7[/C][C]0.243104[/C][/ROW]
[ROW][C]22[/C][C]-0.031213[/C][C]-0.263[/C][C]0.396655[/C][/ROW]
[ROW][C]23[/C][C]0.191996[/C][C]1.6178[/C][C]0.055071[/C][/ROW]
[ROW][C]24[/C][C]-0.091[/C][C]-0.7668[/C][C]0.222876[/C][/ROW]
[ROW][C]25[/C][C]0.004879[/C][C]0.0411[/C][C]0.483661[/C][/ROW]
[ROW][C]26[/C][C]-0.077428[/C][C]-0.6524[/C][C]0.258117[/C][/ROW]
[ROW][C]27[/C][C]0.01807[/C][C]0.1523[/C][C]0.439705[/C][/ROW]
[ROW][C]28[/C][C]-0.03956[/C][C]-0.3333[/C][C]0.369931[/C][/ROW]
[ROW][C]29[/C][C]-0.001607[/C][C]-0.0135[/C][C]0.494617[/C][/ROW]
[ROW][C]30[/C][C]0.091672[/C][C]0.7724[/C][C]0.221209[/C][/ROW]
[ROW][C]31[/C][C]-0.076967[/C][C]-0.6485[/C][C]0.259364[/C][/ROW]
[ROW][C]32[/C][C]-0.134162[/C][C]-1.1305[/C][C]0.131041[/C][/ROW]
[ROW][C]33[/C][C]0.030324[/C][C]0.2555[/C][C]0.399533[/C][/ROW]
[ROW][C]34[/C][C]-0.051428[/C][C]-0.4333[/C][C]0.333041[/C][/ROW]
[ROW][C]35[/C][C]0.035662[/C][C]0.3005[/C][C]0.382338[/C][/ROW]
[ROW][C]36[/C][C]-0.065924[/C][C]-0.5555[/C][C]0.290154[/C][/ROW]
[ROW][C]37[/C][C]-0.128041[/C][C]-1.0789[/C][C]0.142144[/C][/ROW]
[ROW][C]38[/C][C]-0.056446[/C][C]-0.4756[/C][C]0.317903[/C][/ROW]
[ROW][C]39[/C][C]0.040418[/C][C]0.3406[/C][C]0.367218[/C][/ROW]
[ROW][C]40[/C][C]-0.027697[/C][C]-0.2334[/C][C]0.40807[/C][/ROW]
[ROW][C]41[/C][C]-0.056465[/C][C]-0.4758[/C][C]0.317845[/C][/ROW]
[ROW][C]42[/C][C]-0.03755[/C][C]-0.3164[/C][C]0.376314[/C][/ROW]
[ROW][C]43[/C][C]-0.00731[/C][C]-0.0616[/C][C]0.47553[/C][/ROW]
[ROW][C]44[/C][C]-0.066484[/C][C]-0.5602[/C][C]0.288552[/C][/ROW]
[ROW][C]45[/C][C]0.085235[/C][C]0.7182[/C][C]0.237494[/C][/ROW]
[ROW][C]46[/C][C]-0.039164[/C][C]-0.33[/C][C]0.371186[/C][/ROW]
[ROW][C]47[/C][C]0.022767[/C][C]0.1918[/C][C]0.424207[/C][/ROW]
[ROW][C]48[/C][C]-0.12886[/C][C]-1.0858[/C][C]0.140621[/C][/ROW]
[ROW][C]49[/C][C]-0.006096[/C][C]-0.0514[/C][C]0.479588[/C][/ROW]
[ROW][C]50[/C][C]-0.07055[/C][C]-0.5945[/C][C]0.277045[/C][/ROW]
[ROW][C]51[/C][C]-0.02645[/C][C]-0.2229[/C][C]0.412137[/C][/ROW]
[ROW][C]52[/C][C]-0.011025[/C][C]-0.0929[/C][C]0.463121[/C][/ROW]
[ROW][C]53[/C][C]-0.054966[/C][C]-0.4632[/C][C]0.322337[/C][/ROW]
[ROW][C]54[/C][C]-0.029756[/C][C]-0.2507[/C][C]0.401375[/C][/ROW]
[ROW][C]55[/C][C]-0.036283[/C][C]-0.3057[/C][C]0.380353[/C][/ROW]
[ROW][C]56[/C][C]-0.013221[/C][C]-0.1114[/C][C]0.455806[/C][/ROW]
[ROW][C]57[/C][C]-0.028117[/C][C]-0.2369[/C][C]0.406701[/C][/ROW]
[ROW][C]58[/C][C]-0.110399[/C][C]-0.9302[/C][C]0.177699[/C][/ROW]
[ROW][C]59[/C][C]0.071118[/C][C]0.5993[/C][C]0.275455[/C][/ROW]
[ROW][C]60[/C][C]0.028141[/C][C]0.2371[/C][C]0.406624[/C][/ROW]
[/TABLE]
Source: https://freestatistics.org/blog/index.php?pk=195267&T=2

Globally Unique Identifier (entire table): ba.freestatistics.org/blog/index.php?pk=195267&T=2

As an alternative you can also use a QR Code:  

The GUIDs for individual cells are displayed in the table below:

Partial Autocorrelation Function
Time lag kPACF(k)T-STATP-value
1-0.294594-2.48230.00771
2-0.308938-2.60320.005619
3-0.26255-2.21230.015082
4-0.312303-2.63150.00521
5-0.070528-0.59430.277106
6-0.074881-0.6310.265047
7-0.148723-1.25320.107129
8-0.169632-1.42930.078645
90.1291621.08830.140063
100.0958760.80790.210932
110.2697422.27290.013031
12-0.225806-1.90270.030569
13-0.223047-1.87940.032145
140.0436970.36820.356909
15-0.167662-1.41270.081049
16-0.133405-1.12410.13238
17-0.069441-0.58510.280161
180.172511.45360.075232
190.1298221.09390.138848
200.0206780.17420.431087
210.0830760.70.243104
22-0.031213-0.2630.396655
230.1919961.61780.055071
24-0.091-0.76680.222876
250.0048790.04110.483661
26-0.077428-0.65240.258117
270.018070.15230.439705
28-0.03956-0.33330.369931
29-0.001607-0.01350.494617
300.0916720.77240.221209
31-0.076967-0.64850.259364
32-0.134162-1.13050.131041
330.0303240.25550.399533
34-0.051428-0.43330.333041
350.0356620.30050.382338
36-0.065924-0.55550.290154
37-0.128041-1.07890.142144
38-0.056446-0.47560.317903
390.0404180.34060.367218
40-0.027697-0.23340.40807
41-0.056465-0.47580.317845
42-0.03755-0.31640.376314
43-0.00731-0.06160.47553
44-0.066484-0.56020.288552
450.0852350.71820.237494
46-0.039164-0.330.371186
470.0227670.19180.424207
48-0.12886-1.08580.140621
49-0.006096-0.05140.479588
50-0.07055-0.59450.277045
51-0.02645-0.22290.412137
52-0.011025-0.09290.463121
53-0.054966-0.46320.322337
54-0.029756-0.25070.401375
55-0.036283-0.30570.380353
56-0.013221-0.11140.455806
57-0.028117-0.23690.406701
58-0.110399-0.93020.177699
590.0711180.59930.275455
600.0281410.23710.406624


Parameters (Session):
par1 = 60 ; par2 = 1 ; par3 = 1 ; par4 = 2 ; par5 = 12 ; par6 = White Noise ; par7 = 0.95 ;
Parameters (R input):
par1 = 60 ; par2 = 1 ; par3 = 1 ; par4 = 2 ; par5 = 12 ; par6 = White Noise ; par7 = 0.95 ; par8 = ;
R code (references can be found in the software module):
if (par1 == 'Default') {
par1 = 10*log10(length(x))
} else {
par1 <- as.numeric(par1)
}
par2 <- as.numeric(par2)
par3 <- as.numeric(par3)
par4 <- as.numeric(par4)
par5 <- as.numeric(par5)
if (par6 == 'White Noise') par6 <- 'white' else par6 <- 'ma'
par7 <- as.numeric(par7)
if (par8 != '') par8 <- as.numeric(par8)
ox <- x
if (par8 == '') {
if (par2 == 0) {
x <- log(x)
} else {
x <- (x ^ par2 - 1) / par2
}
} else {
x <- log(x,base=par8)
}
if (par3 > 0) x <- diff(x,lag=1,difference=par3)
if (par4 > 0) x <- diff(x,lag=par5,difference=par4)
bitmap(file='picts.png')
op <- par(mfrow=c(2,1))
plot(ox,type='l',main='Original Time Series',xlab='time',ylab='value')
if (par8=='') {
mytitle <- paste('Working Time Series (lambda=',par2,', d=',par3,', D=',par4,')',sep='')
mysub <- paste('(lambda=',par2,', d=',par3,', D=',par4,', CI=', par7, ', CI type=',par6,')',sep='')
} else {
mytitle <- paste('Working Time Series (base=',par8,', d=',par3,', D=',par4,')',sep='')
mysub <- paste('(base=',par8,', d=',par3,', D=',par4,', CI=', par7, ', CI type=',par6,')',sep='')
}
plot(x,type='l', main=mytitle,xlab='time',ylab='value')
par(op)
dev.off()
bitmap(file='pic1.png')
racf <- acf(x, par1, main='Autocorrelation', xlab='time lag', ylab='ACF', ci.type=par6, ci=par7, sub=mysub)
dev.off()
bitmap(file='pic2.png')
rpacf <- pacf(x,par1,main='Partial Autocorrelation',xlab='lags',ylab='PACF',sub=mysub)
dev.off()
(myacf <- c(racf$acf))
(mypacf <- c(rpacf$acf))
lengthx <- length(x)
sqrtn <- sqrt(lengthx)
load(file='createtable')
a<-table.start()
a<-table.row.start(a)
a<-table.element(a,'Autocorrelation Function',4,TRUE)
a<-table.row.end(a)
a<-table.row.start(a)
a<-table.element(a,'Time lag k',header=TRUE)
a<-table.element(a,hyperlink('basics.htm','ACF(k)','click here for more information about the Autocorrelation Function'),header=TRUE)
a<-table.element(a,'T-STAT',header=TRUE)
a<-table.element(a,'P-value',header=TRUE)
a<-table.row.end(a)
for (i in 2:(par1+1)) {
a<-table.row.start(a)
a<-table.element(a,i-1,header=TRUE)
a<-table.element(a,round(myacf[i],6))
mytstat <- myacf[i]*sqrtn
a<-table.element(a,round(mytstat,4))
a<-table.element(a,round(1-pt(abs(mytstat),lengthx),6))
a<-table.row.end(a)
}
a<-table.end(a)
table.save(a,file='mytable.tab')
a<-table.start()
a<-table.row.start(a)
a<-table.element(a,'Partial Autocorrelation Function',4,TRUE)
a<-table.row.end(a)
a<-table.row.start(a)
a<-table.element(a,'Time lag k',header=TRUE)
a<-table.element(a,hyperlink('basics.htm','PACF(k)','click here for more information about the Partial Autocorrelation Function'),header=TRUE)
a<-table.element(a,'T-STAT',header=TRUE)
a<-table.element(a,'P-value',header=TRUE)
a<-table.row.end(a)
for (i in 1:par1) {
a<-table.row.start(a)
a<-table.element(a,i,header=TRUE)
a<-table.element(a,round(mypacf[i],6))
mytstat <- mypacf[i]*sqrtn
a<-table.element(a,round(mytstat,4))
a<-table.element(a,round(1-pt(abs(mytstat),lengthx),6))
a<-table.row.end(a)
}
a<-table.end(a)
table.save(a,file='mytable1.tab')