Free Statistics

of Irreproducible Research!

Author's title

Author*The author of this computation has been verified*
R Software Modulerwasp_autocorrelation.wasp
Title produced by software(Partial) Autocorrelation Function
Date of computationSat, 01 Dec 2012 07:32:22 -0500
Cite this page as followsStatistical Computations at FreeStatistics.org, Office for Research Development and Education, URL https://freestatistics.org/blog/index.php?v=date/2012/Dec/01/t1354365164n08m9oeh473dnhc.htm/, Retrieved Sun, 28 Apr 2024 22:52:21 +0000
Statistical Computations at FreeStatistics.org, Office for Research Development and Education, URL https://freestatistics.org/blog/index.php?pk=195265, Retrieved Sun, 28 Apr 2024 22:52:21 +0000
QR Codes:

Original text written by user:
IsPrivate?No (this computation is public)
User-defined keywords
Estimated Impact160
Family? (F = Feedback message, R = changed R code, M = changed R Module, P = changed Parameters, D = changed Data)
-     [Univariate Data Series] [Paper - exogene v...] [2010-12-01 16:02:49] [6f0e7a2d1a07390e3505a2db8288f975]
- RMP   [(Partial) Autocorrelation Function] [ACF 1] [2012-12-01 12:28:25] [aa4758794357e809405bf1fb1497cdc4]
- R P       [(Partial) Autocorrelation Function] [ACF 2] [2012-12-01 12:32:22] [4289cf790da1cc09a0cb8798de13fde3] [Current]
Feedback Forum

Post a new message
Dataseries X:
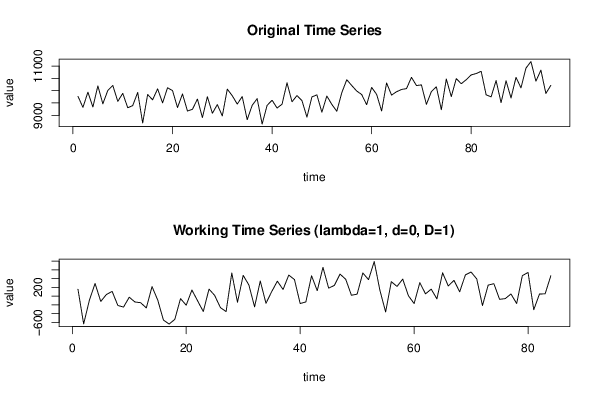
9769
9321
9939
9336
10195
9464
10010
10213
9563
9890
9305
9391
9928
8686
9843
9627
10074
9503
10119
10000
9313
9866
9172
9241
9659
8904
9755
9080
9435
8971
10063
9793
9454
9759
8820
9403
9676
8642
9402
9610
9294
9448
10319
9548
9801
9596
8923
9746
9829
9125
9782
9441
9162
9915
10444
10209
9985
9842
9429
10132
9849
9172
10313
9819
9955
10048
10082
10541
10208
10233
9439
9963
10158
9225
10474
9757
10490
10281
10444
10640
10695
10786
9832
9747
10411
9511
10402
9701
10540
10112
10915
11183
10384
10834
9886
10216


Summary of computational transaction
Raw Inputview raw input (R code)
Raw Outputview raw output of R engine
Computing time2 seconds
R Server'Sir Ronald Aylmer Fisher' @ fisher.wessa.net

\begin{tabular}{lllllllll}
\hline
Summary of computational transaction \tabularnewline
Raw Input & view raw input (R code)  \tabularnewline
Raw Output & view raw output of R engine  \tabularnewline
Computing time & 2 seconds \tabularnewline
R Server & 'Sir Ronald Aylmer Fisher' @ fisher.wessa.net \tabularnewline
\hline
\end{tabular}
%Source: https://freestatistics.org/blog/index.php?pk=195265&T=0

[TABLE]
[ROW][C]Summary of computational transaction[/C][/ROW]
[ROW][C]Raw Input[/C][C]view raw input (R code) [/C][/ROW]
[ROW][C]Raw Output[/C][C]view raw output of R engine [/C][/ROW]
[ROW][C]Computing time[/C][C]2 seconds[/C][/ROW]
[ROW][C]R Server[/C][C]'Sir Ronald Aylmer Fisher' @ fisher.wessa.net[/C][/ROW]
[/TABLE]
Source: https://freestatistics.org/blog/index.php?pk=195265&T=0

Globally Unique Identifier (entire table): ba.freestatistics.org/blog/index.php?pk=195265&T=0

As an alternative you can also use a QR Code:  

The GUIDs for individual cells are displayed in the table below:

Summary of computational transaction
Raw Inputview raw input (R code)
Raw Outputview raw output of R engine
Computing time2 seconds
R Server'Sir Ronald Aylmer Fisher' @ fisher.wessa.net


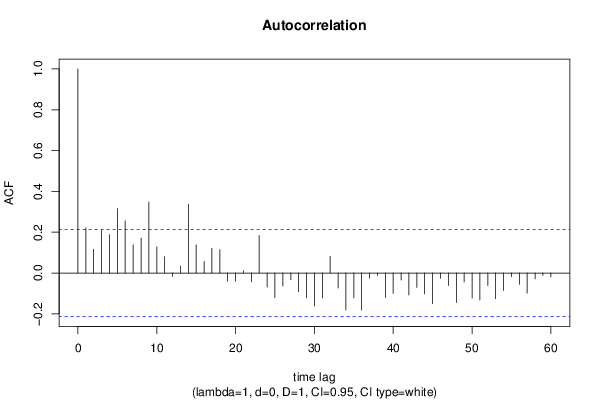
Autocorrelation Function
Time lag kACF(k)T-STATP-value
10.2222082.03660.022422
20.1167451.070.143845
30.209591.92090.029067
40.187941.72250.044329
50.3165522.90120.002372
60.2555112.34180.010779
70.1382961.26750.104238
80.1712391.56940.060153
90.3477083.18680.00101
100.1289251.18160.120347
110.0796860.73030.233609
12-0.017142-0.15710.437769
130.034550.31670.376146
140.3370453.08910.001361
150.1378281.26320.105004
160.0565440.51820.302829
170.1217291.11570.133873
180.114461.0490.148583
19-0.040499-0.37120.35572
20-0.040714-0.37310.354989
210.011870.10880.456813
22-0.042754-0.39180.348081
230.1839571.6860.047754
24-0.068603-0.62880.265609
25-0.12047-1.10410.136346
26-0.063995-0.58650.279549
27-0.032664-0.29940.382699
28-0.091227-0.83610.202732
29-0.121044-1.10940.135215
30-0.161626-1.48130.071131
31-0.121806-1.11640.133722
320.0825610.75670.225678
33-0.073113-0.67010.252318
34-0.181409-1.66260.050055
35-0.121925-1.11750.133491
36-0.181532-1.66380.049943
37-0.026024-0.23850.406031
38-0.012518-0.11470.454467
39-0.120359-1.10310.136565
40-0.099807-0.91470.181471
41-0.033937-0.3110.378273
42-0.107569-0.98590.163509
43-0.070318-0.64450.260513
44-0.102411-0.93860.17531
45-0.150821-1.38230.085273
46-0.025349-0.23230.408423
47-0.061573-0.56430.287017
48-0.144696-1.32620.094191
49-0.043337-0.39720.346116
50-0.123178-1.12890.131067
51-0.131539-1.20560.115683
52-0.061046-0.55950.288658
53-0.126454-1.1590.124876
54-0.085983-0.7880.216443
55-0.017736-0.16260.435629
56-0.055452-0.50820.306314
57-0.098461-0.90240.184709
58-0.028883-0.26470.395937
59-0.012355-0.11320.455055
60-0.019701-0.18060.428571

\begin{tabular}{lllllllll}
\hline
Autocorrelation Function \tabularnewline
Time lag k & ACF(k) & T-STAT & P-value \tabularnewline
1 & 0.222208 & 2.0366 & 0.022422 \tabularnewline
2 & 0.116745 & 1.07 & 0.143845 \tabularnewline
3 & 0.20959 & 1.9209 & 0.029067 \tabularnewline
4 & 0.18794 & 1.7225 & 0.044329 \tabularnewline
5 & 0.316552 & 2.9012 & 0.002372 \tabularnewline
6 & 0.255511 & 2.3418 & 0.010779 \tabularnewline
7 & 0.138296 & 1.2675 & 0.104238 \tabularnewline
8 & 0.171239 & 1.5694 & 0.060153 \tabularnewline
9 & 0.347708 & 3.1868 & 0.00101 \tabularnewline
10 & 0.128925 & 1.1816 & 0.120347 \tabularnewline
11 & 0.079686 & 0.7303 & 0.233609 \tabularnewline
12 & -0.017142 & -0.1571 & 0.437769 \tabularnewline
13 & 0.03455 & 0.3167 & 0.376146 \tabularnewline
14 & 0.337045 & 3.0891 & 0.001361 \tabularnewline
15 & 0.137828 & 1.2632 & 0.105004 \tabularnewline
16 & 0.056544 & 0.5182 & 0.302829 \tabularnewline
17 & 0.121729 & 1.1157 & 0.133873 \tabularnewline
18 & 0.11446 & 1.049 & 0.148583 \tabularnewline
19 & -0.040499 & -0.3712 & 0.35572 \tabularnewline
20 & -0.040714 & -0.3731 & 0.354989 \tabularnewline
21 & 0.01187 & 0.1088 & 0.456813 \tabularnewline
22 & -0.042754 & -0.3918 & 0.348081 \tabularnewline
23 & 0.183957 & 1.686 & 0.047754 \tabularnewline
24 & -0.068603 & -0.6288 & 0.265609 \tabularnewline
25 & -0.12047 & -1.1041 & 0.136346 \tabularnewline
26 & -0.063995 & -0.5865 & 0.279549 \tabularnewline
27 & -0.032664 & -0.2994 & 0.382699 \tabularnewline
28 & -0.091227 & -0.8361 & 0.202732 \tabularnewline
29 & -0.121044 & -1.1094 & 0.135215 \tabularnewline
30 & -0.161626 & -1.4813 & 0.071131 \tabularnewline
31 & -0.121806 & -1.1164 & 0.133722 \tabularnewline
32 & 0.082561 & 0.7567 & 0.225678 \tabularnewline
33 & -0.073113 & -0.6701 & 0.252318 \tabularnewline
34 & -0.181409 & -1.6626 & 0.050055 \tabularnewline
35 & -0.121925 & -1.1175 & 0.133491 \tabularnewline
36 & -0.181532 & -1.6638 & 0.049943 \tabularnewline
37 & -0.026024 & -0.2385 & 0.406031 \tabularnewline
38 & -0.012518 & -0.1147 & 0.454467 \tabularnewline
39 & -0.120359 & -1.1031 & 0.136565 \tabularnewline
40 & -0.099807 & -0.9147 & 0.181471 \tabularnewline
41 & -0.033937 & -0.311 & 0.378273 \tabularnewline
42 & -0.107569 & -0.9859 & 0.163509 \tabularnewline
43 & -0.070318 & -0.6445 & 0.260513 \tabularnewline
44 & -0.102411 & -0.9386 & 0.17531 \tabularnewline
45 & -0.150821 & -1.3823 & 0.085273 \tabularnewline
46 & -0.025349 & -0.2323 & 0.408423 \tabularnewline
47 & -0.061573 & -0.5643 & 0.287017 \tabularnewline
48 & -0.144696 & -1.3262 & 0.094191 \tabularnewline
49 & -0.043337 & -0.3972 & 0.346116 \tabularnewline
50 & -0.123178 & -1.1289 & 0.131067 \tabularnewline
51 & -0.131539 & -1.2056 & 0.115683 \tabularnewline
52 & -0.061046 & -0.5595 & 0.288658 \tabularnewline
53 & -0.126454 & -1.159 & 0.124876 \tabularnewline
54 & -0.085983 & -0.788 & 0.216443 \tabularnewline
55 & -0.017736 & -0.1626 & 0.435629 \tabularnewline
56 & -0.055452 & -0.5082 & 0.306314 \tabularnewline
57 & -0.098461 & -0.9024 & 0.184709 \tabularnewline
58 & -0.028883 & -0.2647 & 0.395937 \tabularnewline
59 & -0.012355 & -0.1132 & 0.455055 \tabularnewline
60 & -0.019701 & -0.1806 & 0.428571 \tabularnewline
\hline
\end{tabular}
%Source: https://freestatistics.org/blog/index.php?pk=195265&T=1

[TABLE]
[ROW][C]Autocorrelation Function[/C][/ROW]
[ROW][C]Time lag k[/C][C]ACF(k)[/C][C]T-STAT[/C][C]P-value[/C][/ROW]
[ROW][C]1[/C][C]0.222208[/C][C]2.0366[/C][C]0.022422[/C][/ROW]
[ROW][C]2[/C][C]0.116745[/C][C]1.07[/C][C]0.143845[/C][/ROW]
[ROW][C]3[/C][C]0.20959[/C][C]1.9209[/C][C]0.029067[/C][/ROW]
[ROW][C]4[/C][C]0.18794[/C][C]1.7225[/C][C]0.044329[/C][/ROW]
[ROW][C]5[/C][C]0.316552[/C][C]2.9012[/C][C]0.002372[/C][/ROW]
[ROW][C]6[/C][C]0.255511[/C][C]2.3418[/C][C]0.010779[/C][/ROW]
[ROW][C]7[/C][C]0.138296[/C][C]1.2675[/C][C]0.104238[/C][/ROW]
[ROW][C]8[/C][C]0.171239[/C][C]1.5694[/C][C]0.060153[/C][/ROW]
[ROW][C]9[/C][C]0.347708[/C][C]3.1868[/C][C]0.00101[/C][/ROW]
[ROW][C]10[/C][C]0.128925[/C][C]1.1816[/C][C]0.120347[/C][/ROW]
[ROW][C]11[/C][C]0.079686[/C][C]0.7303[/C][C]0.233609[/C][/ROW]
[ROW][C]12[/C][C]-0.017142[/C][C]-0.1571[/C][C]0.437769[/C][/ROW]
[ROW][C]13[/C][C]0.03455[/C][C]0.3167[/C][C]0.376146[/C][/ROW]
[ROW][C]14[/C][C]0.337045[/C][C]3.0891[/C][C]0.001361[/C][/ROW]
[ROW][C]15[/C][C]0.137828[/C][C]1.2632[/C][C]0.105004[/C][/ROW]
[ROW][C]16[/C][C]0.056544[/C][C]0.5182[/C][C]0.302829[/C][/ROW]
[ROW][C]17[/C][C]0.121729[/C][C]1.1157[/C][C]0.133873[/C][/ROW]
[ROW][C]18[/C][C]0.11446[/C][C]1.049[/C][C]0.148583[/C][/ROW]
[ROW][C]19[/C][C]-0.040499[/C][C]-0.3712[/C][C]0.35572[/C][/ROW]
[ROW][C]20[/C][C]-0.040714[/C][C]-0.3731[/C][C]0.354989[/C][/ROW]
[ROW][C]21[/C][C]0.01187[/C][C]0.1088[/C][C]0.456813[/C][/ROW]
[ROW][C]22[/C][C]-0.042754[/C][C]-0.3918[/C][C]0.348081[/C][/ROW]
[ROW][C]23[/C][C]0.183957[/C][C]1.686[/C][C]0.047754[/C][/ROW]
[ROW][C]24[/C][C]-0.068603[/C][C]-0.6288[/C][C]0.265609[/C][/ROW]
[ROW][C]25[/C][C]-0.12047[/C][C]-1.1041[/C][C]0.136346[/C][/ROW]
[ROW][C]26[/C][C]-0.063995[/C][C]-0.5865[/C][C]0.279549[/C][/ROW]
[ROW][C]27[/C][C]-0.032664[/C][C]-0.2994[/C][C]0.382699[/C][/ROW]
[ROW][C]28[/C][C]-0.091227[/C][C]-0.8361[/C][C]0.202732[/C][/ROW]
[ROW][C]29[/C][C]-0.121044[/C][C]-1.1094[/C][C]0.135215[/C][/ROW]
[ROW][C]30[/C][C]-0.161626[/C][C]-1.4813[/C][C]0.071131[/C][/ROW]
[ROW][C]31[/C][C]-0.121806[/C][C]-1.1164[/C][C]0.133722[/C][/ROW]
[ROW][C]32[/C][C]0.082561[/C][C]0.7567[/C][C]0.225678[/C][/ROW]
[ROW][C]33[/C][C]-0.073113[/C][C]-0.6701[/C][C]0.252318[/C][/ROW]
[ROW][C]34[/C][C]-0.181409[/C][C]-1.6626[/C][C]0.050055[/C][/ROW]
[ROW][C]35[/C][C]-0.121925[/C][C]-1.1175[/C][C]0.133491[/C][/ROW]
[ROW][C]36[/C][C]-0.181532[/C][C]-1.6638[/C][C]0.049943[/C][/ROW]
[ROW][C]37[/C][C]-0.026024[/C][C]-0.2385[/C][C]0.406031[/C][/ROW]
[ROW][C]38[/C][C]-0.012518[/C][C]-0.1147[/C][C]0.454467[/C][/ROW]
[ROW][C]39[/C][C]-0.120359[/C][C]-1.1031[/C][C]0.136565[/C][/ROW]
[ROW][C]40[/C][C]-0.099807[/C][C]-0.9147[/C][C]0.181471[/C][/ROW]
[ROW][C]41[/C][C]-0.033937[/C][C]-0.311[/C][C]0.378273[/C][/ROW]
[ROW][C]42[/C][C]-0.107569[/C][C]-0.9859[/C][C]0.163509[/C][/ROW]
[ROW][C]43[/C][C]-0.070318[/C][C]-0.6445[/C][C]0.260513[/C][/ROW]
[ROW][C]44[/C][C]-0.102411[/C][C]-0.9386[/C][C]0.17531[/C][/ROW]
[ROW][C]45[/C][C]-0.150821[/C][C]-1.3823[/C][C]0.085273[/C][/ROW]
[ROW][C]46[/C][C]-0.025349[/C][C]-0.2323[/C][C]0.408423[/C][/ROW]
[ROW][C]47[/C][C]-0.061573[/C][C]-0.5643[/C][C]0.287017[/C][/ROW]
[ROW][C]48[/C][C]-0.144696[/C][C]-1.3262[/C][C]0.094191[/C][/ROW]
[ROW][C]49[/C][C]-0.043337[/C][C]-0.3972[/C][C]0.346116[/C][/ROW]
[ROW][C]50[/C][C]-0.123178[/C][C]-1.1289[/C][C]0.131067[/C][/ROW]
[ROW][C]51[/C][C]-0.131539[/C][C]-1.2056[/C][C]0.115683[/C][/ROW]
[ROW][C]52[/C][C]-0.061046[/C][C]-0.5595[/C][C]0.288658[/C][/ROW]
[ROW][C]53[/C][C]-0.126454[/C][C]-1.159[/C][C]0.124876[/C][/ROW]
[ROW][C]54[/C][C]-0.085983[/C][C]-0.788[/C][C]0.216443[/C][/ROW]
[ROW][C]55[/C][C]-0.017736[/C][C]-0.1626[/C][C]0.435629[/C][/ROW]
[ROW][C]56[/C][C]-0.055452[/C][C]-0.5082[/C][C]0.306314[/C][/ROW]
[ROW][C]57[/C][C]-0.098461[/C][C]-0.9024[/C][C]0.184709[/C][/ROW]
[ROW][C]58[/C][C]-0.028883[/C][C]-0.2647[/C][C]0.395937[/C][/ROW]
[ROW][C]59[/C][C]-0.012355[/C][C]-0.1132[/C][C]0.455055[/C][/ROW]
[ROW][C]60[/C][C]-0.019701[/C][C]-0.1806[/C][C]0.428571[/C][/ROW]
[/TABLE]
Source: https://freestatistics.org/blog/index.php?pk=195265&T=1

Globally Unique Identifier (entire table): ba.freestatistics.org/blog/index.php?pk=195265&T=1

As an alternative you can also use a QR Code:  

The GUIDs for individual cells are displayed in the table below:

Autocorrelation Function
Time lag kACF(k)T-STATP-value
10.2222082.03660.022422
20.1167451.070.143845
30.209591.92090.029067
40.187941.72250.044329
50.3165522.90120.002372
60.2555112.34180.010779
70.1382961.26750.104238
80.1712391.56940.060153
90.3477083.18680.00101
100.1289251.18160.120347
110.0796860.73030.233609
12-0.017142-0.15710.437769
130.034550.31670.376146
140.3370453.08910.001361
150.1378281.26320.105004
160.0565440.51820.302829
170.1217291.11570.133873
180.114461.0490.148583
19-0.040499-0.37120.35572
20-0.040714-0.37310.354989
210.011870.10880.456813
22-0.042754-0.39180.348081
230.1839571.6860.047754
24-0.068603-0.62880.265609
25-0.12047-1.10410.136346
26-0.063995-0.58650.279549
27-0.032664-0.29940.382699
28-0.091227-0.83610.202732
29-0.121044-1.10940.135215
30-0.161626-1.48130.071131
31-0.121806-1.11640.133722
320.0825610.75670.225678
33-0.073113-0.67010.252318
34-0.181409-1.66260.050055
35-0.121925-1.11750.133491
36-0.181532-1.66380.049943
37-0.026024-0.23850.406031
38-0.012518-0.11470.454467
39-0.120359-1.10310.136565
40-0.099807-0.91470.181471
41-0.033937-0.3110.378273
42-0.107569-0.98590.163509
43-0.070318-0.64450.260513
44-0.102411-0.93860.17531
45-0.150821-1.38230.085273
46-0.025349-0.23230.408423
47-0.061573-0.56430.287017
48-0.144696-1.32620.094191
49-0.043337-0.39720.346116
50-0.123178-1.12890.131067
51-0.131539-1.20560.115683
52-0.061046-0.55950.288658
53-0.126454-1.1590.124876
54-0.085983-0.7880.216443
55-0.017736-0.16260.435629
56-0.055452-0.50820.306314
57-0.098461-0.90240.184709
58-0.028883-0.26470.395937
59-0.012355-0.11320.455055
60-0.019701-0.18060.428571


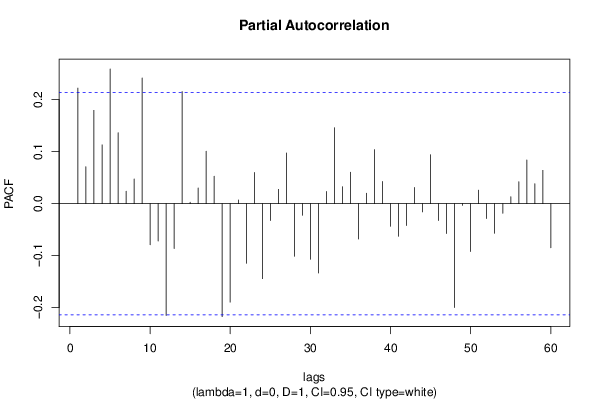
Partial Autocorrelation Function
Time lag kPACF(k)T-STATP-value
10.2222082.03660.022422
20.0708680.64950.258888
30.1794571.64480.051879
40.1130761.03640.151504
50.2591032.37470.00992
60.1364081.25020.10735
70.0238120.21820.413885
80.0473070.43360.332856
90.2418322.21640.014683
10-0.079304-0.72680.234673
11-0.071824-0.65830.256079
12-0.215246-1.97280.025906
13-0.086512-0.79290.215035
140.2154651.97480.02579
150.0027340.02510.490035
160.0299580.27460.39216
170.1007090.9230.179321
180.0526290.48240.315404
19-0.217464-1.99310.024749
20-0.189514-1.73690.043033
210.0069680.06390.474616
22-0.114736-1.05160.148006
230.059770.54780.292641
24-0.144347-1.3230.094719
25-0.032607-0.29880.382897
260.0274680.25170.400926
270.0974180.89290.187243
28-0.101231-0.92780.178085
29-0.022237-0.20380.419499
30-0.107016-0.98080.16475
31-0.133406-1.22270.112433
320.0233460.2140.415545
330.1458791.3370.092416
340.0325030.29790.383258
350.0603730.55330.290754
36-0.067987-0.62310.26745
370.0200120.18340.427457
380.1038870.95210.171878
390.0426250.39070.348516
40-0.043465-0.39840.345686
41-0.062935-0.57680.282807
42-0.042214-0.38690.349905
430.0311780.28570.387887
44-0.015911-0.14580.442203
450.0941540.86290.195315
46-0.032343-0.29640.383816
47-0.057648-0.52840.299323
48-0.19991-1.83220.035232
49-0.003421-0.03140.48753
50-0.091996-0.84320.200768
510.0259120.23750.406429
52-0.028778-0.26380.396309
53-0.056954-0.5220.301524
54-0.018649-0.17090.432348
550.0131180.12020.452295
560.0420180.38510.350567
570.0838180.76820.222259
580.0382350.35040.363446
590.064060.58710.27935
60-0.084936-0.77850.219245

\begin{tabular}{lllllllll}
\hline
Partial Autocorrelation Function \tabularnewline
Time lag k & PACF(k) & T-STAT & P-value \tabularnewline
1 & 0.222208 & 2.0366 & 0.022422 \tabularnewline
2 & 0.070868 & 0.6495 & 0.258888 \tabularnewline
3 & 0.179457 & 1.6448 & 0.051879 \tabularnewline
4 & 0.113076 & 1.0364 & 0.151504 \tabularnewline
5 & 0.259103 & 2.3747 & 0.00992 \tabularnewline
6 & 0.136408 & 1.2502 & 0.10735 \tabularnewline
7 & 0.023812 & 0.2182 & 0.413885 \tabularnewline
8 & 0.047307 & 0.4336 & 0.332856 \tabularnewline
9 & 0.241832 & 2.2164 & 0.014683 \tabularnewline
10 & -0.079304 & -0.7268 & 0.234673 \tabularnewline
11 & -0.071824 & -0.6583 & 0.256079 \tabularnewline
12 & -0.215246 & -1.9728 & 0.025906 \tabularnewline
13 & -0.086512 & -0.7929 & 0.215035 \tabularnewline
14 & 0.215465 & 1.9748 & 0.02579 \tabularnewline
15 & 0.002734 & 0.0251 & 0.490035 \tabularnewline
16 & 0.029958 & 0.2746 & 0.39216 \tabularnewline
17 & 0.100709 & 0.923 & 0.179321 \tabularnewline
18 & 0.052629 & 0.4824 & 0.315404 \tabularnewline
19 & -0.217464 & -1.9931 & 0.024749 \tabularnewline
20 & -0.189514 & -1.7369 & 0.043033 \tabularnewline
21 & 0.006968 & 0.0639 & 0.474616 \tabularnewline
22 & -0.114736 & -1.0516 & 0.148006 \tabularnewline
23 & 0.05977 & 0.5478 & 0.292641 \tabularnewline
24 & -0.144347 & -1.323 & 0.094719 \tabularnewline
25 & -0.032607 & -0.2988 & 0.382897 \tabularnewline
26 & 0.027468 & 0.2517 & 0.400926 \tabularnewline
27 & 0.097418 & 0.8929 & 0.187243 \tabularnewline
28 & -0.101231 & -0.9278 & 0.178085 \tabularnewline
29 & -0.022237 & -0.2038 & 0.419499 \tabularnewline
30 & -0.107016 & -0.9808 & 0.16475 \tabularnewline
31 & -0.133406 & -1.2227 & 0.112433 \tabularnewline
32 & 0.023346 & 0.214 & 0.415545 \tabularnewline
33 & 0.145879 & 1.337 & 0.092416 \tabularnewline
34 & 0.032503 & 0.2979 & 0.383258 \tabularnewline
35 & 0.060373 & 0.5533 & 0.290754 \tabularnewline
36 & -0.067987 & -0.6231 & 0.26745 \tabularnewline
37 & 0.020012 & 0.1834 & 0.427457 \tabularnewline
38 & 0.103887 & 0.9521 & 0.171878 \tabularnewline
39 & 0.042625 & 0.3907 & 0.348516 \tabularnewline
40 & -0.043465 & -0.3984 & 0.345686 \tabularnewline
41 & -0.062935 & -0.5768 & 0.282807 \tabularnewline
42 & -0.042214 & -0.3869 & 0.349905 \tabularnewline
43 & 0.031178 & 0.2857 & 0.387887 \tabularnewline
44 & -0.015911 & -0.1458 & 0.442203 \tabularnewline
45 & 0.094154 & 0.8629 & 0.195315 \tabularnewline
46 & -0.032343 & -0.2964 & 0.383816 \tabularnewline
47 & -0.057648 & -0.5284 & 0.299323 \tabularnewline
48 & -0.19991 & -1.8322 & 0.035232 \tabularnewline
49 & -0.003421 & -0.0314 & 0.48753 \tabularnewline
50 & -0.091996 & -0.8432 & 0.200768 \tabularnewline
51 & 0.025912 & 0.2375 & 0.406429 \tabularnewline
52 & -0.028778 & -0.2638 & 0.396309 \tabularnewline
53 & -0.056954 & -0.522 & 0.301524 \tabularnewline
54 & -0.018649 & -0.1709 & 0.432348 \tabularnewline
55 & 0.013118 & 0.1202 & 0.452295 \tabularnewline
56 & 0.042018 & 0.3851 & 0.350567 \tabularnewline
57 & 0.083818 & 0.7682 & 0.222259 \tabularnewline
58 & 0.038235 & 0.3504 & 0.363446 \tabularnewline
59 & 0.06406 & 0.5871 & 0.27935 \tabularnewline
60 & -0.084936 & -0.7785 & 0.219245 \tabularnewline
\hline
\end{tabular}
%Source: https://freestatistics.org/blog/index.php?pk=195265&T=2

[TABLE]
[ROW][C]Partial Autocorrelation Function[/C][/ROW]
[ROW][C]Time lag k[/C][C]PACF(k)[/C][C]T-STAT[/C][C]P-value[/C][/ROW]
[ROW][C]1[/C][C]0.222208[/C][C]2.0366[/C][C]0.022422[/C][/ROW]
[ROW][C]2[/C][C]0.070868[/C][C]0.6495[/C][C]0.258888[/C][/ROW]
[ROW][C]3[/C][C]0.179457[/C][C]1.6448[/C][C]0.051879[/C][/ROW]
[ROW][C]4[/C][C]0.113076[/C][C]1.0364[/C][C]0.151504[/C][/ROW]
[ROW][C]5[/C][C]0.259103[/C][C]2.3747[/C][C]0.00992[/C][/ROW]
[ROW][C]6[/C][C]0.136408[/C][C]1.2502[/C][C]0.10735[/C][/ROW]
[ROW][C]7[/C][C]0.023812[/C][C]0.2182[/C][C]0.413885[/C][/ROW]
[ROW][C]8[/C][C]0.047307[/C][C]0.4336[/C][C]0.332856[/C][/ROW]
[ROW][C]9[/C][C]0.241832[/C][C]2.2164[/C][C]0.014683[/C][/ROW]
[ROW][C]10[/C][C]-0.079304[/C][C]-0.7268[/C][C]0.234673[/C][/ROW]
[ROW][C]11[/C][C]-0.071824[/C][C]-0.6583[/C][C]0.256079[/C][/ROW]
[ROW][C]12[/C][C]-0.215246[/C][C]-1.9728[/C][C]0.025906[/C][/ROW]
[ROW][C]13[/C][C]-0.086512[/C][C]-0.7929[/C][C]0.215035[/C][/ROW]
[ROW][C]14[/C][C]0.215465[/C][C]1.9748[/C][C]0.02579[/C][/ROW]
[ROW][C]15[/C][C]0.002734[/C][C]0.0251[/C][C]0.490035[/C][/ROW]
[ROW][C]16[/C][C]0.029958[/C][C]0.2746[/C][C]0.39216[/C][/ROW]
[ROW][C]17[/C][C]0.100709[/C][C]0.923[/C][C]0.179321[/C][/ROW]
[ROW][C]18[/C][C]0.052629[/C][C]0.4824[/C][C]0.315404[/C][/ROW]
[ROW][C]19[/C][C]-0.217464[/C][C]-1.9931[/C][C]0.024749[/C][/ROW]
[ROW][C]20[/C][C]-0.189514[/C][C]-1.7369[/C][C]0.043033[/C][/ROW]
[ROW][C]21[/C][C]0.006968[/C][C]0.0639[/C][C]0.474616[/C][/ROW]
[ROW][C]22[/C][C]-0.114736[/C][C]-1.0516[/C][C]0.148006[/C][/ROW]
[ROW][C]23[/C][C]0.05977[/C][C]0.5478[/C][C]0.292641[/C][/ROW]
[ROW][C]24[/C][C]-0.144347[/C][C]-1.323[/C][C]0.094719[/C][/ROW]
[ROW][C]25[/C][C]-0.032607[/C][C]-0.2988[/C][C]0.382897[/C][/ROW]
[ROW][C]26[/C][C]0.027468[/C][C]0.2517[/C][C]0.400926[/C][/ROW]
[ROW][C]27[/C][C]0.097418[/C][C]0.8929[/C][C]0.187243[/C][/ROW]
[ROW][C]28[/C][C]-0.101231[/C][C]-0.9278[/C][C]0.178085[/C][/ROW]
[ROW][C]29[/C][C]-0.022237[/C][C]-0.2038[/C][C]0.419499[/C][/ROW]
[ROW][C]30[/C][C]-0.107016[/C][C]-0.9808[/C][C]0.16475[/C][/ROW]
[ROW][C]31[/C][C]-0.133406[/C][C]-1.2227[/C][C]0.112433[/C][/ROW]
[ROW][C]32[/C][C]0.023346[/C][C]0.214[/C][C]0.415545[/C][/ROW]
[ROW][C]33[/C][C]0.145879[/C][C]1.337[/C][C]0.092416[/C][/ROW]
[ROW][C]34[/C][C]0.032503[/C][C]0.2979[/C][C]0.383258[/C][/ROW]
[ROW][C]35[/C][C]0.060373[/C][C]0.5533[/C][C]0.290754[/C][/ROW]
[ROW][C]36[/C][C]-0.067987[/C][C]-0.6231[/C][C]0.26745[/C][/ROW]
[ROW][C]37[/C][C]0.020012[/C][C]0.1834[/C][C]0.427457[/C][/ROW]
[ROW][C]38[/C][C]0.103887[/C][C]0.9521[/C][C]0.171878[/C][/ROW]
[ROW][C]39[/C][C]0.042625[/C][C]0.3907[/C][C]0.348516[/C][/ROW]
[ROW][C]40[/C][C]-0.043465[/C][C]-0.3984[/C][C]0.345686[/C][/ROW]
[ROW][C]41[/C][C]-0.062935[/C][C]-0.5768[/C][C]0.282807[/C][/ROW]
[ROW][C]42[/C][C]-0.042214[/C][C]-0.3869[/C][C]0.349905[/C][/ROW]
[ROW][C]43[/C][C]0.031178[/C][C]0.2857[/C][C]0.387887[/C][/ROW]
[ROW][C]44[/C][C]-0.015911[/C][C]-0.1458[/C][C]0.442203[/C][/ROW]
[ROW][C]45[/C][C]0.094154[/C][C]0.8629[/C][C]0.195315[/C][/ROW]
[ROW][C]46[/C][C]-0.032343[/C][C]-0.2964[/C][C]0.383816[/C][/ROW]
[ROW][C]47[/C][C]-0.057648[/C][C]-0.5284[/C][C]0.299323[/C][/ROW]
[ROW][C]48[/C][C]-0.19991[/C][C]-1.8322[/C][C]0.035232[/C][/ROW]
[ROW][C]49[/C][C]-0.003421[/C][C]-0.0314[/C][C]0.48753[/C][/ROW]
[ROW][C]50[/C][C]-0.091996[/C][C]-0.8432[/C][C]0.200768[/C][/ROW]
[ROW][C]51[/C][C]0.025912[/C][C]0.2375[/C][C]0.406429[/C][/ROW]
[ROW][C]52[/C][C]-0.028778[/C][C]-0.2638[/C][C]0.396309[/C][/ROW]
[ROW][C]53[/C][C]-0.056954[/C][C]-0.522[/C][C]0.301524[/C][/ROW]
[ROW][C]54[/C][C]-0.018649[/C][C]-0.1709[/C][C]0.432348[/C][/ROW]
[ROW][C]55[/C][C]0.013118[/C][C]0.1202[/C][C]0.452295[/C][/ROW]
[ROW][C]56[/C][C]0.042018[/C][C]0.3851[/C][C]0.350567[/C][/ROW]
[ROW][C]57[/C][C]0.083818[/C][C]0.7682[/C][C]0.222259[/C][/ROW]
[ROW][C]58[/C][C]0.038235[/C][C]0.3504[/C][C]0.363446[/C][/ROW]
[ROW][C]59[/C][C]0.06406[/C][C]0.5871[/C][C]0.27935[/C][/ROW]
[ROW][C]60[/C][C]-0.084936[/C][C]-0.7785[/C][C]0.219245[/C][/ROW]
[/TABLE]
Source: https://freestatistics.org/blog/index.php?pk=195265&T=2

Globally Unique Identifier (entire table): ba.freestatistics.org/blog/index.php?pk=195265&T=2

As an alternative you can also use a QR Code:  

The GUIDs for individual cells are displayed in the table below:

Partial Autocorrelation Function
Time lag kPACF(k)T-STATP-value
10.2222082.03660.022422
20.0708680.64950.258888
30.1794571.64480.051879
40.1130761.03640.151504
50.2591032.37470.00992
60.1364081.25020.10735
70.0238120.21820.413885
80.0473070.43360.332856
90.2418322.21640.014683
10-0.079304-0.72680.234673
11-0.071824-0.65830.256079
12-0.215246-1.97280.025906
13-0.086512-0.79290.215035
140.2154651.97480.02579
150.0027340.02510.490035
160.0299580.27460.39216
170.1007090.9230.179321
180.0526290.48240.315404
19-0.217464-1.99310.024749
20-0.189514-1.73690.043033
210.0069680.06390.474616
22-0.114736-1.05160.148006
230.059770.54780.292641
24-0.144347-1.3230.094719
25-0.032607-0.29880.382897
260.0274680.25170.400926
270.0974180.89290.187243
28-0.101231-0.92780.178085
29-0.022237-0.20380.419499
30-0.107016-0.98080.16475
31-0.133406-1.22270.112433
320.0233460.2140.415545
330.1458791.3370.092416
340.0325030.29790.383258
350.0603730.55330.290754
36-0.067987-0.62310.26745
370.0200120.18340.427457
380.1038870.95210.171878
390.0426250.39070.348516
40-0.043465-0.39840.345686
41-0.062935-0.57680.282807
42-0.042214-0.38690.349905
430.0311780.28570.387887
44-0.015911-0.14580.442203
450.0941540.86290.195315
46-0.032343-0.29640.383816
47-0.057648-0.52840.299323
48-0.19991-1.83220.035232
49-0.003421-0.03140.48753
50-0.091996-0.84320.200768
510.0259120.23750.406429
52-0.028778-0.26380.396309
53-0.056954-0.5220.301524
54-0.018649-0.17090.432348
550.0131180.12020.452295
560.0420180.38510.350567
570.0838180.76820.222259
580.0382350.35040.363446
590.064060.58710.27935
60-0.084936-0.77850.219245


Parameters (Session):
par1 = 60 ; par2 = 1 ; par3 = 0 ; par4 = 1 ; par5 = 12 ; par6 = White Noise ; par7 = 0.95 ;
Parameters (R input):
par1 = 60 ; par2 = 1 ; par3 = 0 ; par4 = 1 ; par5 = 12 ; par6 = White Noise ; par7 = 0.95 ; par8 = ;
R code (references can be found in the software module):
if (par1 == 'Default') {
par1 = 10*log10(length(x))
} else {
par1 <- as.numeric(par1)
}
par2 <- as.numeric(par2)
par3 <- as.numeric(par3)
par4 <- as.numeric(par4)
par5 <- as.numeric(par5)
if (par6 == 'White Noise') par6 <- 'white' else par6 <- 'ma'
par7 <- as.numeric(par7)
if (par8 != '') par8 <- as.numeric(par8)
ox <- x
if (par8 == '') {
if (par2 == 0) {
x <- log(x)
} else {
x <- (x ^ par2 - 1) / par2
}
} else {
x <- log(x,base=par8)
}
if (par3 > 0) x <- diff(x,lag=1,difference=par3)
if (par4 > 0) x <- diff(x,lag=par5,difference=par4)
bitmap(file='picts.png')
op <- par(mfrow=c(2,1))
plot(ox,type='l',main='Original Time Series',xlab='time',ylab='value')
if (par8=='') {
mytitle <- paste('Working Time Series (lambda=',par2,', d=',par3,', D=',par4,')',sep='')
mysub <- paste('(lambda=',par2,', d=',par3,', D=',par4,', CI=', par7, ', CI type=',par6,')',sep='')
} else {
mytitle <- paste('Working Time Series (base=',par8,', d=',par3,', D=',par4,')',sep='')
mysub <- paste('(base=',par8,', d=',par3,', D=',par4,', CI=', par7, ', CI type=',par6,')',sep='')
}
plot(x,type='l', main=mytitle,xlab='time',ylab='value')
par(op)
dev.off()
bitmap(file='pic1.png')
racf <- acf(x, par1, main='Autocorrelation', xlab='time lag', ylab='ACF', ci.type=par6, ci=par7, sub=mysub)
dev.off()
bitmap(file='pic2.png')
rpacf <- pacf(x,par1,main='Partial Autocorrelation',xlab='lags',ylab='PACF',sub=mysub)
dev.off()
(myacf <- c(racf$acf))
(mypacf <- c(rpacf$acf))
lengthx <- length(x)
sqrtn <- sqrt(lengthx)
load(file='createtable')
a<-table.start()
a<-table.row.start(a)
a<-table.element(a,'Autocorrelation Function',4,TRUE)
a<-table.row.end(a)
a<-table.row.start(a)
a<-table.element(a,'Time lag k',header=TRUE)
a<-table.element(a,hyperlink('basics.htm','ACF(k)','click here for more information about the Autocorrelation Function'),header=TRUE)
a<-table.element(a,'T-STAT',header=TRUE)
a<-table.element(a,'P-value',header=TRUE)
a<-table.row.end(a)
for (i in 2:(par1+1)) {
a<-table.row.start(a)
a<-table.element(a,i-1,header=TRUE)
a<-table.element(a,round(myacf[i],6))
mytstat <- myacf[i]*sqrtn
a<-table.element(a,round(mytstat,4))
a<-table.element(a,round(1-pt(abs(mytstat),lengthx),6))
a<-table.row.end(a)
}
a<-table.end(a)
table.save(a,file='mytable.tab')
a<-table.start()
a<-table.row.start(a)
a<-table.element(a,'Partial Autocorrelation Function',4,TRUE)
a<-table.row.end(a)
a<-table.row.start(a)
a<-table.element(a,'Time lag k',header=TRUE)
a<-table.element(a,hyperlink('basics.htm','PACF(k)','click here for more information about the Partial Autocorrelation Function'),header=TRUE)
a<-table.element(a,'T-STAT',header=TRUE)
a<-table.element(a,'P-value',header=TRUE)
a<-table.row.end(a)
for (i in 1:par1) {
a<-table.row.start(a)
a<-table.element(a,i,header=TRUE)
a<-table.element(a,round(mypacf[i],6))
mytstat <- mypacf[i]*sqrtn
a<-table.element(a,round(mytstat,4))
a<-table.element(a,round(1-pt(abs(mytstat),lengthx),6))
a<-table.row.end(a)
}
a<-table.end(a)
table.save(a,file='mytable1.tab')