Free Statistics

of Irreproducible Research!

Author's title

spreidings- en gemiddeldegrafieken aantal faillissementen per maand Nederla...

Author*Unverified author*
R Software Modulerwasp_smp.wasp
Title produced by softwareStandard Deviation-Mean Plot
Date of computationWed, 30 Nov 2011 14:02:56 -0500
Cite this page as followsStatistical Computations at FreeStatistics.org, Office for Research Development and Education, URL https://freestatistics.org/blog/index.php?v=date/2011/Nov/30/t1322679839ysv4zlr6qg6rh64.htm/, Retrieved Wed, 24 Apr 2024 20:33:48 +0000
Statistical Computations at FreeStatistics.org, Office for Research Development and Education, URL https://freestatistics.org/blog/index.php?pk=149129, Retrieved Wed, 24 Apr 2024 20:33:48 +0000
QR Codes:

Original text written by user:
IsPrivate?No (this computation is public)
User-defined keywordsKDGP2W83
Estimated Impact126
Family? (F = Feedback message, R = changed R code, M = changed R Module, P = changed Parameters, D = changed Data)
-       [Standard Deviation-Mean Plot] [spreidings- en ge...] [2011-11-30 19:02:56] [ce97780edec5de939908d2a0576fedc2] [Current]
Feedback Forum

Post a new message
Dataseries X:
797
840
988
819
831
904
814
798
828
789
930
744
832
826
907
776
835
715
729
733
736
712
711
667
799
661
692
649
729
622
671
635
648
745
624
477
710
515
461
590
415
554
585
513
591
561
684
668
795
776
1043
964
762
1030
939
779
918
839
874
840
794
820
1003
780
607
1001
743
810
716
775
883
633


Summary of computational transaction
Raw Inputview raw input (R code)
Raw Outputview raw output of R engine
Computing time1 seconds
R Server'Herman Ole Andreas Wold' @ wold.wessa.net

\begin{tabular}{lllllllll}
\hline
Summary of computational transaction \tabularnewline
Raw Input & view raw input (R code)  \tabularnewline
Raw Output & view raw output of R engine  \tabularnewline
Computing time & 1 seconds \tabularnewline
R Server & 'Herman Ole Andreas Wold' @ wold.wessa.net \tabularnewline
\hline
\end{tabular}
%Source: https://freestatistics.org/blog/index.php?pk=149129&T=0

[TABLE]
[ROW][C]Summary of computational transaction[/C][/ROW]
[ROW][C]Raw Input[/C][C]view raw input (R code) [/C][/ROW]
[ROW][C]Raw Output[/C][C]view raw output of R engine [/C][/ROW]
[ROW][C]Computing time[/C][C]1 seconds[/C][/ROW]
[ROW][C]R Server[/C][C]'Herman Ole Andreas Wold' @ wold.wessa.net[/C][/ROW]
[/TABLE]
Source: https://freestatistics.org/blog/index.php?pk=149129&T=0

Globally Unique Identifier (entire table): ba.freestatistics.org/blog/index.php?pk=149129&T=0

As an alternative you can also use a QR Code:  

The GUIDs for individual cells are displayed in the table below:

Summary of computational transaction
Raw Inputview raw input (R code)
Raw Outputview raw output of R engine
Computing time1 seconds
R Server'Herman Ole Andreas Wold' @ wold.wessa.net


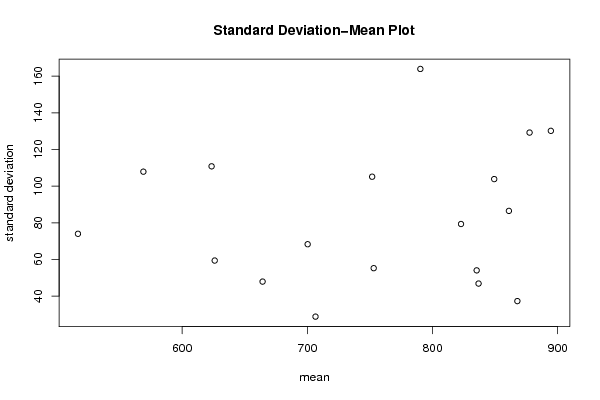
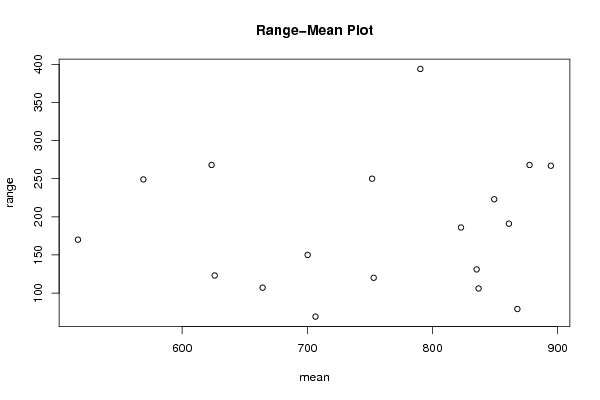
Standard Deviation-Mean Plot
SectionMeanStandard DeviationRange
186186.4677203739446191
2836.7546.8143496519319106
3822.7579.3110963232762186
4835.2554.0208293161073131
575355.208694967369120
6706.528.757607689096869
7700.2568.2806707641335150
8664.2547.8844094321593107
9623.5110.792599030802268
10569107.861021689951249
11516.7573.9656451784656170
1262659.3801313572141123
13894.5130.160157754463267
14877.5129.203973107125268
15867.7537.241330087238779
16849.25103.831193129361223
17790.25163.929608877306394
18751.75105.113827190654250

\begin{tabular}{lllllllll}
\hline
Standard Deviation-Mean Plot \tabularnewline
Section & Mean & Standard Deviation & Range \tabularnewline
1 & 861 & 86.4677203739446 & 191 \tabularnewline
2 & 836.75 & 46.8143496519319 & 106 \tabularnewline
3 & 822.75 & 79.3110963232762 & 186 \tabularnewline
4 & 835.25 & 54.0208293161073 & 131 \tabularnewline
5 & 753 & 55.208694967369 & 120 \tabularnewline
6 & 706.5 & 28.7576076890968 & 69 \tabularnewline
7 & 700.25 & 68.2806707641335 & 150 \tabularnewline
8 & 664.25 & 47.8844094321593 & 107 \tabularnewline
9 & 623.5 & 110.792599030802 & 268 \tabularnewline
10 & 569 & 107.861021689951 & 249 \tabularnewline
11 & 516.75 & 73.9656451784656 & 170 \tabularnewline
12 & 626 & 59.3801313572141 & 123 \tabularnewline
13 & 894.5 & 130.160157754463 & 267 \tabularnewline
14 & 877.5 & 129.203973107125 & 268 \tabularnewline
15 & 867.75 & 37.2413300872387 & 79 \tabularnewline
16 & 849.25 & 103.831193129361 & 223 \tabularnewline
17 & 790.25 & 163.929608877306 & 394 \tabularnewline
18 & 751.75 & 105.113827190654 & 250 \tabularnewline
\hline
\end{tabular}
%Source: https://freestatistics.org/blog/index.php?pk=149129&T=1

[TABLE]
[ROW][C]Standard Deviation-Mean Plot[/C][/ROW]
[ROW][C]Section[/C][C]Mean[/C][C]Standard Deviation[/C][C]Range[/C][/ROW]
[ROW][C]1[/C][C]861[/C][C]86.4677203739446[/C][C]191[/C][/ROW]
[ROW][C]2[/C][C]836.75[/C][C]46.8143496519319[/C][C]106[/C][/ROW]
[ROW][C]3[/C][C]822.75[/C][C]79.3110963232762[/C][C]186[/C][/ROW]
[ROW][C]4[/C][C]835.25[/C][C]54.0208293161073[/C][C]131[/C][/ROW]
[ROW][C]5[/C][C]753[/C][C]55.208694967369[/C][C]120[/C][/ROW]
[ROW][C]6[/C][C]706.5[/C][C]28.7576076890968[/C][C]69[/C][/ROW]
[ROW][C]7[/C][C]700.25[/C][C]68.2806707641335[/C][C]150[/C][/ROW]
[ROW][C]8[/C][C]664.25[/C][C]47.8844094321593[/C][C]107[/C][/ROW]
[ROW][C]9[/C][C]623.5[/C][C]110.792599030802[/C][C]268[/C][/ROW]
[ROW][C]10[/C][C]569[/C][C]107.861021689951[/C][C]249[/C][/ROW]
[ROW][C]11[/C][C]516.75[/C][C]73.9656451784656[/C][C]170[/C][/ROW]
[ROW][C]12[/C][C]626[/C][C]59.3801313572141[/C][C]123[/C][/ROW]
[ROW][C]13[/C][C]894.5[/C][C]130.160157754463[/C][C]267[/C][/ROW]
[ROW][C]14[/C][C]877.5[/C][C]129.203973107125[/C][C]268[/C][/ROW]
[ROW][C]15[/C][C]867.75[/C][C]37.2413300872387[/C][C]79[/C][/ROW]
[ROW][C]16[/C][C]849.25[/C][C]103.831193129361[/C][C]223[/C][/ROW]
[ROW][C]17[/C][C]790.25[/C][C]163.929608877306[/C][C]394[/C][/ROW]
[ROW][C]18[/C][C]751.75[/C][C]105.113827190654[/C][C]250[/C][/ROW]
[/TABLE]
Source: https://freestatistics.org/blog/index.php?pk=149129&T=1

Globally Unique Identifier (entire table): ba.freestatistics.org/blog/index.php?pk=149129&T=1

As an alternative you can also use a QR Code:  

The GUIDs for individual cells are displayed in the table below:

Standard Deviation-Mean Plot
SectionMeanStandard DeviationRange
186186.4677203739446191
2836.7546.8143496519319106
3822.7579.3110963232762186
4835.2554.0208293161073131
575355.208694967369120
6706.528.757607689096869
7700.2568.2806707641335150
8664.2547.8844094321593107
9623.5110.792599030802268
10569107.861021689951249
11516.7573.9656451784656170
1262659.3801313572141123
13894.5130.160157754463267
14877.5129.203973107125268
15867.7537.241330087238779
16849.25103.831193129361223
17790.25163.929608877306394
18751.75105.113827190654250


Regression: S.E.(k) = alpha + beta * Mean(k)
alpha48.4252128643026
beta0.0455168340737599
S.D.0.0796215171296792
T-STAT0.571664993517102
p-value0.575492705609564

\begin{tabular}{lllllllll}
\hline
Regression: S.E.(k) = alpha + beta * Mean(k) \tabularnewline
alpha & 48.4252128643026 \tabularnewline
beta & 0.0455168340737599 \tabularnewline
S.D. & 0.0796215171296792 \tabularnewline
T-STAT & 0.571664993517102 \tabularnewline
p-value & 0.575492705609564 \tabularnewline
\hline
\end{tabular}
%Source: https://freestatistics.org/blog/index.php?pk=149129&T=2

[TABLE]
[ROW][C]Regression: S.E.(k) = alpha + beta * Mean(k)[/C][/ROW]
[ROW][C]alpha[/C][C]48.4252128643026[/C][/ROW]
[ROW][C]beta[/C][C]0.0455168340737599[/C][/ROW]
[ROW][C]S.D.[/C][C]0.0796215171296792[/C][/ROW]
[ROW][C]T-STAT[/C][C]0.571664993517102[/C][/ROW]
[ROW][C]p-value[/C][C]0.575492705609564[/C][/ROW]
[/TABLE]
Source: https://freestatistics.org/blog/index.php?pk=149129&T=2

Globally Unique Identifier (entire table): ba.freestatistics.org/blog/index.php?pk=149129&T=2

As an alternative you can also use a QR Code:  

The GUIDs for individual cells are displayed in the table below:

Regression: S.E.(k) = alpha + beta * Mean(k)
alpha48.4252128643026
beta0.0455168340737599
S.D.0.0796215171296792
T-STAT0.571664993517102
p-value0.575492705609564


Regression: ln S.E.(k) = alpha + beta * ln Mean(k)
alpha2.96477254303632
beta0.204073165989377
S.D.0.72821112050937
T-STAT0.280239013442464
p-value0.782885068770373
Lambda0.795926834010623

\begin{tabular}{lllllllll}
\hline
Regression: ln S.E.(k) = alpha + beta * ln Mean(k) \tabularnewline
alpha & 2.96477254303632 \tabularnewline
beta & 0.204073165989377 \tabularnewline
S.D. & 0.72821112050937 \tabularnewline
T-STAT & 0.280239013442464 \tabularnewline
p-value & 0.782885068770373 \tabularnewline
Lambda & 0.795926834010623 \tabularnewline
\hline
\end{tabular}
%Source: https://freestatistics.org/blog/index.php?pk=149129&T=3

[TABLE]
[ROW][C]Regression: ln S.E.(k) = alpha + beta * ln Mean(k)[/C][/ROW]
[ROW][C]alpha[/C][C]2.96477254303632[/C][/ROW]
[ROW][C]beta[/C][C]0.204073165989377[/C][/ROW]
[ROW][C]S.D.[/C][C]0.72821112050937[/C][/ROW]
[ROW][C]T-STAT[/C][C]0.280239013442464[/C][/ROW]
[ROW][C]p-value[/C][C]0.782885068770373[/C][/ROW]
[ROW][C]Lambda[/C][C]0.795926834010623[/C][/ROW]
[/TABLE]
Source: https://freestatistics.org/blog/index.php?pk=149129&T=3

Globally Unique Identifier (entire table): ba.freestatistics.org/blog/index.php?pk=149129&T=3

As an alternative you can also use a QR Code:  

The GUIDs for individual cells are displayed in the table below:

Regression: ln S.E.(k) = alpha + beta * ln Mean(k)
alpha2.96477254303632
beta0.204073165989377
S.D.0.72821112050937
T-STAT0.280239013442464
p-value0.782885068770373
Lambda0.795926834010623


Parameters (Session):
par1 = 4 ;
Parameters (R input):
par1 = 4 ;
R code (references can be found in the software module):
par1 <- as.numeric(par1)
(n <- length(x))
(np <- floor(n / par1))
arr <- array(NA,dim=c(par1,np))
j <- 0
k <- 1
for (i in 1:(np*par1))
{
j = j + 1
arr[j,k] <- x[i]
if (j == par1) {
j = 0
k=k+1
}
}
arr
arr.mean <- array(NA,dim=np)
arr.sd <- array(NA,dim=np)
arr.range <- array(NA,dim=np)
for (j in 1:np)
{
arr.mean[j] <- mean(arr[,j],na.rm=TRUE)
arr.sd[j] <- sd(arr[,j],na.rm=TRUE)
arr.range[j] <- max(arr[,j],na.rm=TRUE) - min(arr[,j],na.rm=TRUE)
}
arr.mean
arr.sd
arr.range
(lm1 <- lm(arr.sd~arr.mean))
(lnlm1 <- lm(log(arr.sd)~log(arr.mean)))
(lm2 <- lm(arr.range~arr.mean))
bitmap(file='test1.png')
plot(arr.mean,arr.sd,main='Standard Deviation-Mean Plot',xlab='mean',ylab='standard deviation')
dev.off()
bitmap(file='test2.png')
plot(arr.mean,arr.range,main='Range-Mean Plot',xlab='mean',ylab='range')
dev.off()
load(file='createtable')
a<-table.start()
a<-table.row.start(a)
a<-table.element(a,'Standard Deviation-Mean Plot',4,TRUE)
a<-table.row.end(a)
a<-table.row.start(a)
a<-table.element(a,'Section',header=TRUE)
a<-table.element(a,'Mean',header=TRUE)
a<-table.element(a,'Standard Deviation',header=TRUE)
a<-table.element(a,'Range',header=TRUE)
a<-table.row.end(a)
for (j in 1:np) {
a<-table.row.start(a)
a<-table.element(a,j,header=TRUE)
a<-table.element(a,arr.mean[j])
a<-table.element(a,arr.sd[j] )
a<-table.element(a,arr.range[j] )
a<-table.row.end(a)
}
a<-table.end(a)
table.save(a,file='mytable.tab')
a<-table.start()
a<-table.row.start(a)
a<-table.element(a,'Regression: S.E.(k) = alpha + beta * Mean(k)',2,TRUE)
a<-table.row.end(a)
a<-table.row.start(a)
a<-table.element(a,'alpha',header=TRUE)
a<-table.element(a,lm1$coefficients[[1]])
a<-table.row.end(a)
a<-table.row.start(a)
a<-table.element(a,'beta',header=TRUE)
a<-table.element(a,lm1$coefficients[[2]])
a<-table.row.end(a)
a<-table.row.start(a)
a<-table.element(a,'S.D.',header=TRUE)
a<-table.element(a,summary(lm1)$coefficients[2,2])
a<-table.row.end(a)
a<-table.row.start(a)
a<-table.element(a,'T-STAT',header=TRUE)
a<-table.element(a,summary(lm1)$coefficients[2,3])
a<-table.row.end(a)
a<-table.row.start(a)
a<-table.element(a,'p-value',header=TRUE)
a<-table.element(a,summary(lm1)$coefficients[2,4])
a<-table.row.end(a)
a<-table.end(a)
table.save(a,file='mytable1.tab')
a<-table.start()
a<-table.row.start(a)
a<-table.element(a,'Regression: ln S.E.(k) = alpha + beta * ln Mean(k)',2,TRUE)
a<-table.row.end(a)
a<-table.row.start(a)
a<-table.element(a,'alpha',header=TRUE)
a<-table.element(a,lnlm1$coefficients[[1]])
a<-table.row.end(a)
a<-table.row.start(a)
a<-table.element(a,'beta',header=TRUE)
a<-table.element(a,lnlm1$coefficients[[2]])
a<-table.row.end(a)
a<-table.row.start(a)
a<-table.element(a,'S.D.',header=TRUE)
a<-table.element(a,summary(lnlm1)$coefficients[2,2])
a<-table.row.end(a)
a<-table.row.start(a)
a<-table.element(a,'T-STAT',header=TRUE)
a<-table.element(a,summary(lnlm1)$coefficients[2,3])
a<-table.row.end(a)
a<-table.row.start(a)
a<-table.element(a,'p-value',header=TRUE)
a<-table.element(a,summary(lnlm1)$coefficients[2,4])
a<-table.row.end(a)
a<-table.row.start(a)
a<-table.element(a,'Lambda',header=TRUE)
a<-table.element(a,1-lnlm1$coefficients[[2]])
a<-table.row.end(a)
a<-table.end(a)
table.save(a,file='mytable2.tab')