| Multiple Linear Regression - Estimated Regression Equation |
| Y1[t] = + 14.24777984831 + 0.757347311456523Y2[t] + 0.162331012991481Y3[t] -0.0605178371933684Y4[t] + 0.406078167562165M1[t] + 0.020950647807322M2[t] + 0.198187463583225M3[t] + 0.0855484377373725M4[t] + 0.238923020163983M5[t] + 1.2237348299567M6[t] + 0.319554519385565M7[t] + 0.018134861825965M8[t] + 0.148386559720362M9[t] -0.0214456339183264M10[t] + 0.210413993094089M11[t] + 0.0490649360196894t + e[t] |
| Multiple Linear Regression - Ordinary Least Squares | |||||
| Variable | Parameter | S.D. | T-STAT H0: parameter = 0 | 2-tail p-value | 1-tail p-value |
| (Intercept) | 14.24777984831 | 6.174673 | 2.3075 | 0.026424 | 0.013212 |
| Y2 | 0.757347311456523 | 0.158309 | 4.784 | 2.5e-05 | 1.2e-05 |
| Y3 | 0.162331012991481 | 0.202296 | 0.8024 | 0.427159 | 0.213579 |
| Y4 | -0.0605178371933684 | 0.154901 | -0.3907 | 0.698155 | 0.349077 |
| M1 | 0.406078167562165 | 0.166528 | 2.4385 | 0.019404 | 0.009702 |
| M2 | 0.020950647807322 | 0.157001 | 0.1334 | 0.89453 | 0.447265 |
| M3 | 0.198187463583225 | 0.174562 | 1.1353 | 0.263161 | 0.13158 |
| M4 | 0.0855484377373725 | 0.153416 | 0.5576 | 0.580287 | 0.290144 |
| M5 | 0.238923020163983 | 0.162506 | 1.4702 | 0.149518 | 0.074759 |
| M6 | 1.2237348299567 | 0.155792 | 7.8549 | 0 | 0 |
| M7 | 0.319554519385565 | 0.228585 | 1.398 | 0.170023 | 0.085012 |
| M8 | 0.018134861825965 | 0.270897 | 0.0669 | 0.946968 | 0.473484 |
| M9 | 0.148386559720362 | 0.168844 | 0.8788 | 0.384871 | 0.192436 |
| M10 | -0.0214456339183264 | 0.164159 | -0.1306 | 0.896732 | 0.448366 |
| M11 | 0.210413993094089 | 0.168737 | 1.247 | 0.219836 | 0.109918 |
| t | 0.0490649360196894 | 0.020315 | 2.4153 | 0.020511 | 0.010255 |
| Multiple Linear Regression - Regression Statistics | |
| Multiple R | 0.999350423129952 |
| R-squared | 0.998701268210013 |
| Adjusted R-squared | 0.998201755983095 |
| F-TEST (value) | 1999.35299756734 |
| F-TEST (DF numerator) | 15 |
| F-TEST (DF denominator) | 39 |
| p-value | 0 |
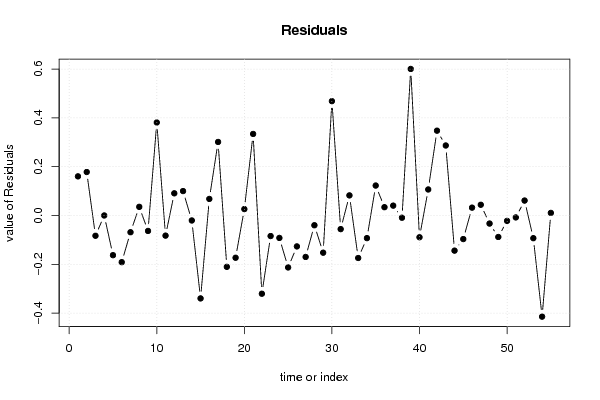
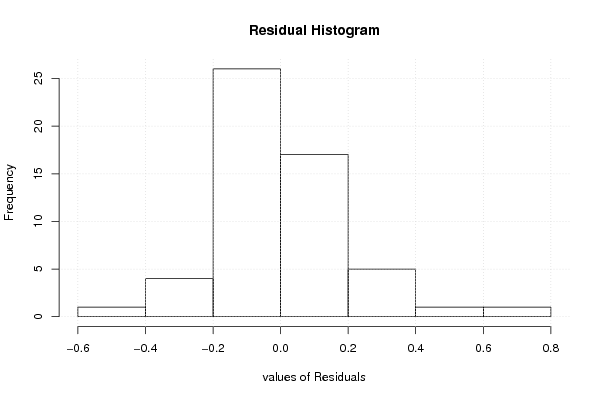
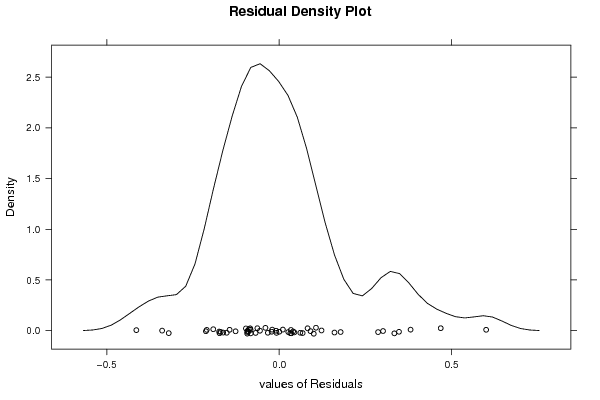
| Multiple Linear Regression - Residual Statistics | |
| Residual Standard Deviation | 0.228410216986259 |
| Sum Squared Residuals | 2.03467786172468 |
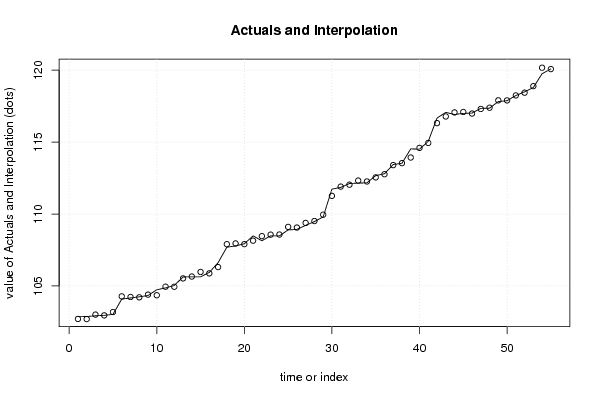
| Multiple Linear Regression - Actuals, Interpolation, and Residuals | |||
| Time or Index | Actuals | Interpolation Forecast | Residuals Prediction Error |
| 1 | 102.86 | 102.699671385951 | 0.160328614048532 |
| 2 | 102.87 | 102.691842941157 | 0.178157058842593 |
| 3 | 102.92 | 103.003031873932 | -0.0830318739315512 |
| 4 | 102.95 | 102.949899897955 | 0.000100102044690802 |
| 5 | 103.02 | 103.182571208023 | -0.162571208022951 |
| 6 | 104.08 | 104.271306304167 | -0.191306304167381 |
| 7 | 104.16 | 104.228526715553 | -0.0685267155534581 |
| 8 | 104.24 | 104.204594404098 | 0.035405595902495 |
| 9 | 104.33 | 104.393336396542 | -0.0633363965424561 |
| 10 | 104.73 | 104.348875451018 | 0.38112454898161 |
| 11 | 104.86 | 104.942507302827 | -0.0825073028268773 |
| 12 | 105.03 | 104.939099196091 | 0.090900803908989 |
| 13 | 105.62 | 105.519887239432 | 0.100112760567984 |
| 14 | 105.63 | 105.65038852283 | -0.0203885228296381 |
| 15 | 105.63 | 105.969751013082 | -0.339751013081891 |
| 16 | 105.94 | 105.872094709442 | 0.0679052905584495 |
| 17 | 106.61 | 106.308706716067 | 0.301293283932561 |
| 18 | 107.69 | 107.900328774583 | -0.210328774583075 |
| 19 | 107.78 | 107.953149745579 | -0.173149745579023 |
| 20 | 107.93 | 107.903726825181 | 0.0262731748185617 |
| 21 | 108.48 | 108.145896082814 | 0.334103917185593 |
| 22 | 108.14 | 108.460572893098 | -0.320572893097816 |
| 23 | 108.48 | 108.564203751801 | -0.0842037518010056 |
| 24 | 108.48 | 108.571875425748 | -0.0918754257483703 |
| 25 | 108.89 | 109.102787138393 | -0.212787138393077 |
| 26 | 108.93 | 109.056660887709 | -0.126660887709344 |
| 27 | 109.21 | 109.37981224729 | -0.169812247289722 |
| 28 | 109.47 | 109.509976331942 | -0.0399763319417501 |
| 29 | 109.8 | 109.952358121517 | -0.152358121516629 |
| 30 | 111.73 | 111.261420549073 | 0.46857945092668 |
| 31 | 111.85 | 111.90582008225 | -0.0558200822498957 |
| 32 | 112.12 | 112.037675006884 | 0.0823249931155014 |
| 33 | 112.15 | 112.324155710668 | -0.174155710667628 |
| 34 | 112.17 | 112.262676105437 | -0.0926761054368271 |
| 35 | 112.67 | 112.547277729046 | 0.122722270954406 |
| 36 | 112.8 | 112.766033412843 | 0.0339665871565115 |
| 37 | 113.44 | 113.399586816667 | 0.04041318333344 |
| 38 | 113.53 | 113.539070625356 | -0.00907062535578622 |
| 39 | 114.53 | 113.929558164662 | 0.600441835338121 |
| 40 | 114.51 | 114.599209761658 | -0.0892097616577136 |
| 41 | 115.05 | 114.943386741519 | 0.106613258481029 |
| 42 | 116.67 | 116.322466578065 | 0.34753342193531 |
| 43 | 117.07 | 116.783122951832 | 0.286877048167907 |
| 44 | 116.92 | 117.064003763837 | -0.144003763836558 |
| 45 | 117 | 117.096611809976 | -0.096611809975509 |
| 46 | 117.02 | 116.987875550447 | 0.0321244495530331 |
| 47 | 117.35 | 117.306011216327 | 0.0439887836734767 |
| 48 | 117.36 | 117.392991965317 | -0.03299196531713 |
| 49 | 117.82 | 117.908067419557 | -0.0880674195568793 |
| 50 | 117.88 | 117.902037022948 | -0.0220370229478243 |
| 51 | 118.24 | 118.247846701035 | -0.00784670103495664 |
| 52 | 118.5 | 118.438819299004 | 0.0611807009963234 |
| 53 | 118.8 | 118.892977212874 | -0.0929772128740098 |
| 54 | 119.76 | 120.174477794112 | -0.414477794111534 |
| 55 | 120.09 | 120.079380504786 | 0.0106194952144697 |
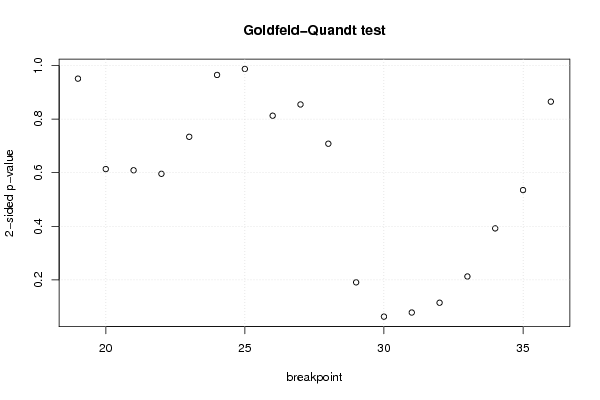
| Goldfeld-Quandt test for Heteroskedasticity | |||
| p-values | Alternative Hypothesis | ||
| breakpoint index | greater | 2-sided | less |
| 19 | 0.475405888342108 | 0.950811776684217 | 0.524594111657892 |
| 20 | 0.306829624036283 | 0.613659248072567 | 0.693170375963717 |
| 21 | 0.304606135715391 | 0.609212271430782 | 0.695393864284609 |
| 22 | 0.702000311522285 | 0.59599937695543 | 0.297999688477715 |
| 23 | 0.633023403227338 | 0.733953193545325 | 0.366976596772663 |
| 24 | 0.517716283864379 | 0.964567432271242 | 0.482283716135621 |
| 25 | 0.493490293887498 | 0.986980587774996 | 0.506509706112502 |
| 26 | 0.406301773605282 | 0.812603547210564 | 0.593698226394718 |
| 27 | 0.572727379139901 | 0.854545241720197 | 0.427272620860099 |
| 28 | 0.645913318614289 | 0.708173362771423 | 0.354086681385711 |
| 29 | 0.904395073885683 | 0.191209852228634 | 0.0956049261143168 |
| 30 | 0.968346810328757 | 0.0633063793424853 | 0.0316531896712426 |
| 31 | 0.96063555510027 | 0.078728889799459 | 0.0393644448997295 |
| 32 | 0.942410451436532 | 0.115179097126936 | 0.057589548563468 |
| 33 | 0.893444089408526 | 0.213111821182948 | 0.106555910591474 |
| 34 | 0.803777894176996 | 0.392444211646009 | 0.196222105823004 |
| 35 | 0.732308647731969 | 0.535382704536062 | 0.267691352268031 |
| 36 | 0.567518398049462 | 0.864963203901077 | 0.432481601950538 |
| Meta Analysis of Goldfeld-Quandt test for Heteroskedasticity | |||
| Description | # significant tests | % significant tests | OK/NOK |
| 1% type I error level | 0 | 0 | OK |
| 5% type I error level | 0 | 0 | OK |
| 10% type I error level | 2 | 0.111111111111111 | NOK |