Free Statistics

of Irreproducible Research!

Author's title

Author*Unverified author*
R Software Modulerwasp_smp.wasp
Title produced by softwareStandard Deviation-Mean Plot
Date of computationTue, 29 Nov 2011 14:28:20 -0500
Cite this page as followsStatistical Computations at FreeStatistics.org, Office for Research Development and Education, URL https://freestatistics.org/blog/index.php?v=date/2011/Nov/29/t1322594974olc98nussybsvgi.htm/, Retrieved Thu, 25 Apr 2024 21:10:32 +0000
Statistical Computations at FreeStatistics.org, Office for Research Development and Education, URL https://freestatistics.org/blog/index.php?pk=148695, Retrieved Thu, 25 Apr 2024 21:10:32 +0000
QR Codes:

Original text written by user:
IsPrivate?No (this computation is public)
User-defined keywordsKDGP2W83
Estimated Impact139
Family? (F = Feedback message, R = changed R code, M = changed R Module, P = changed Parameters, D = changed Data)
-       [Standard Deviation-Mean Plot] [Opgave 8 Oefening...] [2011-11-29 19:28:20] [b59b09b8e0844ceffdb892999921d72c] [Current]
- RMPD    [Classical Decomposition] [Multiplicatief de...] [2011-12-06 12:05:32] [74be16979710d4c4e7c6647856088456]
- RMP     [Classical Decomposition] [Oefening 2 opgave 9] [2011-12-06 12:16:42] [74be16979710d4c4e7c6647856088456]
Feedback Forum

Post a new message
Dataseries X:
14,5
15,1
17,4
16,2
15,6
17,2
14,9
13,8
17,5
16,2
17,5
16,6
16,2
16,6
19,6
15,9
18
18,3
16,3
14,9
18,2
18,4
18,5
16
17,4
17,2
19,6
17,2
18,3
19,3
18,1
16,2
18,4
20,5
19
16,5
18,7
19
19,2
20,5
19,3
20,6
20,1
16,1
20,4
19,7
15,6
14,4
13,7
14,1
15
14,2
13,6
15,4
14,8
12,5
16,2
16,1
16
15,8
14,9
15,4
18,6
17,1
16,8
19,5
17,3
15,8
19,3
18,8
18,5
17,3


Summary of computational transaction
Raw Inputview raw input (R code)
Raw Outputview raw output of R engine
Computing time1 seconds
R Server'George Udny Yule' @ yule.wessa.net

\begin{tabular}{lllllllll}
\hline
Summary of computational transaction \tabularnewline
Raw Input & view raw input (R code)  \tabularnewline
Raw Output & view raw output of R engine  \tabularnewline
Computing time & 1 seconds \tabularnewline
R Server & 'George Udny Yule' @ yule.wessa.net \tabularnewline
\hline
\end{tabular}
%Source: https://freestatistics.org/blog/index.php?pk=148695&T=0

[TABLE]
[ROW][C]Summary of computational transaction[/C][/ROW]
[ROW][C]Raw Input[/C][C]view raw input (R code) [/C][/ROW]
[ROW][C]Raw Output[/C][C]view raw output of R engine [/C][/ROW]
[ROW][C]Computing time[/C][C]1 seconds[/C][/ROW]
[ROW][C]R Server[/C][C]'George Udny Yule' @ yule.wessa.net[/C][/ROW]
[/TABLE]
Source: https://freestatistics.org/blog/index.php?pk=148695&T=0

Globally Unique Identifier (entire table): ba.freestatistics.org/blog/index.php?pk=148695&T=0

As an alternative you can also use a QR Code:  

The GUIDs for individual cells are displayed in the table below:

Summary of computational transaction
Raw Inputview raw input (R code)
Raw Outputview raw output of R engine
Computing time1 seconds
R Server'George Udny Yule' @ yule.wessa.net


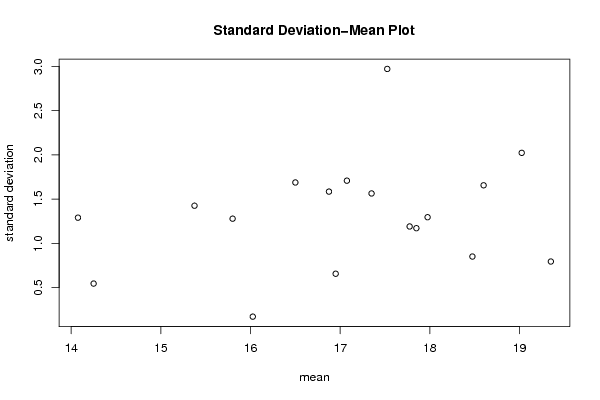
Standard Deviation-Mean Plot
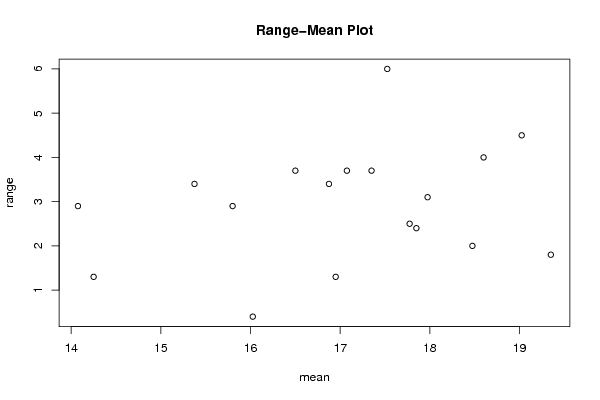
SectionMeanStandard DeviationRange
115.81.278019300845392.9
215.3751.424488212189443.4
316.950.65574385243021.3
417.0751.707581135212423.7
516.8751.584034932274753.4
617.7751.189887949906772.5
717.851.170469991071962.4
817.9751.294539815275433.1
918.61.655294535724684
1019.350.7937253933193771.8
1119.0252.022168802713234.5
1217.5252.970269348055836
1314.250.5446711546122731.3
1414.0751.289379695822762.9
1516.0250.1707825127659930.399999999999999
1616.51.687206764645843.7
1717.351.563116545025783.7
1818.4750.852

\begin{tabular}{lllllllll}
\hline
Standard Deviation-Mean Plot \tabularnewline
Section & Mean & Standard Deviation & Range \tabularnewline
1 & 15.8 & 1.27801930084539 & 2.9 \tabularnewline
2 & 15.375 & 1.42448821218944 & 3.4 \tabularnewline
3 & 16.95 & 0.6557438524302 & 1.3 \tabularnewline
4 & 17.075 & 1.70758113521242 & 3.7 \tabularnewline
5 & 16.875 & 1.58403493227475 & 3.4 \tabularnewline
6 & 17.775 & 1.18988794990677 & 2.5 \tabularnewline
7 & 17.85 & 1.17046999107196 & 2.4 \tabularnewline
8 & 17.975 & 1.29453981527543 & 3.1 \tabularnewline
9 & 18.6 & 1.65529453572468 & 4 \tabularnewline
10 & 19.35 & 0.793725393319377 & 1.8 \tabularnewline
11 & 19.025 & 2.02216880271323 & 4.5 \tabularnewline
12 & 17.525 & 2.97026934805583 & 6 \tabularnewline
13 & 14.25 & 0.544671154612273 & 1.3 \tabularnewline
14 & 14.075 & 1.28937969582276 & 2.9 \tabularnewline
15 & 16.025 & 0.170782512765993 & 0.399999999999999 \tabularnewline
16 & 16.5 & 1.68720676464584 & 3.7 \tabularnewline
17 & 17.35 & 1.56311654502578 & 3.7 \tabularnewline
18 & 18.475 & 0.85 & 2 \tabularnewline
\hline
\end{tabular}
%Source: https://freestatistics.org/blog/index.php?pk=148695&T=1

[TABLE]
[ROW][C]Standard Deviation-Mean Plot[/C][/ROW]
[ROW][C]Section[/C][C]Mean[/C][C]Standard Deviation[/C][C]Range[/C][/ROW]
[ROW][C]1[/C][C]15.8[/C][C]1.27801930084539[/C][C]2.9[/C][/ROW]
[ROW][C]2[/C][C]15.375[/C][C]1.42448821218944[/C][C]3.4[/C][/ROW]
[ROW][C]3[/C][C]16.95[/C][C]0.6557438524302[/C][C]1.3[/C][/ROW]
[ROW][C]4[/C][C]17.075[/C][C]1.70758113521242[/C][C]3.7[/C][/ROW]
[ROW][C]5[/C][C]16.875[/C][C]1.58403493227475[/C][C]3.4[/C][/ROW]
[ROW][C]6[/C][C]17.775[/C][C]1.18988794990677[/C][C]2.5[/C][/ROW]
[ROW][C]7[/C][C]17.85[/C][C]1.17046999107196[/C][C]2.4[/C][/ROW]
[ROW][C]8[/C][C]17.975[/C][C]1.29453981527543[/C][C]3.1[/C][/ROW]
[ROW][C]9[/C][C]18.6[/C][C]1.65529453572468[/C][C]4[/C][/ROW]
[ROW][C]10[/C][C]19.35[/C][C]0.793725393319377[/C][C]1.8[/C][/ROW]
[ROW][C]11[/C][C]19.025[/C][C]2.02216880271323[/C][C]4.5[/C][/ROW]
[ROW][C]12[/C][C]17.525[/C][C]2.97026934805583[/C][C]6[/C][/ROW]
[ROW][C]13[/C][C]14.25[/C][C]0.544671154612273[/C][C]1.3[/C][/ROW]
[ROW][C]14[/C][C]14.075[/C][C]1.28937969582276[/C][C]2.9[/C][/ROW]
[ROW][C]15[/C][C]16.025[/C][C]0.170782512765993[/C][C]0.399999999999999[/C][/ROW]
[ROW][C]16[/C][C]16.5[/C][C]1.68720676464584[/C][C]3.7[/C][/ROW]
[ROW][C]17[/C][C]17.35[/C][C]1.56311654502578[/C][C]3.7[/C][/ROW]
[ROW][C]18[/C][C]18.475[/C][C]0.85[/C][C]2[/C][/ROW]
[/TABLE]
Source: https://freestatistics.org/blog/index.php?pk=148695&T=1

Globally Unique Identifier (entire table): ba.freestatistics.org/blog/index.php?pk=148695&T=1

As an alternative you can also use a QR Code:  

The GUIDs for individual cells are displayed in the table below:

Standard Deviation-Mean Plot
SectionMeanStandard DeviationRange
115.81.278019300845392.9
215.3751.424488212189443.4
316.950.65574385243021.3
417.0751.707581135212423.7
516.8751.584034932274753.4
617.7751.189887949906772.5
717.851.170469991071962.4
817.9751.294539815275433.1
918.61.655294535724684
1019.350.7937253933193771.8
1119.0252.022168802713234.5
1217.5252.970269348055836
1314.250.5446711546122731.3
1414.0751.289379695822762.9
1516.0250.1707825127659930.399999999999999
1616.51.687206764645843.7
1717.351.563116545025783.7
1818.4750.852


Regression: S.E.(k) = alpha + beta * Mean(k)
alpha-0.357401294173403
beta0.0986951384618328
S.D.0.101103586402409
T-STAT0.976178412395874
p-value0.343505433865728

\begin{tabular}{lllllllll}
\hline
Regression: S.E.(k) = alpha + beta * Mean(k) \tabularnewline
alpha & -0.357401294173403 \tabularnewline
beta & 0.0986951384618328 \tabularnewline
S.D. & 0.101103586402409 \tabularnewline
T-STAT & 0.976178412395874 \tabularnewline
p-value & 0.343505433865728 \tabularnewline
\hline
\end{tabular}
%Source: https://freestatistics.org/blog/index.php?pk=148695&T=2

[TABLE]
[ROW][C]Regression: S.E.(k) = alpha + beta * Mean(k)[/C][/ROW]
[ROW][C]alpha[/C][C]-0.357401294173403[/C][/ROW]
[ROW][C]beta[/C][C]0.0986951384618328[/C][/ROW]
[ROW][C]S.D.[/C][C]0.101103586402409[/C][/ROW]
[ROW][C]T-STAT[/C][C]0.976178412395874[/C][/ROW]
[ROW][C]p-value[/C][C]0.343505433865728[/C][/ROW]
[/TABLE]
Source: https://freestatistics.org/blog/index.php?pk=148695&T=2

Globally Unique Identifier (entire table): ba.freestatistics.org/blog/index.php?pk=148695&T=2

As an alternative you can also use a QR Code:  

The GUIDs for individual cells are displayed in the table below:

Regression: S.E.(k) = alpha + beta * Mean(k)
alpha-0.357401294173403
beta0.0986951384618328
S.D.0.101103586402409
T-STAT0.976178412395874
p-value0.343505433865728


Regression: ln S.E.(k) = alpha + beta * ln Mean(k)
alpha-4.92961144813542
beta1.78988549620052
S.D.1.66787068462858
T-STAT1.07315603823273
p-value0.299120672154098
Lambda-0.78988549620052

\begin{tabular}{lllllllll}
\hline
Regression: ln S.E.(k) = alpha + beta * ln Mean(k) \tabularnewline
alpha & -4.92961144813542 \tabularnewline
beta & 1.78988549620052 \tabularnewline
S.D. & 1.66787068462858 \tabularnewline
T-STAT & 1.07315603823273 \tabularnewline
p-value & 0.299120672154098 \tabularnewline
Lambda & -0.78988549620052 \tabularnewline
\hline
\end{tabular}
%Source: https://freestatistics.org/blog/index.php?pk=148695&T=3

[TABLE]
[ROW][C]Regression: ln S.E.(k) = alpha + beta * ln Mean(k)[/C][/ROW]
[ROW][C]alpha[/C][C]-4.92961144813542[/C][/ROW]
[ROW][C]beta[/C][C]1.78988549620052[/C][/ROW]
[ROW][C]S.D.[/C][C]1.66787068462858[/C][/ROW]
[ROW][C]T-STAT[/C][C]1.07315603823273[/C][/ROW]
[ROW][C]p-value[/C][C]0.299120672154098[/C][/ROW]
[ROW][C]Lambda[/C][C]-0.78988549620052[/C][/ROW]
[/TABLE]
Source: https://freestatistics.org/blog/index.php?pk=148695&T=3

Globally Unique Identifier (entire table): ba.freestatistics.org/blog/index.php?pk=148695&T=3

As an alternative you can also use a QR Code:  

The GUIDs for individual cells are displayed in the table below:

Regression: ln S.E.(k) = alpha + beta * ln Mean(k)
alpha-4.92961144813542
beta1.78988549620052
S.D.1.66787068462858
T-STAT1.07315603823273
p-value0.299120672154098
Lambda-0.78988549620052


Parameters (Session):
par1 = 4 ;
Parameters (R input):
par1 = 4 ;
R code (references can be found in the software module):
par1 <- as.numeric(par1)
(n <- length(x))
(np <- floor(n / par1))
arr <- array(NA,dim=c(par1,np))
j <- 0
k <- 1
for (i in 1:(np*par1))
{
j = j + 1
arr[j,k] <- x[i]
if (j == par1) {
j = 0
k=k+1
}
}
arr
arr.mean <- array(NA,dim=np)
arr.sd <- array(NA,dim=np)
arr.range <- array(NA,dim=np)
for (j in 1:np)
{
arr.mean[j] <- mean(arr[,j],na.rm=TRUE)
arr.sd[j] <- sd(arr[,j],na.rm=TRUE)
arr.range[j] <- max(arr[,j],na.rm=TRUE) - min(arr[,j],na.rm=TRUE)
}
arr.mean
arr.sd
arr.range
(lm1 <- lm(arr.sd~arr.mean))
(lnlm1 <- lm(log(arr.sd)~log(arr.mean)))
(lm2 <- lm(arr.range~arr.mean))
bitmap(file='test1.png')
plot(arr.mean,arr.sd,main='Standard Deviation-Mean Plot',xlab='mean',ylab='standard deviation')
dev.off()
bitmap(file='test2.png')
plot(arr.mean,arr.range,main='Range-Mean Plot',xlab='mean',ylab='range')
dev.off()
load(file='createtable')
a<-table.start()
a<-table.row.start(a)
a<-table.element(a,'Standard Deviation-Mean Plot',4,TRUE)
a<-table.row.end(a)
a<-table.row.start(a)
a<-table.element(a,'Section',header=TRUE)
a<-table.element(a,'Mean',header=TRUE)
a<-table.element(a,'Standard Deviation',header=TRUE)
a<-table.element(a,'Range',header=TRUE)
a<-table.row.end(a)
for (j in 1:np) {
a<-table.row.start(a)
a<-table.element(a,j,header=TRUE)
a<-table.element(a,arr.mean[j])
a<-table.element(a,arr.sd[j] )
a<-table.element(a,arr.range[j] )
a<-table.row.end(a)
}
a<-table.end(a)
table.save(a,file='mytable.tab')
a<-table.start()
a<-table.row.start(a)
a<-table.element(a,'Regression: S.E.(k) = alpha + beta * Mean(k)',2,TRUE)
a<-table.row.end(a)
a<-table.row.start(a)
a<-table.element(a,'alpha',header=TRUE)
a<-table.element(a,lm1$coefficients[[1]])
a<-table.row.end(a)
a<-table.row.start(a)
a<-table.element(a,'beta',header=TRUE)
a<-table.element(a,lm1$coefficients[[2]])
a<-table.row.end(a)
a<-table.row.start(a)
a<-table.element(a,'S.D.',header=TRUE)
a<-table.element(a,summary(lm1)$coefficients[2,2])
a<-table.row.end(a)
a<-table.row.start(a)
a<-table.element(a,'T-STAT',header=TRUE)
a<-table.element(a,summary(lm1)$coefficients[2,3])
a<-table.row.end(a)
a<-table.row.start(a)
a<-table.element(a,'p-value',header=TRUE)
a<-table.element(a,summary(lm1)$coefficients[2,4])
a<-table.row.end(a)
a<-table.end(a)
table.save(a,file='mytable1.tab')
a<-table.start()
a<-table.row.start(a)
a<-table.element(a,'Regression: ln S.E.(k) = alpha + beta * ln Mean(k)',2,TRUE)
a<-table.row.end(a)
a<-table.row.start(a)
a<-table.element(a,'alpha',header=TRUE)
a<-table.element(a,lnlm1$coefficients[[1]])
a<-table.row.end(a)
a<-table.row.start(a)
a<-table.element(a,'beta',header=TRUE)
a<-table.element(a,lnlm1$coefficients[[2]])
a<-table.row.end(a)
a<-table.row.start(a)
a<-table.element(a,'S.D.',header=TRUE)
a<-table.element(a,summary(lnlm1)$coefficients[2,2])
a<-table.row.end(a)
a<-table.row.start(a)
a<-table.element(a,'T-STAT',header=TRUE)
a<-table.element(a,summary(lnlm1)$coefficients[2,3])
a<-table.row.end(a)
a<-table.row.start(a)
a<-table.element(a,'p-value',header=TRUE)
a<-table.element(a,summary(lnlm1)$coefficients[2,4])
a<-table.row.end(a)
a<-table.row.start(a)
a<-table.element(a,'Lambda',header=TRUE)
a<-table.element(a,1-lnlm1$coefficients[[2]])
a<-table.row.end(a)
a<-table.end(a)
table.save(a,file='mytable2.tab')