Free Statistics

of Irreproducible Research!

Author's title

Author*Unverified author*
R Software Modulerwasp_smp.wasp
Title produced by softwareStandard Deviation-Mean Plot
Date of computationTue, 29 Nov 2011 14:08:34 -0500
Cite this page as followsStatistical Computations at FreeStatistics.org, Office for Research Development and Education, URL https://freestatistics.org/blog/index.php?v=date/2011/Nov/29/t1322593906artqym8igxvs61g.htm/, Retrieved Thu, 18 Apr 2024 11:31:25 +0000
Statistical Computations at FreeStatistics.org, Office for Research Development and Education, URL https://freestatistics.org/blog/index.php?pk=148683, Retrieved Thu, 18 Apr 2024 11:31:25 +0000
QR Codes:

Original text written by user:
IsPrivate?No (this computation is public)
User-defined keywordsKDGP2W83
Estimated Impact74
Family? (F = Feedback message, R = changed R code, M = changed R Module, P = changed Parameters, D = changed Data)
-       [Standard Deviation-Mean Plot] [] [2011-11-29 19:08:34] [c7947c1eb3210bb9ed87c20003884d6d] [Current]
Feedback Forum

Post a new message
Dataseries X:
47460
50104
61465
53726
39477
43895
31481
29896
33842
39120
33702
25094
51442
45594
52518
48564
41745
49585
32747
33379
35645
37034
35681
20972
58552
54955
65540
51570
51145
46641
35704
33253
35193
41668
34865
21210
56126
49231
59723
48103
47472
50497
40059
34149
36860
46356
36577
23872
57276
56389
57657
62300
48929
51168
39636
33213
38127
43291
30600
21956
48033
46148
50736
48114
38390
44112
36287
30333
35908
40005
35263
26591
49709
47840
64781
57802
48154
54353
39737
37732
37163
43782
40649
29412


Summary of computational transaction
Raw Inputview raw input (R code)
Raw Outputview raw output of R engine
Computing time1 seconds
R Server'AstonUniversity' @ aston.wessa.net

\begin{tabular}{lllllllll}
\hline
Summary of computational transaction \tabularnewline
Raw Input & view raw input (R code)  \tabularnewline
Raw Output & view raw output of R engine  \tabularnewline
Computing time & 1 seconds \tabularnewline
R Server & 'AstonUniversity' @ aston.wessa.net \tabularnewline
\hline
\end{tabular}
%Source: https://freestatistics.org/blog/index.php?pk=148683&T=0

[TABLE]
[ROW][C]Summary of computational transaction[/C][/ROW]
[ROW][C]Raw Input[/C][C]view raw input (R code) [/C][/ROW]
[ROW][C]Raw Output[/C][C]view raw output of R engine [/C][/ROW]
[ROW][C]Computing time[/C][C]1 seconds[/C][/ROW]
[ROW][C]R Server[/C][C]'AstonUniversity' @ aston.wessa.net[/C][/ROW]
[/TABLE]
Source: https://freestatistics.org/blog/index.php?pk=148683&T=0

Globally Unique Identifier (entire table): ba.freestatistics.org/blog/index.php?pk=148683&T=0

As an alternative you can also use a QR Code:  

The GUIDs for individual cells are displayed in the table below:

Summary of computational transaction
Raw Inputview raw input (R code)
Raw Outputview raw output of R engine
Computing time1 seconds
R Server'AstonUniversity' @ aston.wessa.net


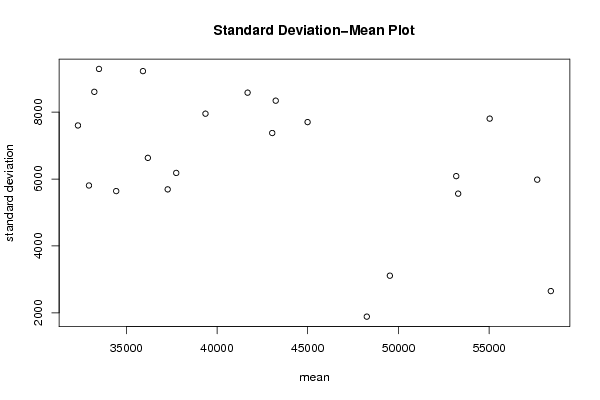
Standard Deviation-Mean Plot
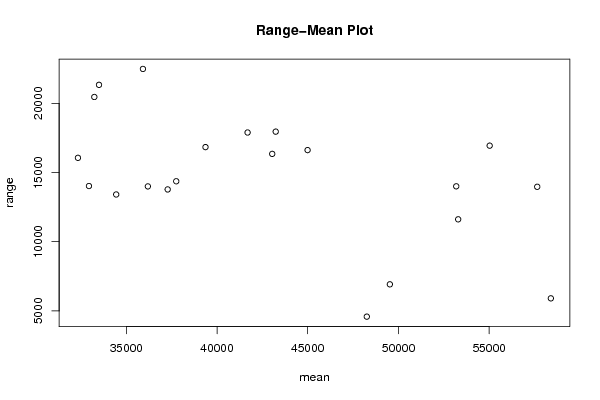
SectionMeanStandard DeviationRange
153188.756086.028008205914005
236187.256632.2565478626213999
332939.55806.501040500514026
449529.53109.616214261826924
5393647952.838403153116838
6323337601.5386600345616062
757654.255980.3861845759313970
841685.758581.4629434613317892
9332348606.3304995024820458
1053295.755561.9751512689611620
1143044.257375.3111290304216348
1235916.259226.404007882322484
1358405.52650.12106641695911
1443236.58341.61057590217955
1533493.59290.614924033121335
1648257.751885.377482097424588
1737280.55690.7873210420813779
1834441.755639.3961482295813414
19550337805.4487379009816941
20449947701.7135322818516621
2137751.56182.125551404914370

\begin{tabular}{lllllllll}
\hline
Standard Deviation-Mean Plot \tabularnewline
Section & Mean & Standard Deviation & Range \tabularnewline
1 & 53188.75 & 6086.0280082059 & 14005 \tabularnewline
2 & 36187.25 & 6632.25654786262 & 13999 \tabularnewline
3 & 32939.5 & 5806.5010405005 & 14026 \tabularnewline
4 & 49529.5 & 3109.61621426182 & 6924 \tabularnewline
5 & 39364 & 7952.8384031531 & 16838 \tabularnewline
6 & 32333 & 7601.53866003456 & 16062 \tabularnewline
7 & 57654.25 & 5980.38618457593 & 13970 \tabularnewline
8 & 41685.75 & 8581.46294346133 & 17892 \tabularnewline
9 & 33234 & 8606.33049950248 & 20458 \tabularnewline
10 & 53295.75 & 5561.97515126896 & 11620 \tabularnewline
11 & 43044.25 & 7375.31112903042 & 16348 \tabularnewline
12 & 35916.25 & 9226.4040078823 & 22484 \tabularnewline
13 & 58405.5 & 2650.1210664169 & 5911 \tabularnewline
14 & 43236.5 & 8341.610575902 & 17955 \tabularnewline
15 & 33493.5 & 9290.6149240331 & 21335 \tabularnewline
16 & 48257.75 & 1885.37748209742 & 4588 \tabularnewline
17 & 37280.5 & 5690.78732104208 & 13779 \tabularnewline
18 & 34441.75 & 5639.39614822958 & 13414 \tabularnewline
19 & 55033 & 7805.44873790098 & 16941 \tabularnewline
20 & 44994 & 7701.71353228185 & 16621 \tabularnewline
21 & 37751.5 & 6182.1255514049 & 14370 \tabularnewline
\hline
\end{tabular}
%Source: https://freestatistics.org/blog/index.php?pk=148683&T=1

[TABLE]
[ROW][C]Standard Deviation-Mean Plot[/C][/ROW]
[ROW][C]Section[/C][C]Mean[/C][C]Standard Deviation[/C][C]Range[/C][/ROW]
[ROW][C]1[/C][C]53188.75[/C][C]6086.0280082059[/C][C]14005[/C][/ROW]
[ROW][C]2[/C][C]36187.25[/C][C]6632.25654786262[/C][C]13999[/C][/ROW]
[ROW][C]3[/C][C]32939.5[/C][C]5806.5010405005[/C][C]14026[/C][/ROW]
[ROW][C]4[/C][C]49529.5[/C][C]3109.61621426182[/C][C]6924[/C][/ROW]
[ROW][C]5[/C][C]39364[/C][C]7952.8384031531[/C][C]16838[/C][/ROW]
[ROW][C]6[/C][C]32333[/C][C]7601.53866003456[/C][C]16062[/C][/ROW]
[ROW][C]7[/C][C]57654.25[/C][C]5980.38618457593[/C][C]13970[/C][/ROW]
[ROW][C]8[/C][C]41685.75[/C][C]8581.46294346133[/C][C]17892[/C][/ROW]
[ROW][C]9[/C][C]33234[/C][C]8606.33049950248[/C][C]20458[/C][/ROW]
[ROW][C]10[/C][C]53295.75[/C][C]5561.97515126896[/C][C]11620[/C][/ROW]
[ROW][C]11[/C][C]43044.25[/C][C]7375.31112903042[/C][C]16348[/C][/ROW]
[ROW][C]12[/C][C]35916.25[/C][C]9226.4040078823[/C][C]22484[/C][/ROW]
[ROW][C]13[/C][C]58405.5[/C][C]2650.1210664169[/C][C]5911[/C][/ROW]
[ROW][C]14[/C][C]43236.5[/C][C]8341.610575902[/C][C]17955[/C][/ROW]
[ROW][C]15[/C][C]33493.5[/C][C]9290.6149240331[/C][C]21335[/C][/ROW]
[ROW][C]16[/C][C]48257.75[/C][C]1885.37748209742[/C][C]4588[/C][/ROW]
[ROW][C]17[/C][C]37280.5[/C][C]5690.78732104208[/C][C]13779[/C][/ROW]
[ROW][C]18[/C][C]34441.75[/C][C]5639.39614822958[/C][C]13414[/C][/ROW]
[ROW][C]19[/C][C]55033[/C][C]7805.44873790098[/C][C]16941[/C][/ROW]
[ROW][C]20[/C][C]44994[/C][C]7701.71353228185[/C][C]16621[/C][/ROW]
[ROW][C]21[/C][C]37751.5[/C][C]6182.1255514049[/C][C]14370[/C][/ROW]
[/TABLE]
Source: https://freestatistics.org/blog/index.php?pk=148683&T=1

Globally Unique Identifier (entire table): ba.freestatistics.org/blog/index.php?pk=148683&T=1

As an alternative you can also use a QR Code:  

The GUIDs for individual cells are displayed in the table below:

Standard Deviation-Mean Plot
SectionMeanStandard DeviationRange
153188.756086.028008205914005
236187.256632.2565478626213999
332939.55806.501040500514026
449529.53109.616214261826924
5393647952.838403153116838
6323337601.5386600345616062
757654.255980.3861845759313970
841685.758581.4629434613317892
9332348606.3304995024820458
1053295.755561.9751512689611620
1143044.257375.3111290304216348
1235916.259226.404007882322484
1358405.52650.12106641695911
1443236.58341.61057590217955
1533493.59290.614924033121335
1648257.751885.377482097424588
1737280.55690.7873210420813779
1834441.755639.3961482295813414
19550337805.4487379009816941
20449947701.7135322818516621
2137751.56182.125551404914370


Regression: S.E.(k) = alpha + beta * Mean(k)
alpha11476.1489992865
beta-0.114606848815172
S.D.0.0474929283990696
T-STAT-2.41313502195871
p-value0.0260820143950944

\begin{tabular}{lllllllll}
\hline
Regression: S.E.(k) = alpha + beta * Mean(k) \tabularnewline
alpha & 11476.1489992865 \tabularnewline
beta & -0.114606848815172 \tabularnewline
S.D. & 0.0474929283990696 \tabularnewline
T-STAT & -2.41313502195871 \tabularnewline
p-value & 0.0260820143950944 \tabularnewline
\hline
\end{tabular}
%Source: https://freestatistics.org/blog/index.php?pk=148683&T=2

[TABLE]
[ROW][C]Regression: S.E.(k) = alpha + beta * Mean(k)[/C][/ROW]
[ROW][C]alpha[/C][C]11476.1489992865[/C][/ROW]
[ROW][C]beta[/C][C]-0.114606848815172[/C][/ROW]
[ROW][C]S.D.[/C][C]0.0474929283990696[/C][/ROW]
[ROW][C]T-STAT[/C][C]-2.41313502195871[/C][/ROW]
[ROW][C]p-value[/C][C]0.0260820143950944[/C][/ROW]
[/TABLE]
Source: https://freestatistics.org/blog/index.php?pk=148683&T=2

Globally Unique Identifier (entire table): ba.freestatistics.org/blog/index.php?pk=148683&T=2

As an alternative you can also use a QR Code:  

The GUIDs for individual cells are displayed in the table below:

Regression: S.E.(k) = alpha + beta * Mean(k)
alpha11476.1489992865
beta-0.114606848815172
S.D.0.0474929283990696
T-STAT-2.41313502195871
p-value0.0260820143950944


Regression: ln S.E.(k) = alpha + beta * ln Mean(k)
alpha19.1147213747818
beta-0.976191857742987
S.D.0.426173515233185
T-STAT-2.29059719304438
p-value0.0335932255319695
Lambda1.97619185774299

\begin{tabular}{lllllllll}
\hline
Regression: ln S.E.(k) = alpha + beta * ln Mean(k) \tabularnewline
alpha & 19.1147213747818 \tabularnewline
beta & -0.976191857742987 \tabularnewline
S.D. & 0.426173515233185 \tabularnewline
T-STAT & -2.29059719304438 \tabularnewline
p-value & 0.0335932255319695 \tabularnewline
Lambda & 1.97619185774299 \tabularnewline
\hline
\end{tabular}
%Source: https://freestatistics.org/blog/index.php?pk=148683&T=3

[TABLE]
[ROW][C]Regression: ln S.E.(k) = alpha + beta * ln Mean(k)[/C][/ROW]
[ROW][C]alpha[/C][C]19.1147213747818[/C][/ROW]
[ROW][C]beta[/C][C]-0.976191857742987[/C][/ROW]
[ROW][C]S.D.[/C][C]0.426173515233185[/C][/ROW]
[ROW][C]T-STAT[/C][C]-2.29059719304438[/C][/ROW]
[ROW][C]p-value[/C][C]0.0335932255319695[/C][/ROW]
[ROW][C]Lambda[/C][C]1.97619185774299[/C][/ROW]
[/TABLE]
Source: https://freestatistics.org/blog/index.php?pk=148683&T=3

Globally Unique Identifier (entire table): ba.freestatistics.org/blog/index.php?pk=148683&T=3

As an alternative you can also use a QR Code:  

The GUIDs for individual cells are displayed in the table below:

Regression: ln S.E.(k) = alpha + beta * ln Mean(k)
alpha19.1147213747818
beta-0.976191857742987
S.D.0.426173515233185
T-STAT-2.29059719304438
p-value0.0335932255319695
Lambda1.97619185774299


Parameters (Session):
par1 = 4 ;
Parameters (R input):
par1 = 4 ;
R code (references can be found in the software module):
par1 <- as.numeric(par1)
(n <- length(x))
(np <- floor(n / par1))
arr <- array(NA,dim=c(par1,np))
j <- 0
k <- 1
for (i in 1:(np*par1))
{
j = j + 1
arr[j,k] <- x[i]
if (j == par1) {
j = 0
k=k+1
}
}
arr
arr.mean <- array(NA,dim=np)
arr.sd <- array(NA,dim=np)
arr.range <- array(NA,dim=np)
for (j in 1:np)
{
arr.mean[j] <- mean(arr[,j],na.rm=TRUE)
arr.sd[j] <- sd(arr[,j],na.rm=TRUE)
arr.range[j] <- max(arr[,j],na.rm=TRUE) - min(arr[,j],na.rm=TRUE)
}
arr.mean
arr.sd
arr.range
(lm1 <- lm(arr.sd~arr.mean))
(lnlm1 <- lm(log(arr.sd)~log(arr.mean)))
(lm2 <- lm(arr.range~arr.mean))
bitmap(file='test1.png')
plot(arr.mean,arr.sd,main='Standard Deviation-Mean Plot',xlab='mean',ylab='standard deviation')
dev.off()
bitmap(file='test2.png')
plot(arr.mean,arr.range,main='Range-Mean Plot',xlab='mean',ylab='range')
dev.off()
load(file='createtable')
a<-table.start()
a<-table.row.start(a)
a<-table.element(a,'Standard Deviation-Mean Plot',4,TRUE)
a<-table.row.end(a)
a<-table.row.start(a)
a<-table.element(a,'Section',header=TRUE)
a<-table.element(a,'Mean',header=TRUE)
a<-table.element(a,'Standard Deviation',header=TRUE)
a<-table.element(a,'Range',header=TRUE)
a<-table.row.end(a)
for (j in 1:np) {
a<-table.row.start(a)
a<-table.element(a,j,header=TRUE)
a<-table.element(a,arr.mean[j])
a<-table.element(a,arr.sd[j] )
a<-table.element(a,arr.range[j] )
a<-table.row.end(a)
}
a<-table.end(a)
table.save(a,file='mytable.tab')
a<-table.start()
a<-table.row.start(a)
a<-table.element(a,'Regression: S.E.(k) = alpha + beta * Mean(k)',2,TRUE)
a<-table.row.end(a)
a<-table.row.start(a)
a<-table.element(a,'alpha',header=TRUE)
a<-table.element(a,lm1$coefficients[[1]])
a<-table.row.end(a)
a<-table.row.start(a)
a<-table.element(a,'beta',header=TRUE)
a<-table.element(a,lm1$coefficients[[2]])
a<-table.row.end(a)
a<-table.row.start(a)
a<-table.element(a,'S.D.',header=TRUE)
a<-table.element(a,summary(lm1)$coefficients[2,2])
a<-table.row.end(a)
a<-table.row.start(a)
a<-table.element(a,'T-STAT',header=TRUE)
a<-table.element(a,summary(lm1)$coefficients[2,3])
a<-table.row.end(a)
a<-table.row.start(a)
a<-table.element(a,'p-value',header=TRUE)
a<-table.element(a,summary(lm1)$coefficients[2,4])
a<-table.row.end(a)
a<-table.end(a)
table.save(a,file='mytable1.tab')
a<-table.start()
a<-table.row.start(a)
a<-table.element(a,'Regression: ln S.E.(k) = alpha + beta * ln Mean(k)',2,TRUE)
a<-table.row.end(a)
a<-table.row.start(a)
a<-table.element(a,'alpha',header=TRUE)
a<-table.element(a,lnlm1$coefficients[[1]])
a<-table.row.end(a)
a<-table.row.start(a)
a<-table.element(a,'beta',header=TRUE)
a<-table.element(a,lnlm1$coefficients[[2]])
a<-table.row.end(a)
a<-table.row.start(a)
a<-table.element(a,'S.D.',header=TRUE)
a<-table.element(a,summary(lnlm1)$coefficients[2,2])
a<-table.row.end(a)
a<-table.row.start(a)
a<-table.element(a,'T-STAT',header=TRUE)
a<-table.element(a,summary(lnlm1)$coefficients[2,3])
a<-table.row.end(a)
a<-table.row.start(a)
a<-table.element(a,'p-value',header=TRUE)
a<-table.element(a,summary(lnlm1)$coefficients[2,4])
a<-table.row.end(a)
a<-table.row.start(a)
a<-table.element(a,'Lambda',header=TRUE)
a<-table.element(a,1-lnlm1$coefficients[[2]])
a<-table.row.end(a)
a<-table.end(a)
table.save(a,file='mytable2.tab')