Free Statistics

of Irreproducible Research!

Author's title

Author*The author of this computation has been verified*
R Software Modulerwasp_autocorrelation.wasp
Title produced by software(Partial) Autocorrelation Function
Date of computationTue, 29 Nov 2011 14:07:12 -0500
Cite this page as followsStatistical Computations at FreeStatistics.org, Office for Research Development and Education, URL https://freestatistics.org/blog/index.php?v=date/2011/Nov/29/t13225937242ij5nvqq1qzxiqv.htm/, Retrieved Fri, 19 Apr 2024 10:44:55 +0000
Statistical Computations at FreeStatistics.org, Office for Research Development and Education, URL https://freestatistics.org/blog/index.php?pk=148680, Retrieved Fri, 19 Apr 2024 10:44:55 +0000
QR Codes:

Original text written by user:
IsPrivate?No (this computation is public)
User-defined keywords
Estimated Impact97
Family? (F = Feedback message, R = changed R code, M = changed R Module, P = changed Parameters, D = changed Data)
-     [Classical Decomposition] [HPC Retail Sales] [2008-03-02 16:19:32] [74be16979710d4c4e7c6647856088456]
-  M D  [Classical Decomposition] [Workshop 8, Class...] [2010-11-28 20:55:54] [d946de7cca328fbcf207448a112523ab]
- RMPD      [(Partial) Autocorrelation Function] [ws8 autocorrelati...] [2011-11-29 19:07:12] [635499bc27d9f41bf7bccae25a54e146] [Current]
Feedback Forum

Post a new message
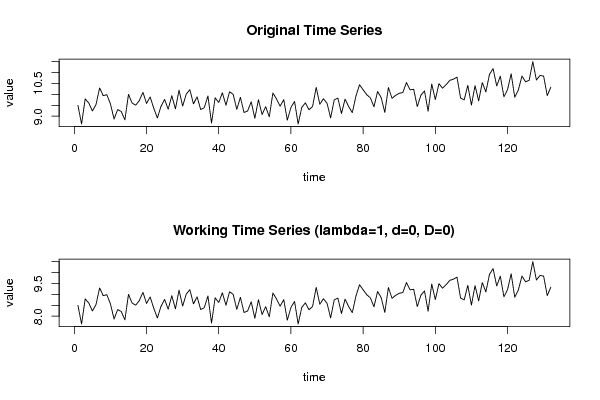
Dataseries X:
9.492
8.641
9.793
9.603
9.238
9.535
10.295
9.941
9.984
9.563
8.872
9.302
9.215
8.834
9.998
9.604
9.507
9.718
10.095
9.583
9.883
9.365
8.919
9.449
9.769
9.321
9.939
9.336
10.195
9.464
10.010
10.213
9.563
9.890
9.305
9.391
9.928
8.686
9.843
9.627
10.074
9.503
10.119
10.000
9.313
9.866
9.172
9.241
9.659
8.904
9.755
9.080
9.435
8.971
10.063
9.793
9.454
9.759
8.820
9.403
9.676
8.642
9.402
9.610
9.294
9.448
10.319
9.548
9.801
9.596
8.923
9.746
9.829
9.125
9.782
9.441
9.162
9.915
10.444
10.209
9.985
9.842
9.429
10.132
9.849
9.172
10.313
9.819
9.955
10.048
10.082
10.541
10.208
10.233
9.439
9.963
10.158
9.225
10.474
9.757
10.490
10.281
10.444
10.640
10.695
10.786
9.832
9.747
10.411
9.511
10.402
9.701
10.540
10.112
10.915
11.183
10.384
10.834
9.886
10.216
10.943
9.867
10.203
10.837
10.573
10.647
11.502
10.656
10.866
10.835
9.945
10.331


Summary of computational transaction
Raw Inputview raw input (R code)
Raw Outputview raw output of R engine
Computing time2 seconds
R Server'AstonUniversity' @ aston.wessa.net

\begin{tabular}{lllllllll}
\hline
Summary of computational transaction \tabularnewline
Raw Input & view raw input (R code)  \tabularnewline
Raw Output & view raw output of R engine  \tabularnewline
Computing time & 2 seconds \tabularnewline
R Server & 'AstonUniversity' @ aston.wessa.net \tabularnewline
\hline
\end{tabular}
%Source: https://freestatistics.org/blog/index.php?pk=148680&T=0

[TABLE]
[ROW][C]Summary of computational transaction[/C][/ROW]
[ROW][C]Raw Input[/C][C]view raw input (R code) [/C][/ROW]
[ROW][C]Raw Output[/C][C]view raw output of R engine [/C][/ROW]
[ROW][C]Computing time[/C][C]2 seconds[/C][/ROW]
[ROW][C]R Server[/C][C]'AstonUniversity' @ aston.wessa.net[/C][/ROW]
[/TABLE]
Source: https://freestatistics.org/blog/index.php?pk=148680&T=0

Globally Unique Identifier (entire table): ba.freestatistics.org/blog/index.php?pk=148680&T=0

As an alternative you can also use a QR Code:  

The GUIDs for individual cells are displayed in the table below:

Summary of computational transaction
Raw Inputview raw input (R code)
Raw Outputview raw output of R engine
Computing time2 seconds
R Server'AstonUniversity' @ aston.wessa.net


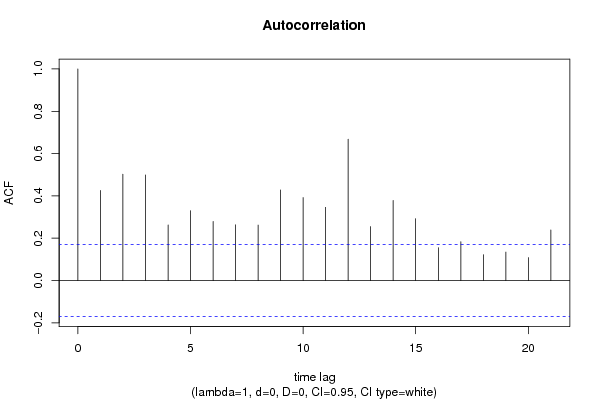
Autocorrelation Function
Time lag kACF(k)T-STATP-value
10.4260714.89521e-06
20.5023975.77210
30.498965.73260
40.2630793.02250.001506
50.3304453.79650.000111
60.2789383.20470.000848
70.2631773.02370.001501
80.2621963.01240.001554
90.4282224.91991e-06
100.3921434.50547e-06
110.345933.97445.8e-05
120.6680047.67480
130.2550932.93080.001993
140.3782314.34551.4e-05
150.2923323.35860.000512
160.1553731.78510.038271
170.1835012.10830.018449
180.1221631.40350.081401
190.1345021.54530.062332
200.108591.24760.107193
210.2388522.74420.003455

\begin{tabular}{lllllllll}
\hline
Autocorrelation Function \tabularnewline
Time lag k & ACF(k) & T-STAT & P-value \tabularnewline
1 & 0.426071 & 4.8952 & 1e-06 \tabularnewline
2 & 0.502397 & 5.7721 & 0 \tabularnewline
3 & 0.49896 & 5.7326 & 0 \tabularnewline
4 & 0.263079 & 3.0225 & 0.001506 \tabularnewline
5 & 0.330445 & 3.7965 & 0.000111 \tabularnewline
6 & 0.278938 & 3.2047 & 0.000848 \tabularnewline
7 & 0.263177 & 3.0237 & 0.001501 \tabularnewline
8 & 0.262196 & 3.0124 & 0.001554 \tabularnewline
9 & 0.428222 & 4.9199 & 1e-06 \tabularnewline
10 & 0.392143 & 4.5054 & 7e-06 \tabularnewline
11 & 0.34593 & 3.9744 & 5.8e-05 \tabularnewline
12 & 0.668004 & 7.6748 & 0 \tabularnewline
13 & 0.255093 & 2.9308 & 0.001993 \tabularnewline
14 & 0.378231 & 4.3455 & 1.4e-05 \tabularnewline
15 & 0.292332 & 3.3586 & 0.000512 \tabularnewline
16 & 0.155373 & 1.7851 & 0.038271 \tabularnewline
17 & 0.183501 & 2.1083 & 0.018449 \tabularnewline
18 & 0.122163 & 1.4035 & 0.081401 \tabularnewline
19 & 0.134502 & 1.5453 & 0.062332 \tabularnewline
20 & 0.10859 & 1.2476 & 0.107193 \tabularnewline
21 & 0.238852 & 2.7442 & 0.003455 \tabularnewline
\hline
\end{tabular}
%Source: https://freestatistics.org/blog/index.php?pk=148680&T=1

[TABLE]
[ROW][C]Autocorrelation Function[/C][/ROW]
[ROW][C]Time lag k[/C][C]ACF(k)[/C][C]T-STAT[/C][C]P-value[/C][/ROW]
[ROW][C]1[/C][C]0.426071[/C][C]4.8952[/C][C]1e-06[/C][/ROW]
[ROW][C]2[/C][C]0.502397[/C][C]5.7721[/C][C]0[/C][/ROW]
[ROW][C]3[/C][C]0.49896[/C][C]5.7326[/C][C]0[/C][/ROW]
[ROW][C]4[/C][C]0.263079[/C][C]3.0225[/C][C]0.001506[/C][/ROW]
[ROW][C]5[/C][C]0.330445[/C][C]3.7965[/C][C]0.000111[/C][/ROW]
[ROW][C]6[/C][C]0.278938[/C][C]3.2047[/C][C]0.000848[/C][/ROW]
[ROW][C]7[/C][C]0.263177[/C][C]3.0237[/C][C]0.001501[/C][/ROW]
[ROW][C]8[/C][C]0.262196[/C][C]3.0124[/C][C]0.001554[/C][/ROW]
[ROW][C]9[/C][C]0.428222[/C][C]4.9199[/C][C]1e-06[/C][/ROW]
[ROW][C]10[/C][C]0.392143[/C][C]4.5054[/C][C]7e-06[/C][/ROW]
[ROW][C]11[/C][C]0.34593[/C][C]3.9744[/C][C]5.8e-05[/C][/ROW]
[ROW][C]12[/C][C]0.668004[/C][C]7.6748[/C][C]0[/C][/ROW]
[ROW][C]13[/C][C]0.255093[/C][C]2.9308[/C][C]0.001993[/C][/ROW]
[ROW][C]14[/C][C]0.378231[/C][C]4.3455[/C][C]1.4e-05[/C][/ROW]
[ROW][C]15[/C][C]0.292332[/C][C]3.3586[/C][C]0.000512[/C][/ROW]
[ROW][C]16[/C][C]0.155373[/C][C]1.7851[/C][C]0.038271[/C][/ROW]
[ROW][C]17[/C][C]0.183501[/C][C]2.1083[/C][C]0.018449[/C][/ROW]
[ROW][C]18[/C][C]0.122163[/C][C]1.4035[/C][C]0.081401[/C][/ROW]
[ROW][C]19[/C][C]0.134502[/C][C]1.5453[/C][C]0.062332[/C][/ROW]
[ROW][C]20[/C][C]0.10859[/C][C]1.2476[/C][C]0.107193[/C][/ROW]
[ROW][C]21[/C][C]0.238852[/C][C]2.7442[/C][C]0.003455[/C][/ROW]
[/TABLE]
Source: https://freestatistics.org/blog/index.php?pk=148680&T=1

Globally Unique Identifier (entire table): ba.freestatistics.org/blog/index.php?pk=148680&T=1

As an alternative you can also use a QR Code:  

The GUIDs for individual cells are displayed in the table below:

Autocorrelation Function
Time lag kACF(k)T-STATP-value
10.4260714.89521e-06
20.5023975.77210
30.498965.73260
40.2630793.02250.001506
50.3304453.79650.000111
60.2789383.20470.000848
70.2631773.02370.001501
80.2621963.01240.001554
90.4282224.91991e-06
100.3921434.50547e-06
110.345933.97445.8e-05
120.6680047.67480
130.2550932.93080.001993
140.3782314.34551.4e-05
150.2923323.35860.000512
160.1553731.78510.038271
170.1835012.10830.018449
180.1221631.40350.081401
190.1345021.54530.062332
200.108591.24760.107193
210.2388522.74420.003455


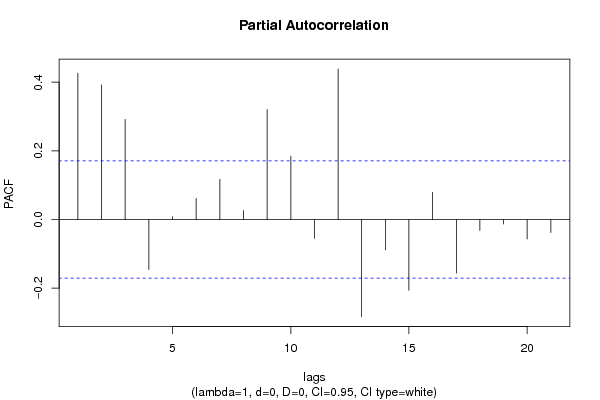
Partial Autocorrelation Function
Time lag kPACF(k)T-STATP-value
10.4260714.89521e-06
20.3920284.50417e-06
30.2913163.3470.000532
4-0.145689-1.67380.048265
50.0085860.09860.460785
60.0611610.70270.241744
70.1169851.34410.090618
80.0263110.30230.381454
90.3204453.68160.000168
100.1840662.11480.018165
11-0.054994-0.63180.264296
120.4386815.04011e-06
13-0.282981-3.25120.000729
14-0.088189-1.01320.156407
15-0.205961-2.36630.00971
160.0796730.91540.180832
17-0.155973-1.7920.037712
18-0.031635-0.36350.358422
19-0.012991-0.14930.440789
20-0.056763-0.65220.257716
21-0.037947-0.4360.331782

\begin{tabular}{lllllllll}
\hline
Partial Autocorrelation Function \tabularnewline
Time lag k & PACF(k) & T-STAT & P-value \tabularnewline
1 & 0.426071 & 4.8952 & 1e-06 \tabularnewline
2 & 0.392028 & 4.5041 & 7e-06 \tabularnewline
3 & 0.291316 & 3.347 & 0.000532 \tabularnewline
4 & -0.145689 & -1.6738 & 0.048265 \tabularnewline
5 & 0.008586 & 0.0986 & 0.460785 \tabularnewline
6 & 0.061161 & 0.7027 & 0.241744 \tabularnewline
7 & 0.116985 & 1.3441 & 0.090618 \tabularnewline
8 & 0.026311 & 0.3023 & 0.381454 \tabularnewline
9 & 0.320445 & 3.6816 & 0.000168 \tabularnewline
10 & 0.184066 & 2.1148 & 0.018165 \tabularnewline
11 & -0.054994 & -0.6318 & 0.264296 \tabularnewline
12 & 0.438681 & 5.0401 & 1e-06 \tabularnewline
13 & -0.282981 & -3.2512 & 0.000729 \tabularnewline
14 & -0.088189 & -1.0132 & 0.156407 \tabularnewline
15 & -0.205961 & -2.3663 & 0.00971 \tabularnewline
16 & 0.079673 & 0.9154 & 0.180832 \tabularnewline
17 & -0.155973 & -1.792 & 0.037712 \tabularnewline
18 & -0.031635 & -0.3635 & 0.358422 \tabularnewline
19 & -0.012991 & -0.1493 & 0.440789 \tabularnewline
20 & -0.056763 & -0.6522 & 0.257716 \tabularnewline
21 & -0.037947 & -0.436 & 0.331782 \tabularnewline
\hline
\end{tabular}
%Source: https://freestatistics.org/blog/index.php?pk=148680&T=2

[TABLE]
[ROW][C]Partial Autocorrelation Function[/C][/ROW]
[ROW][C]Time lag k[/C][C]PACF(k)[/C][C]T-STAT[/C][C]P-value[/C][/ROW]
[ROW][C]1[/C][C]0.426071[/C][C]4.8952[/C][C]1e-06[/C][/ROW]
[ROW][C]2[/C][C]0.392028[/C][C]4.5041[/C][C]7e-06[/C][/ROW]
[ROW][C]3[/C][C]0.291316[/C][C]3.347[/C][C]0.000532[/C][/ROW]
[ROW][C]4[/C][C]-0.145689[/C][C]-1.6738[/C][C]0.048265[/C][/ROW]
[ROW][C]5[/C][C]0.008586[/C][C]0.0986[/C][C]0.460785[/C][/ROW]
[ROW][C]6[/C][C]0.061161[/C][C]0.7027[/C][C]0.241744[/C][/ROW]
[ROW][C]7[/C][C]0.116985[/C][C]1.3441[/C][C]0.090618[/C][/ROW]
[ROW][C]8[/C][C]0.026311[/C][C]0.3023[/C][C]0.381454[/C][/ROW]
[ROW][C]9[/C][C]0.320445[/C][C]3.6816[/C][C]0.000168[/C][/ROW]
[ROW][C]10[/C][C]0.184066[/C][C]2.1148[/C][C]0.018165[/C][/ROW]
[ROW][C]11[/C][C]-0.054994[/C][C]-0.6318[/C][C]0.264296[/C][/ROW]
[ROW][C]12[/C][C]0.438681[/C][C]5.0401[/C][C]1e-06[/C][/ROW]
[ROW][C]13[/C][C]-0.282981[/C][C]-3.2512[/C][C]0.000729[/C][/ROW]
[ROW][C]14[/C][C]-0.088189[/C][C]-1.0132[/C][C]0.156407[/C][/ROW]
[ROW][C]15[/C][C]-0.205961[/C][C]-2.3663[/C][C]0.00971[/C][/ROW]
[ROW][C]16[/C][C]0.079673[/C][C]0.9154[/C][C]0.180832[/C][/ROW]
[ROW][C]17[/C][C]-0.155973[/C][C]-1.792[/C][C]0.037712[/C][/ROW]
[ROW][C]18[/C][C]-0.031635[/C][C]-0.3635[/C][C]0.358422[/C][/ROW]
[ROW][C]19[/C][C]-0.012991[/C][C]-0.1493[/C][C]0.440789[/C][/ROW]
[ROW][C]20[/C][C]-0.056763[/C][C]-0.6522[/C][C]0.257716[/C][/ROW]
[ROW][C]21[/C][C]-0.037947[/C][C]-0.436[/C][C]0.331782[/C][/ROW]
[/TABLE]
Source: https://freestatistics.org/blog/index.php?pk=148680&T=2

Globally Unique Identifier (entire table): ba.freestatistics.org/blog/index.php?pk=148680&T=2

As an alternative you can also use a QR Code:  

The GUIDs for individual cells are displayed in the table below:

Partial Autocorrelation Function
Time lag kPACF(k)T-STATP-value
10.4260714.89521e-06
20.3920284.50417e-06
30.2913163.3470.000532
4-0.145689-1.67380.048265
50.0085860.09860.460785
60.0611610.70270.241744
70.1169851.34410.090618
80.0263110.30230.381454
90.3204453.68160.000168
100.1840662.11480.018165
11-0.054994-0.63180.264296
120.4386815.04011e-06
13-0.282981-3.25120.000729
14-0.088189-1.01320.156407
15-0.205961-2.36630.00971
160.0796730.91540.180832
17-0.155973-1.7920.037712
18-0.031635-0.36350.358422
19-0.012991-0.14930.440789
20-0.056763-0.65220.257716
21-0.037947-0.4360.331782


Parameters (Session):
par1 = Default ; par2 = 1 ; par3 = 0 ; par4 = 0 ; par5 = 12 ; par6 = White Noise ; par7 = 0.95 ;
Parameters (R input):
par1 = Default ; par2 = 1 ; par3 = 0 ; par4 = 0 ; par5 = 12 ; par6 = White Noise ; par7 = 0.95 ; par8 = ;
R code (references can be found in the software module):
if (par1 == 'Default') {
par1 = 10*log10(length(x))
} else {
par1 <- as.numeric(par1)
}
par2 <- as.numeric(par2)
par3 <- as.numeric(par3)
par4 <- as.numeric(par4)
par5 <- as.numeric(par5)
if (par6 == 'White Noise') par6 <- 'white' else par6 <- 'ma'
par7 <- as.numeric(par7)
if (par8 != '') par8 <- as.numeric(par8)
ox <- x
if (par8 == '') {
if (par2 == 0) {
x <- log(x)
} else {
x <- (x ^ par2 - 1) / par2
}
} else {
x <- log(x,base=par8)
}
if (par3 > 0) x <- diff(x,lag=1,difference=par3)
if (par4 > 0) x <- diff(x,lag=par5,difference=par4)
bitmap(file='picts.png')
op <- par(mfrow=c(2,1))
plot(ox,type='l',main='Original Time Series',xlab='time',ylab='value')
if (par8=='') {
mytitle <- paste('Working Time Series (lambda=',par2,', d=',par3,', D=',par4,')',sep='')
mysub <- paste('(lambda=',par2,', d=',par3,', D=',par4,', CI=', par7, ', CI type=',par6,')',sep='')
} else {
mytitle <- paste('Working Time Series (base=',par8,', d=',par3,', D=',par4,')',sep='')
mysub <- paste('(base=',par8,', d=',par3,', D=',par4,', CI=', par7, ', CI type=',par6,')',sep='')
}
plot(x,type='l', main=mytitle,xlab='time',ylab='value')
par(op)
dev.off()
bitmap(file='pic1.png')
racf <- acf(x, par1, main='Autocorrelation', xlab='time lag', ylab='ACF', ci.type=par6, ci=par7, sub=mysub)
dev.off()
bitmap(file='pic2.png')
rpacf <- pacf(x,par1,main='Partial Autocorrelation',xlab='lags',ylab='PACF',sub=mysub)
dev.off()
(myacf <- c(racf$acf))
(mypacf <- c(rpacf$acf))
lengthx <- length(x)
sqrtn <- sqrt(lengthx)
load(file='createtable')
a<-table.start()
a<-table.row.start(a)
a<-table.element(a,'Autocorrelation Function',4,TRUE)
a<-table.row.end(a)
a<-table.row.start(a)
a<-table.element(a,'Time lag k',header=TRUE)
a<-table.element(a,hyperlink('basics.htm','ACF(k)','click here for more information about the Autocorrelation Function'),header=TRUE)
a<-table.element(a,'T-STAT',header=TRUE)
a<-table.element(a,'P-value',header=TRUE)
a<-table.row.end(a)
for (i in 2:(par1+1)) {
a<-table.row.start(a)
a<-table.element(a,i-1,header=TRUE)
a<-table.element(a,round(myacf[i],6))
mytstat <- myacf[i]*sqrtn
a<-table.element(a,round(mytstat,4))
a<-table.element(a,round(1-pt(abs(mytstat),lengthx),6))
a<-table.row.end(a)
}
a<-table.end(a)
table.save(a,file='mytable.tab')
a<-table.start()
a<-table.row.start(a)
a<-table.element(a,'Partial Autocorrelation Function',4,TRUE)
a<-table.row.end(a)
a<-table.row.start(a)
a<-table.element(a,'Time lag k',header=TRUE)
a<-table.element(a,hyperlink('basics.htm','PACF(k)','click here for more information about the Partial Autocorrelation Function'),header=TRUE)
a<-table.element(a,'T-STAT',header=TRUE)
a<-table.element(a,'P-value',header=TRUE)
a<-table.row.end(a)
for (i in 1:par1) {
a<-table.row.start(a)
a<-table.element(a,i,header=TRUE)
a<-table.element(a,round(mypacf[i],6))
mytstat <- mypacf[i]*sqrtn
a<-table.element(a,round(mytstat,4))
a<-table.element(a,round(1-pt(abs(mytstat),lengthx),6))
a<-table.row.end(a)
}
a<-table.end(a)
table.save(a,file='mytable1.tab')