| Multiple Linear Regression - Estimated Regression Equation |
| Werzoekende_werklozen[t] = + 583.2 -2.10555555555536M1[t] -8.67777777777779M2[t] -20.45M3[t] -27.6222222222222M4[t] -37.3944444444445M5[t] -38.1666666666667M6[t] + 13.4611111111111M7[t] + 42.8888888888889M8[t] + 33.1166666666667M9[t] + 15.9444444444444M10[t] -2.82777777777778M11[t] -2.22777777777778t + e[t] |
| Multiple Linear Regression - Ordinary Least Squares | |||||
| Variable | Parameter | S.D. | T-STAT H0: parameter = 0 | 2-tail p-value | 1-tail p-value |
| (Intercept) | 583.2 | 5.940186 | 98.1787 | 0 | 0 |
| M1 | -2.10555555555536 | 7.226569 | -0.2914 | 0.772056 | 0.386028 |
| M2 | -8.67777777777779 | 7.215772 | -1.2026 | 0.23515 | 0.117575 |
| M3 | -20.45 | 7.20599 | -2.8379 | 0.006684 | 0.003342 |
| M4 | -27.6222222222222 | 7.197225 | -3.8379 | 0.00037 | 0.000185 |
| M5 | -37.3944444444445 | 7.189483 | -5.2013 | 4e-06 | 2e-06 |
| M6 | -38.1666666666667 | 7.182767 | -5.3136 | 3e-06 | 1e-06 |
| M7 | 13.4611111111111 | 7.177079 | 1.8756 | 0.066934 | 0.033467 |
| M8 | 42.8888888888889 | 7.172421 | 5.9797 | 0 | 0 |
| M9 | 33.1166666666667 | 7.168797 | 4.6196 | 3e-05 | 1.5e-05 |
| M10 | 15.9444444444444 | 7.166207 | 2.2249 | 0.030922 | 0.015461 |
| M11 | -2.82777777777778 | 7.164653 | -0.3947 | 0.694861 | 0.347431 |
| t | -2.22777777777778 | 0.086171 | -25.8529 | 0 | 0 |
| Multiple Linear Regression - Regression Statistics | |
| Multiple R | 0.974985960661397 |
| R-squared | 0.950597623486827 |
| Adjusted R-squared | 0.93798425076006 |
| F-TEST (value) | 75.364269658781 |
| F-TEST (DF numerator) | 12 |
| F-TEST (DF denominator) | 47 |
| p-value | 0 |
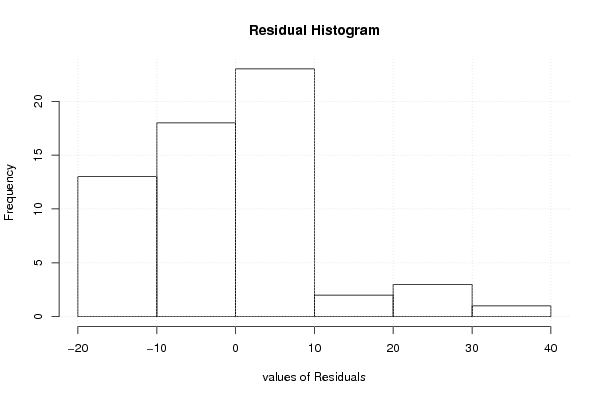
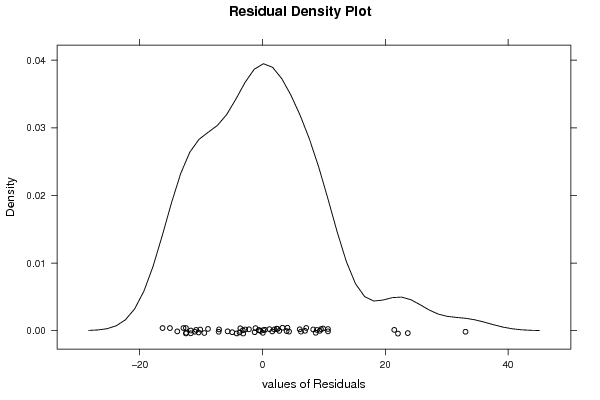
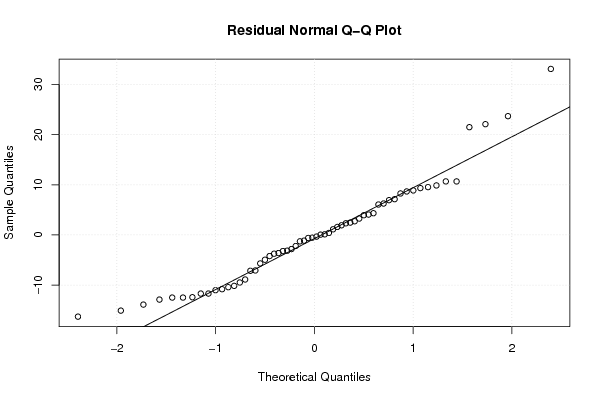
| Multiple Linear Regression - Residual Statistics | |
| Residual Standard Deviation | 11.3274911934456 |
| Sum Squared Residuals | 6030.66666666667 |
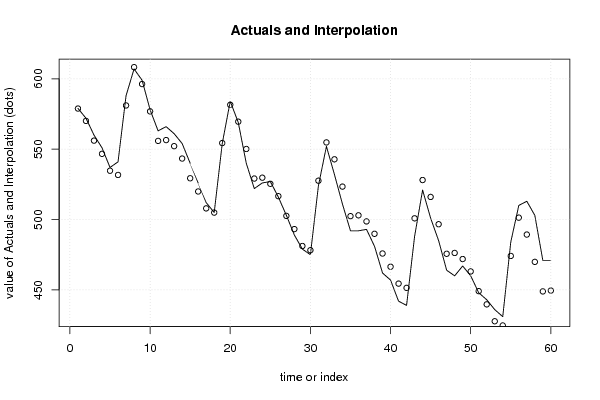
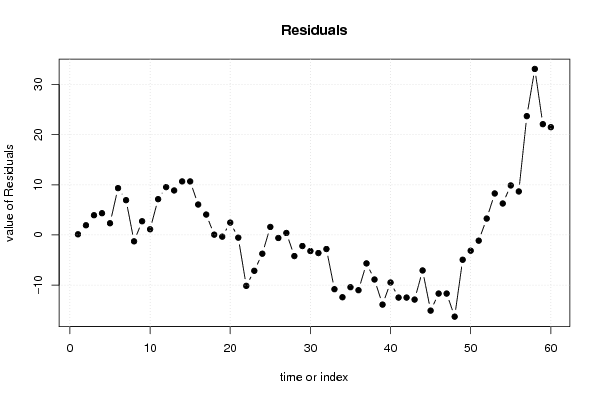
| Multiple Linear Regression - Actuals, Interpolation, and Residuals | |||
| Time or Index | Actuals | Interpolation Forecast | Residuals Prediction Error |
| 1 | 579 | 578.866666666666 | 0.133333333334093 |
| 2 | 572 | 570.066666666667 | 1.9333333333333 |
| 3 | 560 | 556.066666666667 | 3.9333333333333 |
| 4 | 551 | 546.666666666667 | 4.33333333333329 |
| 5 | 537 | 534.666666666667 | 2.3333333333333 |
| 6 | 541 | 531.666666666667 | 9.33333333333331 |
| 7 | 588 | 581.066666666667 | 6.9333333333333 |
| 8 | 607 | 608.266666666667 | -1.2666666666667 |
| 9 | 599 | 596.266666666667 | 2.73333333333329 |
| 10 | 578 | 576.866666666667 | 1.13333333333331 |
| 11 | 563 | 555.866666666667 | 7.1333333333333 |
| 12 | 566 | 556.466666666667 | 9.5333333333333 |
| 13 | 561 | 552.133333333334 | 8.86666666666647 |
| 14 | 554 | 543.333333333333 | 10.6666666666667 |
| 15 | 540 | 529.333333333333 | 10.6666666666666 |
| 16 | 526 | 519.933333333333 | 6.06666666666665 |
| 17 | 512 | 507.933333333333 | 4.06666666666665 |
| 18 | 505 | 504.933333333333 | 0.0666666666666498 |
| 19 | 554 | 554.333333333333 | -0.333333333333352 |
| 20 | 584 | 581.533333333333 | 2.46666666666665 |
| 21 | 569 | 569.533333333333 | -0.533333333333349 |
| 22 | 540 | 550.133333333333 | -10.1333333333333 |
| 23 | 522 | 529.133333333333 | -7.13333333333335 |
| 24 | 526 | 529.733333333333 | -3.73333333333335 |
| 25 | 527 | 525.4 | 1.59999999999979 |
| 26 | 516 | 516.6 | -0.600000000000006 |
| 27 | 503 | 502.6 | 0.400000000000004 |
| 28 | 489 | 493.2 | -4.2 |
| 29 | 479 | 481.2 | -2.2 |
| 30 | 475 | 478.2 | -3.2 |
| 31 | 524 | 527.6 | -3.6 |
| 32 | 552 | 554.8 | -2.79999999999999 |
| 33 | 532 | 542.8 | -10.8 |
| 34 | 511 | 523.4 | -12.4 |
| 35 | 492 | 502.4 | -10.4 |
| 36 | 492 | 503 | -11 |
| 37 | 493 | 498.666666666667 | -5.66666666666685 |
| 38 | 481 | 489.866666666667 | -8.86666666666665 |
| 39 | 462 | 475.866666666667 | -13.8666666666666 |
| 40 | 457 | 466.466666666667 | -9.46666666666665 |
| 41 | 442 | 454.466666666667 | -12.4666666666667 |
| 42 | 439 | 451.466666666667 | -12.4666666666667 |
| 43 | 488 | 500.866666666667 | -12.8666666666667 |
| 44 | 521 | 528.066666666667 | -7.06666666666666 |
| 45 | 501 | 516.066666666667 | -15.0666666666666 |
| 46 | 485 | 496.666666666667 | -11.6666666666667 |
| 47 | 464 | 475.666666666667 | -11.6666666666667 |
| 48 | 460 | 476.266666666667 | -16.2666666666667 |
| 49 | 467 | 471.933333333334 | -4.9333333333335 |
| 50 | 460 | 463.133333333333 | -3.13333333333329 |
| 51 | 448 | 449.133333333333 | -1.1333333333333 |
| 52 | 443 | 439.733333333333 | 3.26666666666671 |
| 53 | 436 | 427.733333333333 | 8.26666666666671 |
| 54 | 431 | 424.733333333333 | 6.2666666666667 |
| 55 | 484 | 474.133333333333 | 9.8666666666667 |
| 56 | 510 | 501.333333333333 | 8.6666666666667 |
| 57 | 513 | 489.333333333333 | 23.6666666666667 |
| 58 | 503 | 469.933333333333 | 33.0666666666667 |
| 59 | 471 | 448.933333333333 | 22.0666666666667 |
| 60 | 471 | 449.533333333333 | 21.4666666666667 |
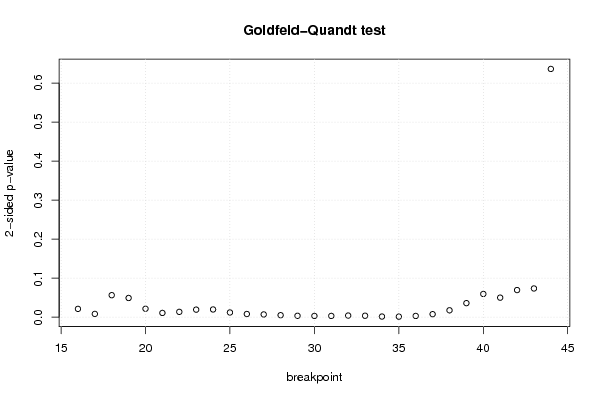
| Goldfeld-Quandt test for Heteroskedasticity | |||
| p-values | Alternative Hypothesis | ||
| breakpoint index | greater | 2-sided | less |
| 16 | 0.01070637054417 | 0.0214127410883399 | 0.98929362945583 |
| 17 | 0.0042729714188271 | 0.0085459428376542 | 0.995727028581173 |
| 18 | 0.0282573943200439 | 0.0565147886400878 | 0.971742605679956 |
| 19 | 0.0246707834292619 | 0.0493415668585238 | 0.975329216570738 |
| 20 | 0.010897814359319 | 0.021795628718638 | 0.98910218564068 |
| 21 | 0.00553754393440748 | 0.011075087868815 | 0.994462456065592 |
| 22 | 0.00689036195744792 | 0.0137807239148958 | 0.993109638042552 |
| 23 | 0.00972667330319517 | 0.0194533466063903 | 0.990273326696805 |
| 24 | 0.00996836347856342 | 0.0199367269571268 | 0.990031636521437 |
| 25 | 0.00610807860494401 | 0.012216157209888 | 0.993891921395056 |
| 26 | 0.00415641837528257 | 0.00831283675056514 | 0.995843581624717 |
| 27 | 0.00358806512624007 | 0.00717613025248014 | 0.99641193487376 |
| 28 | 0.00260751176393566 | 0.00521502352787131 | 0.997392488236064 |
| 29 | 0.00185545369727168 | 0.00371090739454336 | 0.998144546302728 |
| 30 | 0.00170484550466377 | 0.00340969100932754 | 0.998295154495336 |
| 31 | 0.00169439013666251 | 0.00338878027332503 | 0.998305609863337 |
| 32 | 0.00216215415146123 | 0.00432430830292246 | 0.997837845848539 |
| 33 | 0.00191056599113389 | 0.00382113198226778 | 0.998089434008866 |
| 34 | 0.00089854555667425 | 0.0017970911133485 | 0.999101454443326 |
| 35 | 0.000756110002268875 | 0.00151222000453775 | 0.999243889997731 |
| 36 | 0.00165843646951331 | 0.00331687293902663 | 0.998341563530487 |
| 37 | 0.00390606142595168 | 0.00781212285190337 | 0.996093938574048 |
| 38 | 0.00890728193819833 | 0.0178145638763967 | 0.991092718061802 |
| 39 | 0.0180500422318313 | 0.0361000844636626 | 0.981949957768169 |
| 40 | 0.0298319017159596 | 0.0596638034319192 | 0.97016809828404 |
| 41 | 0.0250948266893422 | 0.0501896533786844 | 0.974905173310658 |
| 42 | 0.0348415238931314 | 0.0696830477862627 | 0.965158476106869 |
| 43 | 0.036861589125941 | 0.073723178251882 | 0.96313841087406 |
| 44 | 0.681875049373294 | 0.636249901253412 | 0.318124950626706 |
| Meta Analysis of Goldfeld-Quandt test for Heteroskedasticity | |||
| Description | # significant tests | % significant tests | OK/NOK |
| 1% type I error level | 13 | 0.448275862068966 | NOK |
| 5% type I error level | 23 | 0.793103448275862 | NOK |
| 10% type I error level | 28 | 0.96551724137931 | NOK |