Free Statistics

of Irreproducible Research!

Author's title

Author*The author of this computation has been verified*
R Software Modulerwasp_exponentialsmoothing.wasp
Title produced by softwareExponential Smoothing
Date of computationTue, 29 Nov 2011 10:59:52 -0500
Cite this page as followsStatistical Computations at FreeStatistics.org, Office for Research Development and Education, URL https://freestatistics.org/blog/index.php?v=date/2011/Nov/29/t1322582404dze7q9aa2npggq6.htm/, Retrieved Fri, 26 Apr 2024 17:58:13 +0000
Statistical Computations at FreeStatistics.org, Office for Research Development and Education, URL https://freestatistics.org/blog/index.php?pk=148580, Retrieved Fri, 26 Apr 2024 17:58:13 +0000
QR Codes:

Original text written by user:
IsPrivate?No (this computation is public)
User-defined keywords
Estimated Impact81
Family? (F = Feedback message, R = changed R code, M = changed R Module, P = changed Parameters, D = changed Data)
F     [Univariate Data Series] [HPC Retail Sales] [2008-03-02 15:42:48] [74be16979710d4c4e7c6647856088456]
- RMPD  [Structural Time Series Models] [HPC Retail Sales] [2008-03-06 16:52:55] [74be16979710d4c4e7c6647856088456]
- R  D    [Structural Time Series Models] [HPC Retail Sales] [2008-03-08 11:33:35] [74be16979710d4c4e7c6647856088456]
- RMPD        [Exponential Smoothing] [ws8] [2011-11-29 15:59:52] [5ecdd7f9023ba8f0fbc3191d3a9c3da8] [Current]
Feedback Forum

Post a new message
Dataseries X:
13328
12873
14000
13477
14237
13674
13529
14058
12975
14326
14008
16193
14483
14011
15057
14884
15414
14440
14900
15074
14442
15307
14938
17193
15528
14765
15838
15723
16150
15486
15986
15983
15692
16490
15686
18897
16316
15636
17163
16534
16518
16375
16290
16352
15943
16362
16393
19051
16747
16320
17910
16961
17480
17049
16879
17473
16998
17307
17418
20169
17871
17226
19062
17804
19100
18522
18060
18869
18127
18871
18890
21263
19547
18450
20254
19240
20216
19420
19415
20018
18652
19978
19509
21971


Summary of computational transaction
Raw Inputview raw input (R code)
Raw Outputview raw output of R engine
Computing time2 seconds
R Server'Herman Ole Andreas Wold' @ wold.wessa.net

\begin{tabular}{lllllllll}
\hline
Summary of computational transaction \tabularnewline
Raw Input & view raw input (R code)  \tabularnewline
Raw Output & view raw output of R engine  \tabularnewline
Computing time & 2 seconds \tabularnewline
R Server & 'Herman Ole Andreas Wold' @ wold.wessa.net \tabularnewline
\hline
\end{tabular}
%Source: https://freestatistics.org/blog/index.php?pk=148580&T=0

[TABLE]
[ROW][C]Summary of computational transaction[/C][/ROW]
[ROW][C]Raw Input[/C][C]view raw input (R code) [/C][/ROW]
[ROW][C]Raw Output[/C][C]view raw output of R engine [/C][/ROW]
[ROW][C]Computing time[/C][C]2 seconds[/C][/ROW]
[ROW][C]R Server[/C][C]'Herman Ole Andreas Wold' @ wold.wessa.net[/C][/ROW]
[/TABLE]
Source: https://freestatistics.org/blog/index.php?pk=148580&T=0

Globally Unique Identifier (entire table): ba.freestatistics.org/blog/index.php?pk=148580&T=0

As an alternative you can also use a QR Code:  

The GUIDs for individual cells are displayed in the table below:

Summary of computational transaction
Raw Inputview raw input (R code)
Raw Outputview raw output of R engine
Computing time2 seconds
R Server'Herman Ole Andreas Wold' @ wold.wessa.net


Estimated Parameters of Exponential Smoothing
ParameterValue
alpha0.441210707478379
beta0
gamma1

\begin{tabular}{lllllllll}
\hline
Estimated Parameters of Exponential Smoothing \tabularnewline
Parameter & Value \tabularnewline
alpha & 0.441210707478379 \tabularnewline
beta & 0 \tabularnewline
gamma & 1 \tabularnewline
\hline
\end{tabular}
%Source: https://freestatistics.org/blog/index.php?pk=148580&T=1

[TABLE]
[ROW][C]Estimated Parameters of Exponential Smoothing[/C][/ROW]
[ROW][C]Parameter[/C][C]Value[/C][/ROW]
[ROW][C]alpha[/C][C]0.441210707478379[/C][/ROW]
[ROW][C]beta[/C][C]0[/C][/ROW]
[ROW][C]gamma[/C][C]1[/C][/ROW]
[/TABLE]
Source: https://freestatistics.org/blog/index.php?pk=148580&T=1

Globally Unique Identifier (entire table): ba.freestatistics.org/blog/index.php?pk=148580&T=1

As an alternative you can also use a QR Code:  

The GUIDs for individual cells are displayed in the table below:

Estimated Parameters of Exponential Smoothing
ParameterValue
alpha0.441210707478379
beta0
gamma1


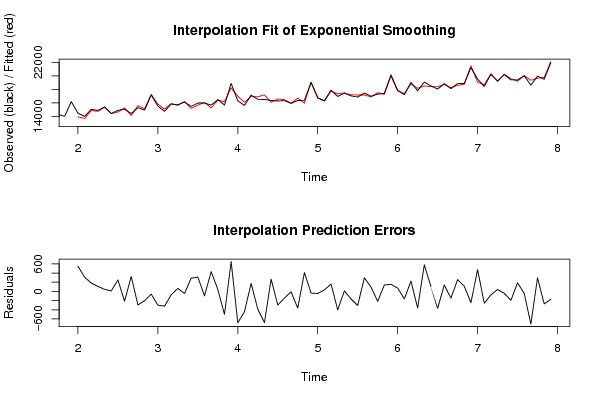
Interpolation Forecasts of Exponential Smoothing
tObservedFittedResiduals
131448313934.6017628205548.398237179494
141401113700.0651619681310.934838031908
151505714874.7571667776182.242833222448
161488414775.1272144315108.87278556845
171541415368.500611452445.4993885475942
181444014429.121320471710.8786795282867
191490014650.1753353045249.824664695454
201507415288.8215439688-214.821543968768
211444214114.5442035144327.455796485565
221530715602.3170987581-295.31709875812
231493815141.315924293-203.315924292978
241719317250.6149864358-57.6149864357758
251552815827.5545920911-299.554592091115
261476515086.2001187185-321.200118718463
271583815910.0756977176-72.0756977176115
281572315657.239289389865.7607106101714
291615016196.1788016315-46.1788016315058
301548615197.0044300021288.995569997942
311598615674.2870528431311.712947156862
321598316080.5997081844-97.5997081844453
331569215261.0606682514430.93933174859
341649016446.49278176643.5072182340009
351568616186.3937951024-500.393795102364
361889718246.0350436741650.964956325857
371631617000.4144461032-684.414446103227
381563616077.1603957515-441.160395751513
391716316987.3162750125175.68372498747
401653416920.8154859541-386.815485954095
411651817197.522933471-679.522933471038
421637516106.2021993496268.797800650411
431629016587.2675771979-297.267577197941
441635216496.1719754498-144.171975449797
451594315951.426708722-8.42670872198141
461636216726.5129040676-364.512904067604
471639315982.4650081338410.534991866156
481905119087.3847334156-36.3847334155798
491674716792.3023814175-45.3023814175067
501632016286.959175982833.0408240172001
511791017751.0236007289158.976399271061
521696117362.8328245451-401.832824545087
531748017469.352673964110.6473260359453
541704917212.4539204235-163.453920423526
551687917186.4939385992-307.493938599233
561747317176.4345396913296.565460308688
571699816902.000350364795.9996496353015
581730717524.1834199866-217.183419986632
591741817278.2273353959139.772664604141
602016920013.9498656037155.050134396311
611787117798.34754085172.6524591490233
621722617388.8246184119-162.824618411865
631906218836.8425637327225.15743626728
641780418164.4773802878-360.477380287797
651910018519.733186048580.266813952006
661852218416.8707374282105.129262571838
671806018428.9245119388-368.924511938843
681886918729.3032104637139.696789536258
691812718273.5828564742-146.582856474226
701887118613.7325810499257.267418950094
711889018776.5725247399113.427475260116
722126321509.2081618553-246.208161855273
731954719070.523441675476.47655832503
741845018707.5899661548-257.589966154817
752025420330.5966431988-76.5966431988127
761924019197.847864049342.1521359506733
772021620256.4259062639-40.4259062638594
781942019614.2054072447-194.205407244728
791941519229.2933470368185.706652963192
802001820058.5933914304-40.5933914303896
811865219363.3570782876-711.357078287634
821997819679.9895785805298.010421419513
831950919780.4295508439-271.429550843917
842197122142.3016039646-171.30160396465

\begin{tabular}{lllllllll}
\hline
Interpolation Forecasts of Exponential Smoothing \tabularnewline
t & Observed & Fitted & Residuals \tabularnewline
13 & 14483 & 13934.6017628205 & 548.398237179494 \tabularnewline
14 & 14011 & 13700.0651619681 & 310.934838031908 \tabularnewline
15 & 15057 & 14874.7571667776 & 182.242833222448 \tabularnewline
16 & 14884 & 14775.1272144315 & 108.87278556845 \tabularnewline
17 & 15414 & 15368.5006114524 & 45.4993885475942 \tabularnewline
18 & 14440 & 14429.1213204717 & 10.8786795282867 \tabularnewline
19 & 14900 & 14650.1753353045 & 249.824664695454 \tabularnewline
20 & 15074 & 15288.8215439688 & -214.821543968768 \tabularnewline
21 & 14442 & 14114.5442035144 & 327.455796485565 \tabularnewline
22 & 15307 & 15602.3170987581 & -295.31709875812 \tabularnewline
23 & 14938 & 15141.315924293 & -203.315924292978 \tabularnewline
24 & 17193 & 17250.6149864358 & -57.6149864357758 \tabularnewline
25 & 15528 & 15827.5545920911 & -299.554592091115 \tabularnewline
26 & 14765 & 15086.2001187185 & -321.200118718463 \tabularnewline
27 & 15838 & 15910.0756977176 & -72.0756977176115 \tabularnewline
28 & 15723 & 15657.2392893898 & 65.7607106101714 \tabularnewline
29 & 16150 & 16196.1788016315 & -46.1788016315058 \tabularnewline
30 & 15486 & 15197.0044300021 & 288.995569997942 \tabularnewline
31 & 15986 & 15674.2870528431 & 311.712947156862 \tabularnewline
32 & 15983 & 16080.5997081844 & -97.5997081844453 \tabularnewline
33 & 15692 & 15261.0606682514 & 430.93933174859 \tabularnewline
34 & 16490 & 16446.492781766 & 43.5072182340009 \tabularnewline
35 & 15686 & 16186.3937951024 & -500.393795102364 \tabularnewline
36 & 18897 & 18246.0350436741 & 650.964956325857 \tabularnewline
37 & 16316 & 17000.4144461032 & -684.414446103227 \tabularnewline
38 & 15636 & 16077.1603957515 & -441.160395751513 \tabularnewline
39 & 17163 & 16987.3162750125 & 175.68372498747 \tabularnewline
40 & 16534 & 16920.8154859541 & -386.815485954095 \tabularnewline
41 & 16518 & 17197.522933471 & -679.522933471038 \tabularnewline
42 & 16375 & 16106.2021993496 & 268.797800650411 \tabularnewline
43 & 16290 & 16587.2675771979 & -297.267577197941 \tabularnewline
44 & 16352 & 16496.1719754498 & -144.171975449797 \tabularnewline
45 & 15943 & 15951.426708722 & -8.42670872198141 \tabularnewline
46 & 16362 & 16726.5129040676 & -364.512904067604 \tabularnewline
47 & 16393 & 15982.4650081338 & 410.534991866156 \tabularnewline
48 & 19051 & 19087.3847334156 & -36.3847334155798 \tabularnewline
49 & 16747 & 16792.3023814175 & -45.3023814175067 \tabularnewline
50 & 16320 & 16286.9591759828 & 33.0408240172001 \tabularnewline
51 & 17910 & 17751.0236007289 & 158.976399271061 \tabularnewline
52 & 16961 & 17362.8328245451 & -401.832824545087 \tabularnewline
53 & 17480 & 17469.3526739641 & 10.6473260359453 \tabularnewline
54 & 17049 & 17212.4539204235 & -163.453920423526 \tabularnewline
55 & 16879 & 17186.4939385992 & -307.493938599233 \tabularnewline
56 & 17473 & 17176.4345396913 & 296.565460308688 \tabularnewline
57 & 16998 & 16902.0003503647 & 95.9996496353015 \tabularnewline
58 & 17307 & 17524.1834199866 & -217.183419986632 \tabularnewline
59 & 17418 & 17278.2273353959 & 139.772664604141 \tabularnewline
60 & 20169 & 20013.9498656037 & 155.050134396311 \tabularnewline
61 & 17871 & 17798.347540851 & 72.6524591490233 \tabularnewline
62 & 17226 & 17388.8246184119 & -162.824618411865 \tabularnewline
63 & 19062 & 18836.8425637327 & 225.15743626728 \tabularnewline
64 & 17804 & 18164.4773802878 & -360.477380287797 \tabularnewline
65 & 19100 & 18519.733186048 & 580.266813952006 \tabularnewline
66 & 18522 & 18416.8707374282 & 105.129262571838 \tabularnewline
67 & 18060 & 18428.9245119388 & -368.924511938843 \tabularnewline
68 & 18869 & 18729.3032104637 & 139.696789536258 \tabularnewline
69 & 18127 & 18273.5828564742 & -146.582856474226 \tabularnewline
70 & 18871 & 18613.7325810499 & 257.267418950094 \tabularnewline
71 & 18890 & 18776.5725247399 & 113.427475260116 \tabularnewline
72 & 21263 & 21509.2081618553 & -246.208161855273 \tabularnewline
73 & 19547 & 19070.523441675 & 476.47655832503 \tabularnewline
74 & 18450 & 18707.5899661548 & -257.589966154817 \tabularnewline
75 & 20254 & 20330.5966431988 & -76.5966431988127 \tabularnewline
76 & 19240 & 19197.8478640493 & 42.1521359506733 \tabularnewline
77 & 20216 & 20256.4259062639 & -40.4259062638594 \tabularnewline
78 & 19420 & 19614.2054072447 & -194.205407244728 \tabularnewline
79 & 19415 & 19229.2933470368 & 185.706652963192 \tabularnewline
80 & 20018 & 20058.5933914304 & -40.5933914303896 \tabularnewline
81 & 18652 & 19363.3570782876 & -711.357078287634 \tabularnewline
82 & 19978 & 19679.9895785805 & 298.010421419513 \tabularnewline
83 & 19509 & 19780.4295508439 & -271.429550843917 \tabularnewline
84 & 21971 & 22142.3016039646 & -171.30160396465 \tabularnewline
\hline
\end{tabular}
%Source: https://freestatistics.org/blog/index.php?pk=148580&T=2

[TABLE]
[ROW][C]Interpolation Forecasts of Exponential Smoothing[/C][/ROW]
[ROW][C]t[/C][C]Observed[/C][C]Fitted[/C][C]Residuals[/C][/ROW]
[ROW][C]13[/C][C]14483[/C][C]13934.6017628205[/C][C]548.398237179494[/C][/ROW]
[ROW][C]14[/C][C]14011[/C][C]13700.0651619681[/C][C]310.934838031908[/C][/ROW]
[ROW][C]15[/C][C]15057[/C][C]14874.7571667776[/C][C]182.242833222448[/C][/ROW]
[ROW][C]16[/C][C]14884[/C][C]14775.1272144315[/C][C]108.87278556845[/C][/ROW]
[ROW][C]17[/C][C]15414[/C][C]15368.5006114524[/C][C]45.4993885475942[/C][/ROW]
[ROW][C]18[/C][C]14440[/C][C]14429.1213204717[/C][C]10.8786795282867[/C][/ROW]
[ROW][C]19[/C][C]14900[/C][C]14650.1753353045[/C][C]249.824664695454[/C][/ROW]
[ROW][C]20[/C][C]15074[/C][C]15288.8215439688[/C][C]-214.821543968768[/C][/ROW]
[ROW][C]21[/C][C]14442[/C][C]14114.5442035144[/C][C]327.455796485565[/C][/ROW]
[ROW][C]22[/C][C]15307[/C][C]15602.3170987581[/C][C]-295.31709875812[/C][/ROW]
[ROW][C]23[/C][C]14938[/C][C]15141.315924293[/C][C]-203.315924292978[/C][/ROW]
[ROW][C]24[/C][C]17193[/C][C]17250.6149864358[/C][C]-57.6149864357758[/C][/ROW]
[ROW][C]25[/C][C]15528[/C][C]15827.5545920911[/C][C]-299.554592091115[/C][/ROW]
[ROW][C]26[/C][C]14765[/C][C]15086.2001187185[/C][C]-321.200118718463[/C][/ROW]
[ROW][C]27[/C][C]15838[/C][C]15910.0756977176[/C][C]-72.0756977176115[/C][/ROW]
[ROW][C]28[/C][C]15723[/C][C]15657.2392893898[/C][C]65.7607106101714[/C][/ROW]
[ROW][C]29[/C][C]16150[/C][C]16196.1788016315[/C][C]-46.1788016315058[/C][/ROW]
[ROW][C]30[/C][C]15486[/C][C]15197.0044300021[/C][C]288.995569997942[/C][/ROW]
[ROW][C]31[/C][C]15986[/C][C]15674.2870528431[/C][C]311.712947156862[/C][/ROW]
[ROW][C]32[/C][C]15983[/C][C]16080.5997081844[/C][C]-97.5997081844453[/C][/ROW]
[ROW][C]33[/C][C]15692[/C][C]15261.0606682514[/C][C]430.93933174859[/C][/ROW]
[ROW][C]34[/C][C]16490[/C][C]16446.492781766[/C][C]43.5072182340009[/C][/ROW]
[ROW][C]35[/C][C]15686[/C][C]16186.3937951024[/C][C]-500.393795102364[/C][/ROW]
[ROW][C]36[/C][C]18897[/C][C]18246.0350436741[/C][C]650.964956325857[/C][/ROW]
[ROW][C]37[/C][C]16316[/C][C]17000.4144461032[/C][C]-684.414446103227[/C][/ROW]
[ROW][C]38[/C][C]15636[/C][C]16077.1603957515[/C][C]-441.160395751513[/C][/ROW]
[ROW][C]39[/C][C]17163[/C][C]16987.3162750125[/C][C]175.68372498747[/C][/ROW]
[ROW][C]40[/C][C]16534[/C][C]16920.8154859541[/C][C]-386.815485954095[/C][/ROW]
[ROW][C]41[/C][C]16518[/C][C]17197.522933471[/C][C]-679.522933471038[/C][/ROW]
[ROW][C]42[/C][C]16375[/C][C]16106.2021993496[/C][C]268.797800650411[/C][/ROW]
[ROW][C]43[/C][C]16290[/C][C]16587.2675771979[/C][C]-297.267577197941[/C][/ROW]
[ROW][C]44[/C][C]16352[/C][C]16496.1719754498[/C][C]-144.171975449797[/C][/ROW]
[ROW][C]45[/C][C]15943[/C][C]15951.426708722[/C][C]-8.42670872198141[/C][/ROW]
[ROW][C]46[/C][C]16362[/C][C]16726.5129040676[/C][C]-364.512904067604[/C][/ROW]
[ROW][C]47[/C][C]16393[/C][C]15982.4650081338[/C][C]410.534991866156[/C][/ROW]
[ROW][C]48[/C][C]19051[/C][C]19087.3847334156[/C][C]-36.3847334155798[/C][/ROW]
[ROW][C]49[/C][C]16747[/C][C]16792.3023814175[/C][C]-45.3023814175067[/C][/ROW]
[ROW][C]50[/C][C]16320[/C][C]16286.9591759828[/C][C]33.0408240172001[/C][/ROW]
[ROW][C]51[/C][C]17910[/C][C]17751.0236007289[/C][C]158.976399271061[/C][/ROW]
[ROW][C]52[/C][C]16961[/C][C]17362.8328245451[/C][C]-401.832824545087[/C][/ROW]
[ROW][C]53[/C][C]17480[/C][C]17469.3526739641[/C][C]10.6473260359453[/C][/ROW]
[ROW][C]54[/C][C]17049[/C][C]17212.4539204235[/C][C]-163.453920423526[/C][/ROW]
[ROW][C]55[/C][C]16879[/C][C]17186.4939385992[/C][C]-307.493938599233[/C][/ROW]
[ROW][C]56[/C][C]17473[/C][C]17176.4345396913[/C][C]296.565460308688[/C][/ROW]
[ROW][C]57[/C][C]16998[/C][C]16902.0003503647[/C][C]95.9996496353015[/C][/ROW]
[ROW][C]58[/C][C]17307[/C][C]17524.1834199866[/C][C]-217.183419986632[/C][/ROW]
[ROW][C]59[/C][C]17418[/C][C]17278.2273353959[/C][C]139.772664604141[/C][/ROW]
[ROW][C]60[/C][C]20169[/C][C]20013.9498656037[/C][C]155.050134396311[/C][/ROW]
[ROW][C]61[/C][C]17871[/C][C]17798.347540851[/C][C]72.6524591490233[/C][/ROW]
[ROW][C]62[/C][C]17226[/C][C]17388.8246184119[/C][C]-162.824618411865[/C][/ROW]
[ROW][C]63[/C][C]19062[/C][C]18836.8425637327[/C][C]225.15743626728[/C][/ROW]
[ROW][C]64[/C][C]17804[/C][C]18164.4773802878[/C][C]-360.477380287797[/C][/ROW]
[ROW][C]65[/C][C]19100[/C][C]18519.733186048[/C][C]580.266813952006[/C][/ROW]
[ROW][C]66[/C][C]18522[/C][C]18416.8707374282[/C][C]105.129262571838[/C][/ROW]
[ROW][C]67[/C][C]18060[/C][C]18428.9245119388[/C][C]-368.924511938843[/C][/ROW]
[ROW][C]68[/C][C]18869[/C][C]18729.3032104637[/C][C]139.696789536258[/C][/ROW]
[ROW][C]69[/C][C]18127[/C][C]18273.5828564742[/C][C]-146.582856474226[/C][/ROW]
[ROW][C]70[/C][C]18871[/C][C]18613.7325810499[/C][C]257.267418950094[/C][/ROW]
[ROW][C]71[/C][C]18890[/C][C]18776.5725247399[/C][C]113.427475260116[/C][/ROW]
[ROW][C]72[/C][C]21263[/C][C]21509.2081618553[/C][C]-246.208161855273[/C][/ROW]
[ROW][C]73[/C][C]19547[/C][C]19070.523441675[/C][C]476.47655832503[/C][/ROW]
[ROW][C]74[/C][C]18450[/C][C]18707.5899661548[/C][C]-257.589966154817[/C][/ROW]
[ROW][C]75[/C][C]20254[/C][C]20330.5966431988[/C][C]-76.5966431988127[/C][/ROW]
[ROW][C]76[/C][C]19240[/C][C]19197.8478640493[/C][C]42.1521359506733[/C][/ROW]
[ROW][C]77[/C][C]20216[/C][C]20256.4259062639[/C][C]-40.4259062638594[/C][/ROW]
[ROW][C]78[/C][C]19420[/C][C]19614.2054072447[/C][C]-194.205407244728[/C][/ROW]
[ROW][C]79[/C][C]19415[/C][C]19229.2933470368[/C][C]185.706652963192[/C][/ROW]
[ROW][C]80[/C][C]20018[/C][C]20058.5933914304[/C][C]-40.5933914303896[/C][/ROW]
[ROW][C]81[/C][C]18652[/C][C]19363.3570782876[/C][C]-711.357078287634[/C][/ROW]
[ROW][C]82[/C][C]19978[/C][C]19679.9895785805[/C][C]298.010421419513[/C][/ROW]
[ROW][C]83[/C][C]19509[/C][C]19780.4295508439[/C][C]-271.429550843917[/C][/ROW]
[ROW][C]84[/C][C]21971[/C][C]22142.3016039646[/C][C]-171.30160396465[/C][/ROW]
[/TABLE]
Source: https://freestatistics.org/blog/index.php?pk=148580&T=2

Globally Unique Identifier (entire table): ba.freestatistics.org/blog/index.php?pk=148580&T=2

As an alternative you can also use a QR Code:  

The GUIDs for individual cells are displayed in the table below:

Interpolation Forecasts of Exponential Smoothing
tObservedFittedResiduals
131448313934.6017628205548.398237179494
141401113700.0651619681310.934838031908
151505714874.7571667776182.242833222448
161488414775.1272144315108.87278556845
171541415368.500611452445.4993885475942
181444014429.121320471710.8786795282867
191490014650.1753353045249.824664695454
201507415288.8215439688-214.821543968768
211444214114.5442035144327.455796485565
221530715602.3170987581-295.31709875812
231493815141.315924293-203.315924292978
241719317250.6149864358-57.6149864357758
251552815827.5545920911-299.554592091115
261476515086.2001187185-321.200118718463
271583815910.0756977176-72.0756977176115
281572315657.239289389865.7607106101714
291615016196.1788016315-46.1788016315058
301548615197.0044300021288.995569997942
311598615674.2870528431311.712947156862
321598316080.5997081844-97.5997081844453
331569215261.0606682514430.93933174859
341649016446.49278176643.5072182340009
351568616186.3937951024-500.393795102364
361889718246.0350436741650.964956325857
371631617000.4144461032-684.414446103227
381563616077.1603957515-441.160395751513
391716316987.3162750125175.68372498747
401653416920.8154859541-386.815485954095
411651817197.522933471-679.522933471038
421637516106.2021993496268.797800650411
431629016587.2675771979-297.267577197941
441635216496.1719754498-144.171975449797
451594315951.426708722-8.42670872198141
461636216726.5129040676-364.512904067604
471639315982.4650081338410.534991866156
481905119087.3847334156-36.3847334155798
491674716792.3023814175-45.3023814175067
501632016286.959175982833.0408240172001
511791017751.0236007289158.976399271061
521696117362.8328245451-401.832824545087
531748017469.352673964110.6473260359453
541704917212.4539204235-163.453920423526
551687917186.4939385992-307.493938599233
561747317176.4345396913296.565460308688
571699816902.000350364795.9996496353015
581730717524.1834199866-217.183419986632
591741817278.2273353959139.772664604141
602016920013.9498656037155.050134396311
611787117798.34754085172.6524591490233
621722617388.8246184119-162.824618411865
631906218836.8425637327225.15743626728
641780418164.4773802878-360.477380287797
651910018519.733186048580.266813952006
661852218416.8707374282105.129262571838
671806018428.9245119388-368.924511938843
681886918729.3032104637139.696789536258
691812718273.5828564742-146.582856474226
701887118613.7325810499257.267418950094
711889018776.5725247399113.427475260116
722126321509.2081618553-246.208161855273
731954719070.523441675476.47655832503
741845018707.5899661548-257.589966154817
752025420330.5966431988-76.5966431988127
761924019197.847864049342.1521359506733
772021620256.4259062639-40.4259062638594
781942019614.2054072447-194.205407244728
791941519229.2933470368185.706652963192
802001820058.5933914304-40.5933914303896
811865219363.3570782876-711.357078287634
821997819679.9895785805298.010421419513
831950919780.4295508439-271.429550843917
842197122142.3016039646-171.30160396465


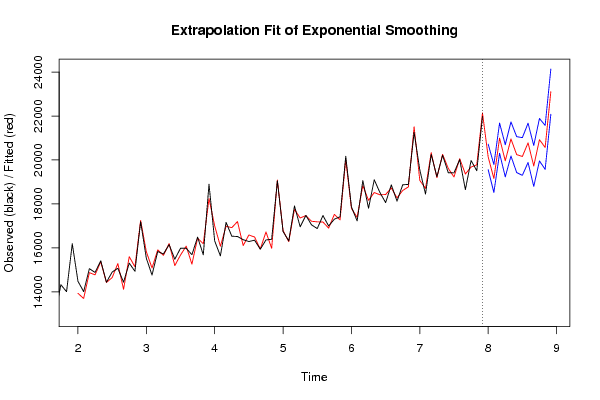
Extrapolation Forecasts of Exponential Smoothing
tForecast95% Lower Bound95% Upper Bound
8520140.494942691819558.662634311220722.3272510724
8619157.146393898318521.198919627719793.0938681689
8720994.941653034520309.135889726221680.7474163428
8819962.3436793119230.066477737720694.6208808822
8920956.180022013120180.209497509721732.1505465165
9020245.865527139719428.534131771921063.1969225074
9120158.929763402319302.232054283521015.6274725212
9220779.840002354319885.507111443421674.1728932652
9319727.698362135318797.251332627120658.1453916436
9420922.212973264919957.002100099721887.4238464301
9520572.970597423319574.205167188521571.736027658
9623110.550699300722079.321946992224141.7794516092

\begin{tabular}{lllllllll}
\hline
Extrapolation Forecasts of Exponential Smoothing \tabularnewline
t & Forecast & 95% Lower Bound & 95% Upper Bound \tabularnewline
85 & 20140.4949426918 & 19558.6626343112 & 20722.3272510724 \tabularnewline
86 & 19157.1463938983 & 18521.1989196277 & 19793.0938681689 \tabularnewline
87 & 20994.9416530345 & 20309.1358897262 & 21680.7474163428 \tabularnewline
88 & 19962.34367931 & 19230.0664777377 & 20694.6208808822 \tabularnewline
89 & 20956.1800220131 & 20180.2094975097 & 21732.1505465165 \tabularnewline
90 & 20245.8655271397 & 19428.5341317719 & 21063.1969225074 \tabularnewline
91 & 20158.9297634023 & 19302.2320542835 & 21015.6274725212 \tabularnewline
92 & 20779.8400023543 & 19885.5071114434 & 21674.1728932652 \tabularnewline
93 & 19727.6983621353 & 18797.2513326271 & 20658.1453916436 \tabularnewline
94 & 20922.2129732649 & 19957.0021000997 & 21887.4238464301 \tabularnewline
95 & 20572.9705974233 & 19574.2051671885 & 21571.736027658 \tabularnewline
96 & 23110.5506993007 & 22079.3219469922 & 24141.7794516092 \tabularnewline
\hline
\end{tabular}
%Source: https://freestatistics.org/blog/index.php?pk=148580&T=3

[TABLE]
[ROW][C]Extrapolation Forecasts of Exponential Smoothing[/C][/ROW]
[ROW][C]t[/C][C]Forecast[/C][C]95% Lower Bound[/C][C]95% Upper Bound[/C][/ROW]
[ROW][C]85[/C][C]20140.4949426918[/C][C]19558.6626343112[/C][C]20722.3272510724[/C][/ROW]
[ROW][C]86[/C][C]19157.1463938983[/C][C]18521.1989196277[/C][C]19793.0938681689[/C][/ROW]
[ROW][C]87[/C][C]20994.9416530345[/C][C]20309.1358897262[/C][C]21680.7474163428[/C][/ROW]
[ROW][C]88[/C][C]19962.34367931[/C][C]19230.0664777377[/C][C]20694.6208808822[/C][/ROW]
[ROW][C]89[/C][C]20956.1800220131[/C][C]20180.2094975097[/C][C]21732.1505465165[/C][/ROW]
[ROW][C]90[/C][C]20245.8655271397[/C][C]19428.5341317719[/C][C]21063.1969225074[/C][/ROW]
[ROW][C]91[/C][C]20158.9297634023[/C][C]19302.2320542835[/C][C]21015.6274725212[/C][/ROW]
[ROW][C]92[/C][C]20779.8400023543[/C][C]19885.5071114434[/C][C]21674.1728932652[/C][/ROW]
[ROW][C]93[/C][C]19727.6983621353[/C][C]18797.2513326271[/C][C]20658.1453916436[/C][/ROW]
[ROW][C]94[/C][C]20922.2129732649[/C][C]19957.0021000997[/C][C]21887.4238464301[/C][/ROW]
[ROW][C]95[/C][C]20572.9705974233[/C][C]19574.2051671885[/C][C]21571.736027658[/C][/ROW]
[ROW][C]96[/C][C]23110.5506993007[/C][C]22079.3219469922[/C][C]24141.7794516092[/C][/ROW]
[/TABLE]
Source: https://freestatistics.org/blog/index.php?pk=148580&T=3

Globally Unique Identifier (entire table): ba.freestatistics.org/blog/index.php?pk=148580&T=3

As an alternative you can also use a QR Code:  

The GUIDs for individual cells are displayed in the table below:

Extrapolation Forecasts of Exponential Smoothing
tForecast95% Lower Bound95% Upper Bound
8520140.494942691819558.662634311220722.3272510724
8619157.146393898318521.198919627719793.0938681689
8720994.941653034520309.135889726221680.7474163428
8819962.3436793119230.066477737720694.6208808822
8920956.180022013120180.209497509721732.1505465165
9020245.865527139719428.534131771921063.1969225074
9120158.929763402319302.232054283521015.6274725212
9220779.840002354319885.507111443421674.1728932652
9319727.698362135318797.251332627120658.1453916436
9420922.212973264919957.002100099721887.4238464301
9520572.970597423319574.205167188521571.736027658
9623110.550699300722079.321946992224141.7794516092


Parameters (Session):
par1 = 12 ; par2 = Triple ; par3 = additive ;
Parameters (R input):
par1 = 12 ; par2 = Triple ; par3 = additive ;
R code (references can be found in the software module):
par1 <- as.numeric(par1)
if (par2 == 'Single') K <- 1
if (par2 == 'Double') K <- 2
if (par2 == 'Triple') K <- par1
nx <- length(x)
nxmK <- nx - K
x <- ts(x, frequency = par1)
if (par2 == 'Single') fit <- HoltWinters(x, gamma=F, beta=F)
if (par2 == 'Double') fit <- HoltWinters(x, gamma=F)
if (par2 == 'Triple') fit <- HoltWinters(x, seasonal=par3)
fit
myresid <- x - fit$fitted[,'xhat']
bitmap(file='test1.png')
op <- par(mfrow=c(2,1))
plot(fit,ylab='Observed (black) / Fitted (red)',main='Interpolation Fit of Exponential Smoothing')
plot(myresid,ylab='Residuals',main='Interpolation Prediction Errors')
par(op)
dev.off()
bitmap(file='test2.png')
p <- predict(fit, par1, prediction.interval=TRUE)
np <- length(p[,1])
plot(fit,p,ylab='Observed (black) / Fitted (red)',main='Extrapolation Fit of Exponential Smoothing')
dev.off()
bitmap(file='test3.png')
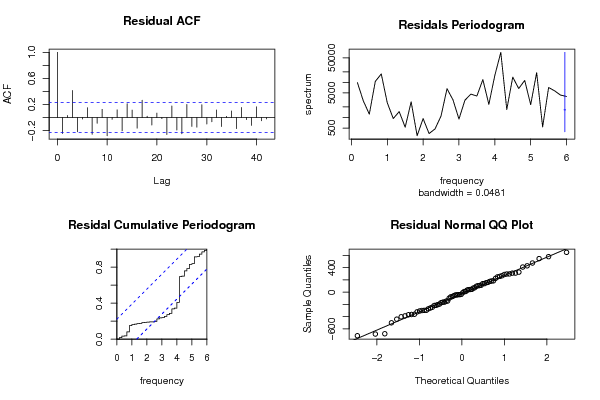
op <- par(mfrow = c(2,2))
acf(as.numeric(myresid),lag.max = nx/2,main='Residual ACF')
spectrum(myresid,main='Residals Periodogram')
cpgram(myresid,main='Residal Cumulative Periodogram')
qqnorm(myresid,main='Residual Normal QQ Plot')
qqline(myresid)
par(op)
dev.off()
load(file='createtable')
a<-table.start()
a<-table.row.start(a)
a<-table.element(a,'Estimated Parameters of Exponential Smoothing',2,TRUE)
a<-table.row.end(a)
a<-table.row.start(a)
a<-table.element(a,'Parameter',header=TRUE)
a<-table.element(a,'Value',header=TRUE)
a<-table.row.end(a)
a<-table.row.start(a)
a<-table.element(a,'alpha',header=TRUE)
a<-table.element(a,fit$alpha)
a<-table.row.end(a)
a<-table.row.start(a)
a<-table.element(a,'beta',header=TRUE)
a<-table.element(a,fit$beta)
a<-table.row.end(a)
a<-table.row.start(a)
a<-table.element(a,'gamma',header=TRUE)
a<-table.element(a,fit$gamma)
a<-table.row.end(a)
a<-table.end(a)
table.save(a,file='mytable.tab')
a<-table.start()
a<-table.row.start(a)
a<-table.element(a,'Interpolation Forecasts of Exponential Smoothing',4,TRUE)
a<-table.row.end(a)
a<-table.row.start(a)
a<-table.element(a,'t',header=TRUE)
a<-table.element(a,'Observed',header=TRUE)
a<-table.element(a,'Fitted',header=TRUE)
a<-table.element(a,'Residuals',header=TRUE)
a<-table.row.end(a)
for (i in 1:nxmK) {
a<-table.row.start(a)
a<-table.element(a,i+K,header=TRUE)
a<-table.element(a,x[i+K])
a<-table.element(a,fit$fitted[i,'xhat'])
a<-table.element(a,myresid[i])
a<-table.row.end(a)
}
a<-table.end(a)
table.save(a,file='mytable1.tab')
a<-table.start()
a<-table.row.start(a)
a<-table.element(a,'Extrapolation Forecasts of Exponential Smoothing',4,TRUE)
a<-table.row.end(a)
a<-table.row.start(a)
a<-table.element(a,'t',header=TRUE)
a<-table.element(a,'Forecast',header=TRUE)
a<-table.element(a,'95% Lower Bound',header=TRUE)
a<-table.element(a,'95% Upper Bound',header=TRUE)
a<-table.row.end(a)
for (i in 1:np) {
a<-table.row.start(a)
a<-table.element(a,nx+i,header=TRUE)
a<-table.element(a,p[i,'fit'])
a<-table.element(a,p[i,'lwr'])
a<-table.element(a,p[i,'upr'])
a<-table.row.end(a)
}
a<-table.end(a)
table.save(a,file='mytable2.tab')