Free Statistics

of Irreproducible Research!

Author's title

Author*The author of this computation has been verified*
R Software Modulerwasp_exponentialsmoothing.wasp
Title produced by softwareExponential Smoothing
Date of computationTue, 29 Nov 2011 10:13:08 -0500
Cite this page as followsStatistical Computations at FreeStatistics.org, Office for Research Development and Education, URL https://freestatistics.org/blog/index.php?v=date/2011/Nov/29/t1322579624ftf2t8xn4xupaw9.htm/, Retrieved Fri, 26 Apr 2024 01:19:04 +0000
Statistical Computations at FreeStatistics.org, Office for Research Development and Education, URL https://freestatistics.org/blog/index.php?pk=148498, Retrieved Fri, 26 Apr 2024 01:19:04 +0000
QR Codes:

Original text written by user:
IsPrivate?No (this computation is public)
User-defined keywords
Estimated Impact86
Family? (F = Feedback message, R = changed R code, M = changed R Module, P = changed Parameters, D = changed Data)
-       [Exponential Smoothing] [] [2011-11-29 15:13:08] [75a32e1bc492240bc1028714aca23077] [Current]
- R PD    [Exponential Smoothing] [] [2011-12-21 21:46:01] [493236dcc414c5f9e1823f06b33a5ad6]
Feedback Forum

Post a new message
Dataseries X:
1,0622
1,0773
1,0807
1,0848
1,1582
1,1663
1,1372
1,1139
1,1222
1,1692
1,1702
1,2286
1,2613
1,2646
1,2262
1,1985
1,2007
1,2138
1,2266
1,2176
1,2218
1,249
1,2991
1,3408
1,3119
1,3014
1,3201
1,2938
1,2694
1,2165
1,2037
1,2292
1,2256
1,2015
1,1786
1,1856
1,2103
1,1938
1,202
1,2271
1,277
1,265
1,2684
1,2811
1,2727
1,2611
1,2881
1,3213
1,2999
1,3074
1,3242
1,3516
1,3511
1,3419
1,3716
1,3622
1,3896
1,4227
1,4684
1,457


Summary of computational transaction
Raw Inputview raw input (R code)
Raw Outputview raw output of R engine
Computing time2 seconds
R Server'Gwilym Jenkins' @ jenkins.wessa.net

\begin{tabular}{lllllllll}
\hline
Summary of computational transaction \tabularnewline
Raw Input & view raw input (R code)  \tabularnewline
Raw Output & view raw output of R engine  \tabularnewline
Computing time & 2 seconds \tabularnewline
R Server & 'Gwilym Jenkins' @ jenkins.wessa.net \tabularnewline
\hline
\end{tabular}
%Source: https://freestatistics.org/blog/index.php?pk=148498&T=0

[TABLE]
[ROW][C]Summary of computational transaction[/C][/ROW]
[ROW][C]Raw Input[/C][C]view raw input (R code) [/C][/ROW]
[ROW][C]Raw Output[/C][C]view raw output of R engine [/C][/ROW]
[ROW][C]Computing time[/C][C]2 seconds[/C][/ROW]
[ROW][C]R Server[/C][C]'Gwilym Jenkins' @ jenkins.wessa.net[/C][/ROW]
[/TABLE]
Source: https://freestatistics.org/blog/index.php?pk=148498&T=0

Globally Unique Identifier (entire table): ba.freestatistics.org/blog/index.php?pk=148498&T=0

As an alternative you can also use a QR Code:  

The GUIDs for individual cells are displayed in the table below:

Summary of computational transaction
Raw Inputview raw input (R code)
Raw Outputview raw output of R engine
Computing time2 seconds
R Server'Gwilym Jenkins' @ jenkins.wessa.net


Estimated Parameters of Exponential Smoothing
ParameterValue
alpha0.86146509347809
beta0
gamma1

\begin{tabular}{lllllllll}
\hline
Estimated Parameters of Exponential Smoothing \tabularnewline
Parameter & Value \tabularnewline
alpha & 0.86146509347809 \tabularnewline
beta & 0 \tabularnewline
gamma & 1 \tabularnewline
\hline
\end{tabular}
%Source: https://freestatistics.org/blog/index.php?pk=148498&T=1

[TABLE]
[ROW][C]Estimated Parameters of Exponential Smoothing[/C][/ROW]
[ROW][C]Parameter[/C][C]Value[/C][/ROW]
[ROW][C]alpha[/C][C]0.86146509347809[/C][/ROW]
[ROW][C]beta[/C][C]0[/C][/ROW]
[ROW][C]gamma[/C][C]1[/C][/ROW]
[/TABLE]
Source: https://freestatistics.org/blog/index.php?pk=148498&T=1

Globally Unique Identifier (entire table): ba.freestatistics.org/blog/index.php?pk=148498&T=1

As an alternative you can also use a QR Code:  

The GUIDs for individual cells are displayed in the table below:

Estimated Parameters of Exponential Smoothing
ParameterValue
alpha0.86146509347809
beta0
gamma1


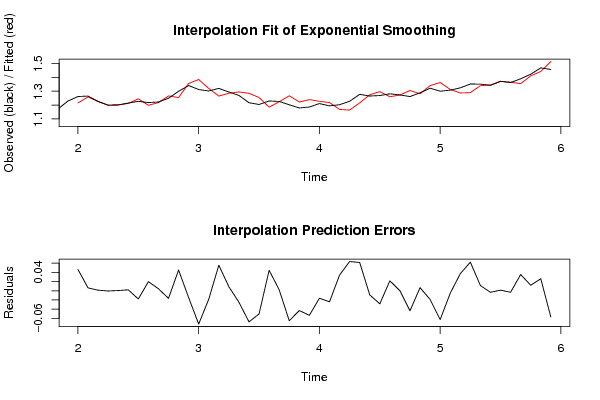
Interpolation Forecasts of Exponential Smoothing
tObservedFittedResiduals
131.26131.215009722222220.0462902777777783
141.26461.258287559483060.00631244051693902
151.22621.225000885430940.00119911456906041
161.19851.19900509289648-0.000505092896478043
171.20071.200220351785080.000479648214922523
181.21381.211833930767260.00196606923273923
191.22661.24453634290384-0.0179363429038391
201.21761.197831021708740.0197689782912598
211.22181.217440851894930.00435914810506777
221.2491.26554231794596-0.0165423179459612
231.29911.253929567258180.0451704327418216
241.34081.35563853044377-0.014838530443769
251.31191.38441051918731-0.0725105191873137
261.30141.31980729083747-0.0184072908374699
271.32011.264517056971160.0555829430288362
281.29381.285134942082570.00866505791743299
291.26941.2943863868171-0.024986386817097
301.21651.28426778674666-0.0677677867466608
311.20371.25413973731846-0.050439737318456
321.22921.184657379562760.0445426204372443
331.22561.223474038311670.00212596168833157
341.20151.2667561095719-0.0652561095718995
351.17861.22172749797515-0.0431274979751475
361.18561.23905753991633-0.0534575399163302
371.21031.22657101648504-0.0162710164850444
381.19381.21791134226975-0.0241113422697514
391.2021.167957497335330.0340425026646656
401.22711.163519280146740.0635807198532559
411.2771.21541675097360.0615832490263963
421.2651.27394815309733-0.00894815309732788
431.26841.29689170457694-0.028491704576936
441.28111.259475182951490.0216248170485138
451.27271.272672766207062.72337929385635e-05
461.26111.30481208770141-0.0437120877014137
471.28811.281408484058230.00669151594177042
481.32131.34022479608565-0.0189247960856469
491.29991.36263865759394-0.0627386575939433
501.30741.31286257378738-0.0054625737873808
511.32421.287030329408760.0371696705912405
521.35161.28937813238740.0622218676125967
531.35111.339828280007460.011271719992539
541.34191.34524699486894-0.00334699486893819
551.37161.370308284568020.00129171543198181
561.36221.36549202728323-0.00329202728323263
571.38961.354232599729970.0353674002700293
581.42271.410756818227490.0119431817725106
591.46841.442280945023280.0261190549767163
601.4571.51428465038934-0.0572846503893354

\begin{tabular}{lllllllll}
\hline
Interpolation Forecasts of Exponential Smoothing \tabularnewline
t & Observed & Fitted & Residuals \tabularnewline
13 & 1.2613 & 1.21500972222222 & 0.0462902777777783 \tabularnewline
14 & 1.2646 & 1.25828755948306 & 0.00631244051693902 \tabularnewline
15 & 1.2262 & 1.22500088543094 & 0.00119911456906041 \tabularnewline
16 & 1.1985 & 1.19900509289648 & -0.000505092896478043 \tabularnewline
17 & 1.2007 & 1.20022035178508 & 0.000479648214922523 \tabularnewline
18 & 1.2138 & 1.21183393076726 & 0.00196606923273923 \tabularnewline
19 & 1.2266 & 1.24453634290384 & -0.0179363429038391 \tabularnewline
20 & 1.2176 & 1.19783102170874 & 0.0197689782912598 \tabularnewline
21 & 1.2218 & 1.21744085189493 & 0.00435914810506777 \tabularnewline
22 & 1.249 & 1.26554231794596 & -0.0165423179459612 \tabularnewline
23 & 1.2991 & 1.25392956725818 & 0.0451704327418216 \tabularnewline
24 & 1.3408 & 1.35563853044377 & -0.014838530443769 \tabularnewline
25 & 1.3119 & 1.38441051918731 & -0.0725105191873137 \tabularnewline
26 & 1.3014 & 1.31980729083747 & -0.0184072908374699 \tabularnewline
27 & 1.3201 & 1.26451705697116 & 0.0555829430288362 \tabularnewline
28 & 1.2938 & 1.28513494208257 & 0.00866505791743299 \tabularnewline
29 & 1.2694 & 1.2943863868171 & -0.024986386817097 \tabularnewline
30 & 1.2165 & 1.28426778674666 & -0.0677677867466608 \tabularnewline
31 & 1.2037 & 1.25413973731846 & -0.050439737318456 \tabularnewline
32 & 1.2292 & 1.18465737956276 & 0.0445426204372443 \tabularnewline
33 & 1.2256 & 1.22347403831167 & 0.00212596168833157 \tabularnewline
34 & 1.2015 & 1.2667561095719 & -0.0652561095718995 \tabularnewline
35 & 1.1786 & 1.22172749797515 & -0.0431274979751475 \tabularnewline
36 & 1.1856 & 1.23905753991633 & -0.0534575399163302 \tabularnewline
37 & 1.2103 & 1.22657101648504 & -0.0162710164850444 \tabularnewline
38 & 1.1938 & 1.21791134226975 & -0.0241113422697514 \tabularnewline
39 & 1.202 & 1.16795749733533 & 0.0340425026646656 \tabularnewline
40 & 1.2271 & 1.16351928014674 & 0.0635807198532559 \tabularnewline
41 & 1.277 & 1.2154167509736 & 0.0615832490263963 \tabularnewline
42 & 1.265 & 1.27394815309733 & -0.00894815309732788 \tabularnewline
43 & 1.2684 & 1.29689170457694 & -0.028491704576936 \tabularnewline
44 & 1.2811 & 1.25947518295149 & 0.0216248170485138 \tabularnewline
45 & 1.2727 & 1.27267276620706 & 2.72337929385635e-05 \tabularnewline
46 & 1.2611 & 1.30481208770141 & -0.0437120877014137 \tabularnewline
47 & 1.2881 & 1.28140848405823 & 0.00669151594177042 \tabularnewline
48 & 1.3213 & 1.34022479608565 & -0.0189247960856469 \tabularnewline
49 & 1.2999 & 1.36263865759394 & -0.0627386575939433 \tabularnewline
50 & 1.3074 & 1.31286257378738 & -0.0054625737873808 \tabularnewline
51 & 1.3242 & 1.28703032940876 & 0.0371696705912405 \tabularnewline
52 & 1.3516 & 1.2893781323874 & 0.0622218676125967 \tabularnewline
53 & 1.3511 & 1.33982828000746 & 0.011271719992539 \tabularnewline
54 & 1.3419 & 1.34524699486894 & -0.00334699486893819 \tabularnewline
55 & 1.3716 & 1.37030828456802 & 0.00129171543198181 \tabularnewline
56 & 1.3622 & 1.36549202728323 & -0.00329202728323263 \tabularnewline
57 & 1.3896 & 1.35423259972997 & 0.0353674002700293 \tabularnewline
58 & 1.4227 & 1.41075681822749 & 0.0119431817725106 \tabularnewline
59 & 1.4684 & 1.44228094502328 & 0.0261190549767163 \tabularnewline
60 & 1.457 & 1.51428465038934 & -0.0572846503893354 \tabularnewline
\hline
\end{tabular}
%Source: https://freestatistics.org/blog/index.php?pk=148498&T=2

[TABLE]
[ROW][C]Interpolation Forecasts of Exponential Smoothing[/C][/ROW]
[ROW][C]t[/C][C]Observed[/C][C]Fitted[/C][C]Residuals[/C][/ROW]
[ROW][C]13[/C][C]1.2613[/C][C]1.21500972222222[/C][C]0.0462902777777783[/C][/ROW]
[ROW][C]14[/C][C]1.2646[/C][C]1.25828755948306[/C][C]0.00631244051693902[/C][/ROW]
[ROW][C]15[/C][C]1.2262[/C][C]1.22500088543094[/C][C]0.00119911456906041[/C][/ROW]
[ROW][C]16[/C][C]1.1985[/C][C]1.19900509289648[/C][C]-0.000505092896478043[/C][/ROW]
[ROW][C]17[/C][C]1.2007[/C][C]1.20022035178508[/C][C]0.000479648214922523[/C][/ROW]
[ROW][C]18[/C][C]1.2138[/C][C]1.21183393076726[/C][C]0.00196606923273923[/C][/ROW]
[ROW][C]19[/C][C]1.2266[/C][C]1.24453634290384[/C][C]-0.0179363429038391[/C][/ROW]
[ROW][C]20[/C][C]1.2176[/C][C]1.19783102170874[/C][C]0.0197689782912598[/C][/ROW]
[ROW][C]21[/C][C]1.2218[/C][C]1.21744085189493[/C][C]0.00435914810506777[/C][/ROW]
[ROW][C]22[/C][C]1.249[/C][C]1.26554231794596[/C][C]-0.0165423179459612[/C][/ROW]
[ROW][C]23[/C][C]1.2991[/C][C]1.25392956725818[/C][C]0.0451704327418216[/C][/ROW]
[ROW][C]24[/C][C]1.3408[/C][C]1.35563853044377[/C][C]-0.014838530443769[/C][/ROW]
[ROW][C]25[/C][C]1.3119[/C][C]1.38441051918731[/C][C]-0.0725105191873137[/C][/ROW]
[ROW][C]26[/C][C]1.3014[/C][C]1.31980729083747[/C][C]-0.0184072908374699[/C][/ROW]
[ROW][C]27[/C][C]1.3201[/C][C]1.26451705697116[/C][C]0.0555829430288362[/C][/ROW]
[ROW][C]28[/C][C]1.2938[/C][C]1.28513494208257[/C][C]0.00866505791743299[/C][/ROW]
[ROW][C]29[/C][C]1.2694[/C][C]1.2943863868171[/C][C]-0.024986386817097[/C][/ROW]
[ROW][C]30[/C][C]1.2165[/C][C]1.28426778674666[/C][C]-0.0677677867466608[/C][/ROW]
[ROW][C]31[/C][C]1.2037[/C][C]1.25413973731846[/C][C]-0.050439737318456[/C][/ROW]
[ROW][C]32[/C][C]1.2292[/C][C]1.18465737956276[/C][C]0.0445426204372443[/C][/ROW]
[ROW][C]33[/C][C]1.2256[/C][C]1.22347403831167[/C][C]0.00212596168833157[/C][/ROW]
[ROW][C]34[/C][C]1.2015[/C][C]1.2667561095719[/C][C]-0.0652561095718995[/C][/ROW]
[ROW][C]35[/C][C]1.1786[/C][C]1.22172749797515[/C][C]-0.0431274979751475[/C][/ROW]
[ROW][C]36[/C][C]1.1856[/C][C]1.23905753991633[/C][C]-0.0534575399163302[/C][/ROW]
[ROW][C]37[/C][C]1.2103[/C][C]1.22657101648504[/C][C]-0.0162710164850444[/C][/ROW]
[ROW][C]38[/C][C]1.1938[/C][C]1.21791134226975[/C][C]-0.0241113422697514[/C][/ROW]
[ROW][C]39[/C][C]1.202[/C][C]1.16795749733533[/C][C]0.0340425026646656[/C][/ROW]
[ROW][C]40[/C][C]1.2271[/C][C]1.16351928014674[/C][C]0.0635807198532559[/C][/ROW]
[ROW][C]41[/C][C]1.277[/C][C]1.2154167509736[/C][C]0.0615832490263963[/C][/ROW]
[ROW][C]42[/C][C]1.265[/C][C]1.27394815309733[/C][C]-0.00894815309732788[/C][/ROW]
[ROW][C]43[/C][C]1.2684[/C][C]1.29689170457694[/C][C]-0.028491704576936[/C][/ROW]
[ROW][C]44[/C][C]1.2811[/C][C]1.25947518295149[/C][C]0.0216248170485138[/C][/ROW]
[ROW][C]45[/C][C]1.2727[/C][C]1.27267276620706[/C][C]2.72337929385635e-05[/C][/ROW]
[ROW][C]46[/C][C]1.2611[/C][C]1.30481208770141[/C][C]-0.0437120877014137[/C][/ROW]
[ROW][C]47[/C][C]1.2881[/C][C]1.28140848405823[/C][C]0.00669151594177042[/C][/ROW]
[ROW][C]48[/C][C]1.3213[/C][C]1.34022479608565[/C][C]-0.0189247960856469[/C][/ROW]
[ROW][C]49[/C][C]1.2999[/C][C]1.36263865759394[/C][C]-0.0627386575939433[/C][/ROW]
[ROW][C]50[/C][C]1.3074[/C][C]1.31286257378738[/C][C]-0.0054625737873808[/C][/ROW]
[ROW][C]51[/C][C]1.3242[/C][C]1.28703032940876[/C][C]0.0371696705912405[/C][/ROW]
[ROW][C]52[/C][C]1.3516[/C][C]1.2893781323874[/C][C]0.0622218676125967[/C][/ROW]
[ROW][C]53[/C][C]1.3511[/C][C]1.33982828000746[/C][C]0.011271719992539[/C][/ROW]
[ROW][C]54[/C][C]1.3419[/C][C]1.34524699486894[/C][C]-0.00334699486893819[/C][/ROW]
[ROW][C]55[/C][C]1.3716[/C][C]1.37030828456802[/C][C]0.00129171543198181[/C][/ROW]
[ROW][C]56[/C][C]1.3622[/C][C]1.36549202728323[/C][C]-0.00329202728323263[/C][/ROW]
[ROW][C]57[/C][C]1.3896[/C][C]1.35423259972997[/C][C]0.0353674002700293[/C][/ROW]
[ROW][C]58[/C][C]1.4227[/C][C]1.41075681822749[/C][C]0.0119431817725106[/C][/ROW]
[ROW][C]59[/C][C]1.4684[/C][C]1.44228094502328[/C][C]0.0261190549767163[/C][/ROW]
[ROW][C]60[/C][C]1.457[/C][C]1.51428465038934[/C][C]-0.0572846503893354[/C][/ROW]
[/TABLE]
Source: https://freestatistics.org/blog/index.php?pk=148498&T=2

Globally Unique Identifier (entire table): ba.freestatistics.org/blog/index.php?pk=148498&T=2

As an alternative you can also use a QR Code:  

The GUIDs for individual cells are displayed in the table below:

Interpolation Forecasts of Exponential Smoothing
tObservedFittedResiduals
131.26131.215009722222220.0462902777777783
141.26461.258287559483060.00631244051693902
151.22621.225000885430940.00119911456906041
161.19851.19900509289648-0.000505092896478043
171.20071.200220351785080.000479648214922523
181.21381.211833930767260.00196606923273923
191.22661.24453634290384-0.0179363429038391
201.21761.197831021708740.0197689782912598
211.22181.217440851894930.00435914810506777
221.2491.26554231794596-0.0165423179459612
231.29911.253929567258180.0451704327418216
241.34081.35563853044377-0.014838530443769
251.31191.38441051918731-0.0725105191873137
261.30141.31980729083747-0.0184072908374699
271.32011.264517056971160.0555829430288362
281.29381.285134942082570.00866505791743299
291.26941.2943863868171-0.024986386817097
301.21651.28426778674666-0.0677677867466608
311.20371.25413973731846-0.050439737318456
321.22921.184657379562760.0445426204372443
331.22561.223474038311670.00212596168833157
341.20151.2667561095719-0.0652561095718995
351.17861.22172749797515-0.0431274979751475
361.18561.23905753991633-0.0534575399163302
371.21031.22657101648504-0.0162710164850444
381.19381.21791134226975-0.0241113422697514
391.2021.167957497335330.0340425026646656
401.22711.163519280146740.0635807198532559
411.2771.21541675097360.0615832490263963
421.2651.27394815309733-0.00894815309732788
431.26841.29689170457694-0.028491704576936
441.28111.259475182951490.0216248170485138
451.27271.272672766207062.72337929385635e-05
461.26111.30481208770141-0.0437120877014137
471.28811.281408484058230.00669151594177042
481.32131.34022479608565-0.0189247960856469
491.29991.36263865759394-0.0627386575939433
501.30741.31286257378738-0.0054625737873808
511.32421.287030329408760.0371696705912405
521.35161.28937813238740.0622218676125967
531.35111.339828280007460.011271719992539
541.34191.34524699486894-0.00334699486893819
551.37161.370308284568020.00129171543198181
561.36221.36549202728323-0.00329202728323263
571.38961.354232599729970.0353674002700293
581.42271.410756818227490.0119431817725106
591.46841.442280945023280.0261190549767163
601.4571.51428465038934-0.0572846503893354


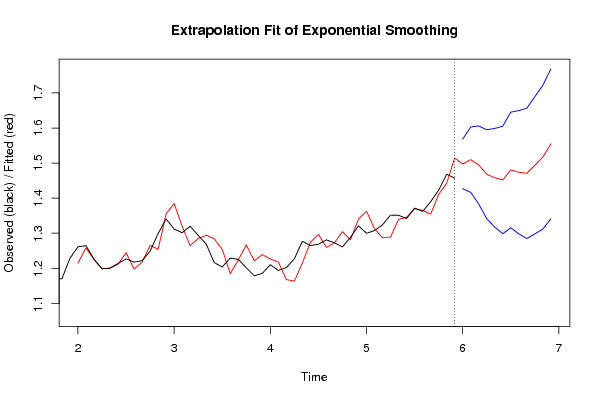
Extrapolation Forecasts of Exponential Smoothing
tForecast95% Lower Bound95% Upper Bound
611.497583087215681.42701176407261.56815441035877
621.509788903854061.416642186107791.60293562160033
631.494568530103631.383337642290751.60579941791651
641.468366563104361.341605726169681.59512740003904
651.458156369787331.317570776083291.59874196349137
661.451839689034971.298672105865891.60500727220405
671.480426921279611.315635210594291.64521863196493
681.473862887870891.298214639125471.64951113661631
691.470795107091191.284923359200151.65666685498224
701.493606472889111.298044958165971.68916798761225
711.516805818752041.312012495087551.72159914241652
721.554754545454551.341127990938761.76838109997033

\begin{tabular}{lllllllll}
\hline
Extrapolation Forecasts of Exponential Smoothing \tabularnewline
t & Forecast & 95% Lower Bound & 95% Upper Bound \tabularnewline
61 & 1.49758308721568 & 1.4270117640726 & 1.56815441035877 \tabularnewline
62 & 1.50978890385406 & 1.41664218610779 & 1.60293562160033 \tabularnewline
63 & 1.49456853010363 & 1.38333764229075 & 1.60579941791651 \tabularnewline
64 & 1.46836656310436 & 1.34160572616968 & 1.59512740003904 \tabularnewline
65 & 1.45815636978733 & 1.31757077608329 & 1.59874196349137 \tabularnewline
66 & 1.45183968903497 & 1.29867210586589 & 1.60500727220405 \tabularnewline
67 & 1.48042692127961 & 1.31563521059429 & 1.64521863196493 \tabularnewline
68 & 1.47386288787089 & 1.29821463912547 & 1.64951113661631 \tabularnewline
69 & 1.47079510709119 & 1.28492335920015 & 1.65666685498224 \tabularnewline
70 & 1.49360647288911 & 1.29804495816597 & 1.68916798761225 \tabularnewline
71 & 1.51680581875204 & 1.31201249508755 & 1.72159914241652 \tabularnewline
72 & 1.55475454545455 & 1.34112799093876 & 1.76838109997033 \tabularnewline
\hline
\end{tabular}
%Source: https://freestatistics.org/blog/index.php?pk=148498&T=3

[TABLE]
[ROW][C]Extrapolation Forecasts of Exponential Smoothing[/C][/ROW]
[ROW][C]t[/C][C]Forecast[/C][C]95% Lower Bound[/C][C]95% Upper Bound[/C][/ROW]
[ROW][C]61[/C][C]1.49758308721568[/C][C]1.4270117640726[/C][C]1.56815441035877[/C][/ROW]
[ROW][C]62[/C][C]1.50978890385406[/C][C]1.41664218610779[/C][C]1.60293562160033[/C][/ROW]
[ROW][C]63[/C][C]1.49456853010363[/C][C]1.38333764229075[/C][C]1.60579941791651[/C][/ROW]
[ROW][C]64[/C][C]1.46836656310436[/C][C]1.34160572616968[/C][C]1.59512740003904[/C][/ROW]
[ROW][C]65[/C][C]1.45815636978733[/C][C]1.31757077608329[/C][C]1.59874196349137[/C][/ROW]
[ROW][C]66[/C][C]1.45183968903497[/C][C]1.29867210586589[/C][C]1.60500727220405[/C][/ROW]
[ROW][C]67[/C][C]1.48042692127961[/C][C]1.31563521059429[/C][C]1.64521863196493[/C][/ROW]
[ROW][C]68[/C][C]1.47386288787089[/C][C]1.29821463912547[/C][C]1.64951113661631[/C][/ROW]
[ROW][C]69[/C][C]1.47079510709119[/C][C]1.28492335920015[/C][C]1.65666685498224[/C][/ROW]
[ROW][C]70[/C][C]1.49360647288911[/C][C]1.29804495816597[/C][C]1.68916798761225[/C][/ROW]
[ROW][C]71[/C][C]1.51680581875204[/C][C]1.31201249508755[/C][C]1.72159914241652[/C][/ROW]
[ROW][C]72[/C][C]1.55475454545455[/C][C]1.34112799093876[/C][C]1.76838109997033[/C][/ROW]
[/TABLE]
Source: https://freestatistics.org/blog/index.php?pk=148498&T=3

Globally Unique Identifier (entire table): ba.freestatistics.org/blog/index.php?pk=148498&T=3

As an alternative you can also use a QR Code:  

The GUIDs for individual cells are displayed in the table below:

Extrapolation Forecasts of Exponential Smoothing
tForecast95% Lower Bound95% Upper Bound
611.497583087215681.42701176407261.56815441035877
621.509788903854061.416642186107791.60293562160033
631.494568530103631.383337642290751.60579941791651
641.468366563104361.341605726169681.59512740003904
651.458156369787331.317570776083291.59874196349137
661.451839689034971.298672105865891.60500727220405
671.480426921279611.315635210594291.64521863196493
681.473862887870891.298214639125471.64951113661631
691.470795107091191.284923359200151.65666685498224
701.493606472889111.298044958165971.68916798761225
711.516805818752041.312012495087551.72159914241652
721.554754545454551.341127990938761.76838109997033


Parameters (Session):
par1 = 12 ; par2 = Triple ; par3 = additive ;
Parameters (R input):
par1 = 12 ; par2 = Triple ; par3 = additive ;
R code (references can be found in the software module):
par1 <- as.numeric(par1)
if (par2 == 'Single') K <- 1
if (par2 == 'Double') K <- 2
if (par2 == 'Triple') K <- par1
nx <- length(x)
nxmK <- nx - K
x <- ts(x, frequency = par1)
if (par2 == 'Single') fit <- HoltWinters(x, gamma=F, beta=F)
if (par2 == 'Double') fit <- HoltWinters(x, gamma=F)
if (par2 == 'Triple') fit <- HoltWinters(x, seasonal=par3)
fit
myresid <- x - fit$fitted[,'xhat']
bitmap(file='test1.png')
op <- par(mfrow=c(2,1))
plot(fit,ylab='Observed (black) / Fitted (red)',main='Interpolation Fit of Exponential Smoothing')
plot(myresid,ylab='Residuals',main='Interpolation Prediction Errors')
par(op)
dev.off()
bitmap(file='test2.png')
p <- predict(fit, par1, prediction.interval=TRUE)
np <- length(p[,1])
plot(fit,p,ylab='Observed (black) / Fitted (red)',main='Extrapolation Fit of Exponential Smoothing')
dev.off()
bitmap(file='test3.png')
op <- par(mfrow = c(2,2))
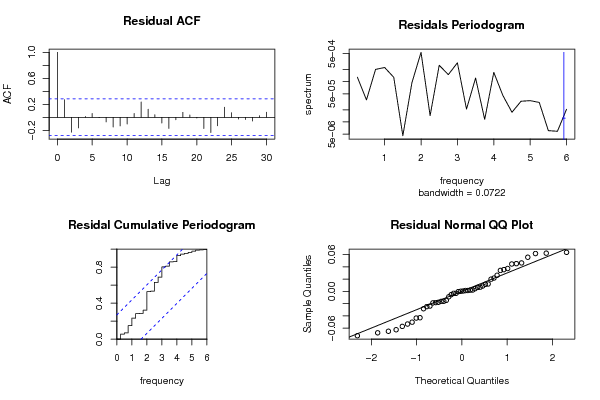
acf(as.numeric(myresid),lag.max = nx/2,main='Residual ACF')
spectrum(myresid,main='Residals Periodogram')
cpgram(myresid,main='Residal Cumulative Periodogram')
qqnorm(myresid,main='Residual Normal QQ Plot')
qqline(myresid)
par(op)
dev.off()
load(file='createtable')
a<-table.start()
a<-table.row.start(a)
a<-table.element(a,'Estimated Parameters of Exponential Smoothing',2,TRUE)
a<-table.row.end(a)
a<-table.row.start(a)
a<-table.element(a,'Parameter',header=TRUE)
a<-table.element(a,'Value',header=TRUE)
a<-table.row.end(a)
a<-table.row.start(a)
a<-table.element(a,'alpha',header=TRUE)
a<-table.element(a,fit$alpha)
a<-table.row.end(a)
a<-table.row.start(a)
a<-table.element(a,'beta',header=TRUE)
a<-table.element(a,fit$beta)
a<-table.row.end(a)
a<-table.row.start(a)
a<-table.element(a,'gamma',header=TRUE)
a<-table.element(a,fit$gamma)
a<-table.row.end(a)
a<-table.end(a)
table.save(a,file='mytable.tab')
a<-table.start()
a<-table.row.start(a)
a<-table.element(a,'Interpolation Forecasts of Exponential Smoothing',4,TRUE)
a<-table.row.end(a)
a<-table.row.start(a)
a<-table.element(a,'t',header=TRUE)
a<-table.element(a,'Observed',header=TRUE)
a<-table.element(a,'Fitted',header=TRUE)
a<-table.element(a,'Residuals',header=TRUE)
a<-table.row.end(a)
for (i in 1:nxmK) {
a<-table.row.start(a)
a<-table.element(a,i+K,header=TRUE)
a<-table.element(a,x[i+K])
a<-table.element(a,fit$fitted[i,'xhat'])
a<-table.element(a,myresid[i])
a<-table.row.end(a)
}
a<-table.end(a)
table.save(a,file='mytable1.tab')
a<-table.start()
a<-table.row.start(a)
a<-table.element(a,'Extrapolation Forecasts of Exponential Smoothing',4,TRUE)
a<-table.row.end(a)
a<-table.row.start(a)
a<-table.element(a,'t',header=TRUE)
a<-table.element(a,'Forecast',header=TRUE)
a<-table.element(a,'95% Lower Bound',header=TRUE)
a<-table.element(a,'95% Upper Bound',header=TRUE)
a<-table.row.end(a)
for (i in 1:np) {
a<-table.row.start(a)
a<-table.element(a,nx+i,header=TRUE)
a<-table.element(a,p[i,'fit'])
a<-table.element(a,p[i,'lwr'])
a<-table.element(a,p[i,'upr'])
a<-table.row.end(a)
}
a<-table.end(a)
table.save(a,file='mytable2.tab')