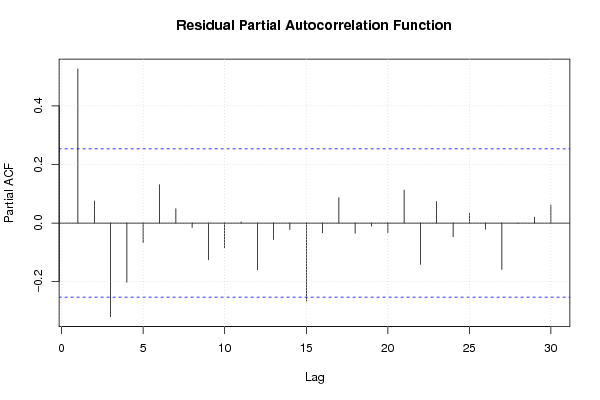
| Multiple Linear Regression - Estimated Regression Equation |
| Bouwvergunningen[t] = + 2245.875 + 371.577083333334M1[t] + 198.179166666667M2[t] + 523.78125M3[t] + 470.383333333334M4[t] + 414.785416666667M5[t] + 765.1875M6[t] + 284.389583333334M7[t] + 99.591666666667M8[t] + 38.1937500000003M9[t] + 148.995833333334M10[t] -148.202083333333M11[t] -7.20208333333333t + e[t] |
| Multiple Linear Regression - Ordinary Least Squares | |||||
| Variable | Parameter | S.D. | T-STAT H0: parameter = 0 | 2-tail p-value | 1-tail p-value |
| (Intercept) | 2245.875 | 209.629019 | 10.7136 | 0 | 0 |
| M1 | 371.577083333334 | 255.025433 | 1.457 | 0.15176 | 0.07588 |
| M2 | 198.179166666667 | 254.644406 | 0.7783 | 0.440317 | 0.220159 |
| M3 | 523.78125 | 254.299174 | 2.0597 | 0.044989 | 0.022495 |
| M4 | 470.383333333334 | 253.989885 | 1.852 | 0.070316 | 0.035158 |
| M5 | 414.785416666667 | 253.71667 | 1.6348 | 0.108764 | 0.054382 |
| M6 | 765.1875 | 253.479645 | 3.0187 | 0.004093 | 0.002046 |
| M7 | 284.389583333334 | 253.278913 | 1.1228 | 0.267212 | 0.133606 |
| M8 | 99.591666666667 | 253.114558 | 0.3935 | 0.695756 | 0.347878 |
| M9 | 38.1937500000003 | 252.986653 | 0.151 | 0.880644 | 0.440322 |
| M10 | 148.995833333334 | 252.895253 | 0.5892 | 0.558575 | 0.279288 |
| M11 | -148.202083333333 | 252.840397 | -0.5861 | 0.56058 | 0.28029 |
| t | -7.20208333333333 | 3.040977 | -2.3683 | 0.022032 | 0.011016 |
| Multiple Linear Regression - Regression Statistics | |
| Multiple R | 0.634916141943439 |
| R-squared | 0.403118507300341 |
| Adjusted R-squared | 0.250723232568513 |
| F-TEST (value) | 2.64521657912107 |
| F-TEST (DF numerator) | 12 |
| F-TEST (DF denominator) | 47 |
| p-value | 0.00863128557344173 |
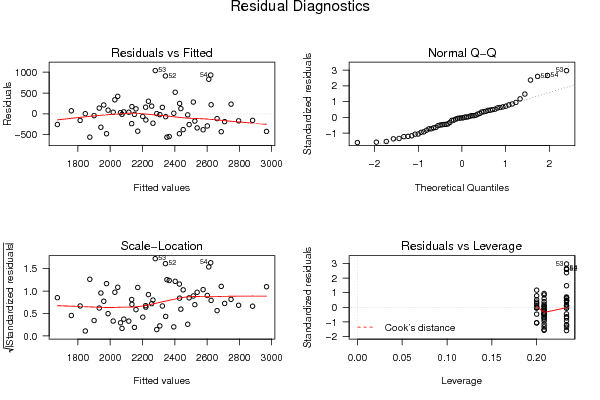
| Multiple Linear Regression - Residual Statistics | |
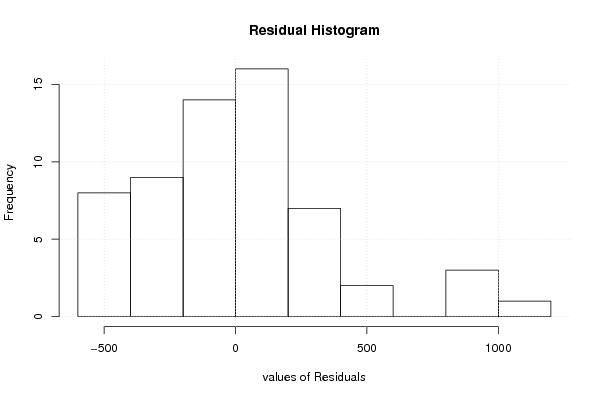
| Residual Standard Deviation | 399.746854071956 |
| Sum Squared Residuals | 7510484.725 |
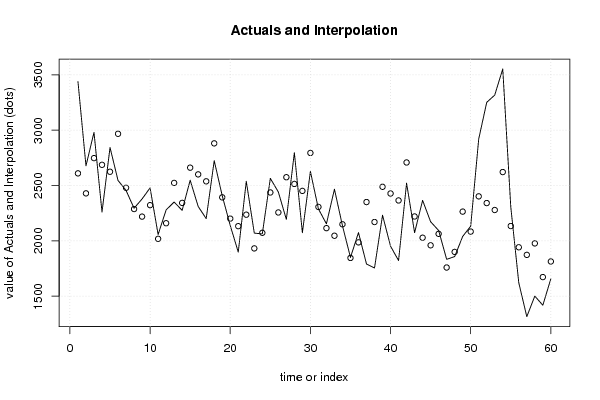
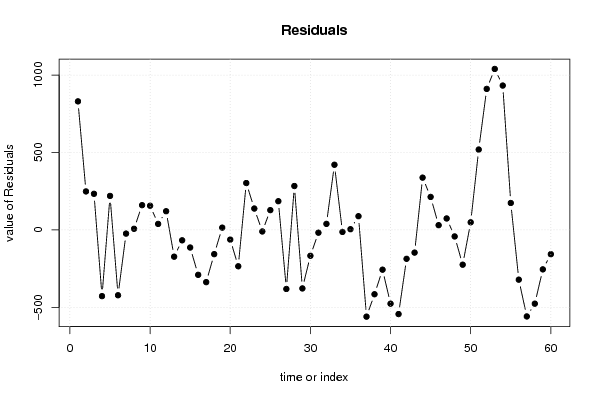
| Multiple Linear Regression - Actuals, Interpolation, and Residuals | |||
| Time or Index | Actuals | Interpolation Forecast | Residuals Prediction Error |
| 1 | 3440 | 2610.25 | 829.750000000003 |
| 2 | 2678 | 2429.65 | 248.35 |
| 3 | 2981 | 2748.05 | 232.95 |
| 4 | 2260 | 2687.45 | -427.45 |
| 5 | 2844 | 2624.65 | 219.35 |
| 6 | 2546 | 2967.85 | -421.85 |
| 7 | 2456 | 2479.85 | -23.85 |
| 8 | 2295 | 2287.85 | 7.15000000000001 |
| 9 | 2379 | 2219.25 | 159.75 |
| 10 | 2479 | 2322.85 | 156.15 |
| 11 | 2057 | 2018.45 | 38.5499999999999 |
| 12 | 2280 | 2159.45 | 120.55 |
| 13 | 2351 | 2523.825 | -172.825000000001 |
| 14 | 2276 | 2343.225 | -67.225 |
| 15 | 2548 | 2661.625 | -113.625 |
| 16 | 2311 | 2601.025 | -290.025 |
| 17 | 2201 | 2538.225 | -337.225 |
| 18 | 2725 | 2881.425 | -156.425 |
| 19 | 2408 | 2393.425 | 14.575 |
| 20 | 2139 | 2201.425 | -62.425 |
| 21 | 1898 | 2132.825 | -234.825 |
| 22 | 2539 | 2236.425 | 302.575 |
| 23 | 2070 | 1932.025 | 137.975 |
| 24 | 2063 | 2073.025 | -10.0249999999997 |
| 25 | 2565 | 2437.4 | 127.599999999999 |
| 26 | 2442 | 2256.8 | 185.2 |
| 27 | 2194 | 2575.2 | -381.2 |
| 28 | 2798 | 2514.6 | 283.4 |
| 29 | 2074 | 2451.8 | -377.8 |
| 30 | 2628 | 2795 | -167 |
| 31 | 2289 | 2307 | -18 |
| 32 | 2154 | 2115 | 39 |
| 33 | 2467 | 2046.4 | 420.6 |
| 34 | 2137 | 2150 | -13 |
| 35 | 1850 | 1845.6 | 4.40000000000007 |
| 36 | 2075 | 1986.6 | 88.4000000000003 |
| 37 | 1791 | 2350.975 | -559.975000000001 |
| 38 | 1755 | 2170.375 | -415.375 |
| 39 | 2232 | 2488.775 | -256.775 |
| 40 | 1952 | 2428.175 | -476.175 |
| 41 | 1822 | 2365.375 | -543.375 |
| 42 | 2522 | 2708.575 | -186.575 |
| 43 | 2074 | 2220.575 | -146.575 |
| 44 | 2366 | 2028.575 | 337.425 |
| 45 | 2173 | 1959.975 | 213.025 |
| 46 | 2094 | 2063.575 | 30.425 |
| 47 | 1833 | 1759.175 | 73.8250000000001 |
| 48 | 1858 | 1900.175 | -42.1749999999996 |
| 49 | 2040 | 2264.55 | -224.550000000001 |
| 50 | 2133 | 2083.95 | 49.05 |
| 51 | 2921 | 2402.35 | 518.65 |
| 52 | 3252 | 2341.75 | 910.25 |
| 53 | 3318 | 2278.95 | 1039.05 |
| 54 | 3554 | 2622.15 | 931.85 |
| 55 | 2308 | 2134.15 | 173.85 |
| 56 | 1621 | 1942.15 | -321.15 |
| 57 | 1315 | 1873.55 | -558.55 |
| 58 | 1501 | 1977.15 | -476.15 |
| 59 | 1418 | 1672.75 | -254.75 |
| 60 | 1657 | 1813.75 | -156.75 |
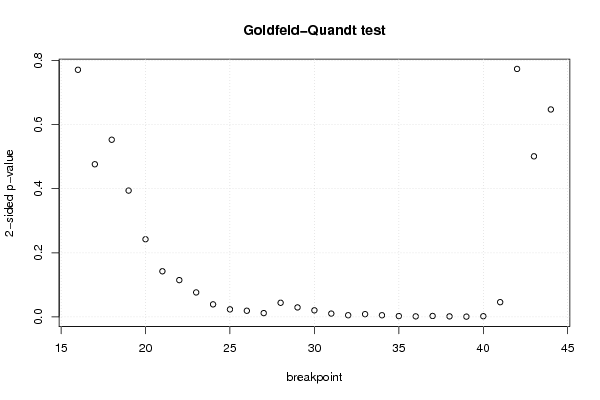
| Goldfeld-Quandt test for Heteroskedasticity | |||
| p-values | Alternative Hypothesis | ||
| breakpoint index | greater | 2-sided | less |
| 16 | 0.385296355924881 | 0.770592711849762 | 0.614703644075119 |
| 17 | 0.238048352814536 | 0.476096705629072 | 0.761951647185464 |
| 18 | 0.276264302319065 | 0.552528604638129 | 0.723735697680935 |
| 19 | 0.196980964346242 | 0.393961928692483 | 0.803019035653758 |
| 20 | 0.121147795243511 | 0.242295590487022 | 0.878852204756489 |
| 21 | 0.071240809121987 | 0.142481618243974 | 0.928759190878013 |
| 22 | 0.0574617920578669 | 0.114923584115734 | 0.942538207942133 |
| 23 | 0.0382560681623928 | 0.0765121363247855 | 0.961743931837607 |
| 24 | 0.0196789973091712 | 0.0393579946183423 | 0.980321002690829 |
| 25 | 0.0118822464178895 | 0.0237644928357789 | 0.988117753582111 |
| 26 | 0.00968842390974589 | 0.0193768478194918 | 0.990311576090254 |
| 27 | 0.00602935679993665 | 0.0120587135998733 | 0.993970643200063 |
| 28 | 0.0221230907868699 | 0.0442461815737399 | 0.97787690921313 |
| 29 | 0.01489372579416 | 0.02978745158832 | 0.98510627420584 |
| 30 | 0.0103591096208931 | 0.0207182192417863 | 0.989640890379107 |
| 31 | 0.00526335499197258 | 0.0105267099839452 | 0.994736645008027 |
| 32 | 0.00270216233531667 | 0.00540432467063333 | 0.997297837664683 |
| 33 | 0.00438204332228645 | 0.00876408664457291 | 0.995617956677714 |
| 34 | 0.00269613317247098 | 0.00539226634494196 | 0.997303866827529 |
| 35 | 0.00142096212076394 | 0.00284192424152788 | 0.998579037879236 |
| 36 | 0.000928603260849235 | 0.00185720652169847 | 0.999071396739151 |
| 37 | 0.00157758756791924 | 0.00315517513583849 | 0.998422412432081 |
| 38 | 0.000942536720549036 | 0.00188507344109807 | 0.999057463279451 |
| 39 | 0.000496542169010941 | 0.000993084338021882 | 0.999503457830989 |
| 40 | 0.00116562667238522 | 0.00233125334477044 | 0.998834373327615 |
| 41 | 0.0230665540230755 | 0.046133108046151 | 0.976933445976925 |
| 42 | 0.386604374989549 | 0.773208749979099 | 0.613395625010451 |
| 43 | 0.749575561716544 | 0.500848876566913 | 0.250424438283456 |
| 44 | 0.676572921344143 | 0.646854157311714 | 0.323427078655857 |
| Meta Analysis of Goldfeld-Quandt test for Heteroskedasticity | |||
| Description | # significant tests | % significant tests | OK/NOK |
| 1% type I error level | 9 | 0.310344827586207 | NOK |
| 5% type I error level | 18 | 0.620689655172414 | NOK |
| 10% type I error level | 19 | 0.655172413793103 | NOK |