| Multiple Linear Regression - Estimated Regression Equation |
| MaandelijkseSterfgevallenInOntario[t] = + 110.875 -44.2895833333333M1[t] -52.3541666666667M2[t] -47.21875M3[t] -36.6833333333333M4[t] -20.9479166666667M5[t] -15.6125M6[t] + 5.92291666666666M7[t] + 22.6583333333333M8[t] + 9.79375M9[t] + 11.3291666666667M10[t] -0.735416666666673M11[t] + 0.464583333333333t + e[t] |
| Multiple Linear Regression - Ordinary Least Squares | |||||
| Variable | Parameter | S.D. | T-STAT H0: parameter = 0 | 2-tail p-value | 1-tail p-value |
| (Intercept) | 110.875 | 7.542277 | 14.7005 | 0 | 0 |
| M1 | -44.2895833333333 | 9.175602 | -4.8269 | 1.5e-05 | 8e-06 |
| M2 | -52.3541666666667 | 9.161893 | -5.7143 | 1e-06 | 0 |
| M3 | -47.21875 | 9.149472 | -5.1608 | 5e-06 | 2e-06 |
| M4 | -36.6833333333333 | 9.138344 | -4.0142 | 0.000213 | 0.000107 |
| M5 | -20.9479166666667 | 9.128514 | -2.2948 | 0.026257 | 0.013129 |
| M6 | -15.6125 | 9.119986 | -1.7119 | 0.093507 | 0.046754 |
| M7 | 5.92291666666666 | 9.112764 | 0.65 | 0.518884 | 0.259442 |
| M8 | 22.6583333333333 | 9.106851 | 2.4881 | 0.016447 | 0.008224 |
| M9 | 9.79375 | 9.102249 | 1.076 | 0.287433 | 0.143716 |
| M10 | 11.3291666666667 | 9.09896 | 1.2451 | 0.219265 | 0.109633 |
| M11 | -0.735416666666673 | 9.096986 | -0.0808 | 0.935911 | 0.467956 |
| t | 0.464583333333333 | 0.109412 | 4.2462 | 0.000102 | 5.1e-05 |
| Multiple Linear Regression - Regression Statistics | |
| Multiple R | 0.906520018393706 |
| R-squared | 0.821778543748526 |
| Adjusted R-squared | 0.776275193216235 |
| F-TEST (value) | 18.0597370113516 |
| F-TEST (DF numerator) | 12 |
| F-TEST (DF denominator) | 47 |
| p-value | 1.0591527654924e-13 |
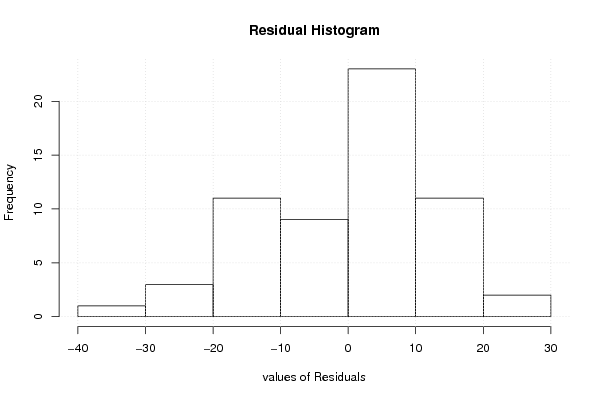
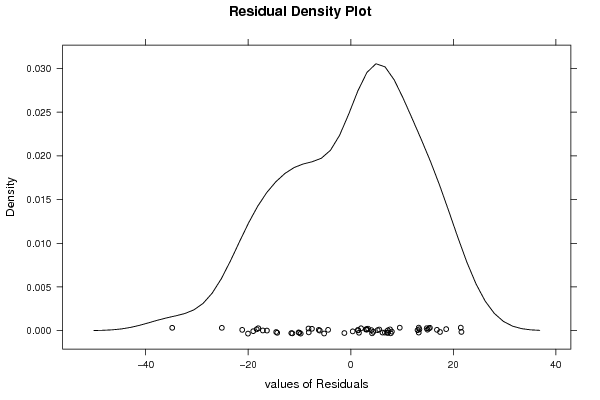
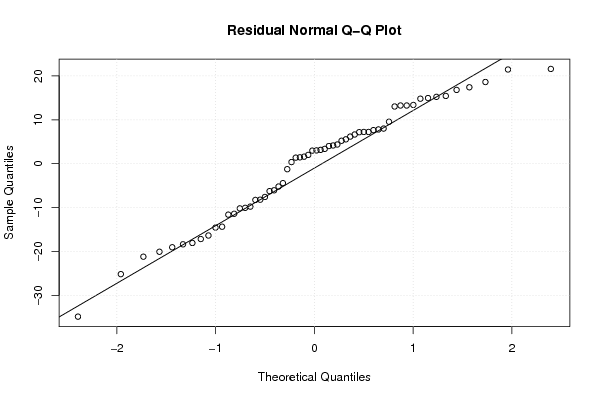
| Multiple Linear Regression - Residual Statistics | |
| Residual Standard Deviation | 14.3825581425352 |
| Sum Squared Residuals | 9722.325 |
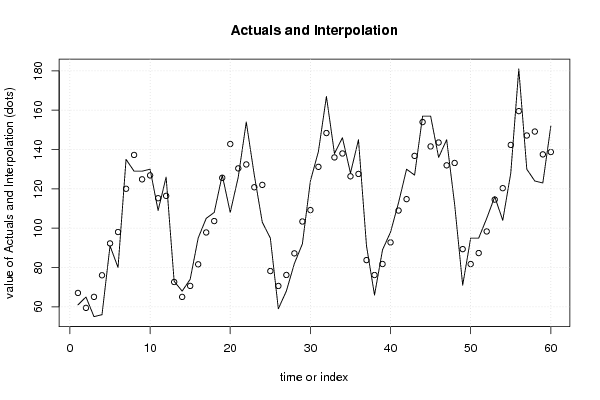
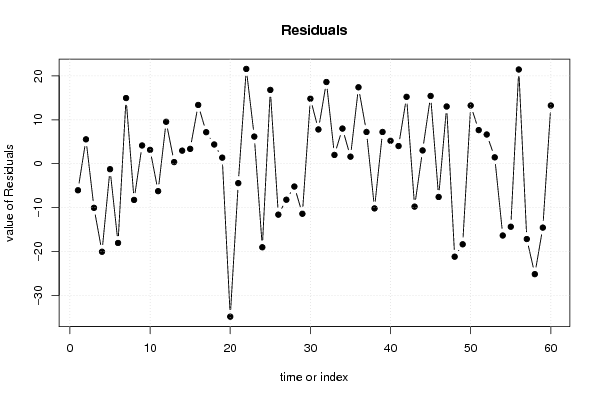
| Multiple Linear Regression - Actuals, Interpolation, and Residuals | |||
| Time or Index | Actuals | Interpolation Forecast | Residuals Prediction Error |
| 1 | 61 | 67.0499999999998 | -6.04999999999979 |
| 2 | 65 | 59.45 | 5.54999999999999 |
| 3 | 55 | 65.05 | -10.05 |
| 4 | 56 | 76.05 | -20.05 |
| 5 | 91 | 92.25 | -1.25 |
| 6 | 80 | 98.05 | -18.05 |
| 7 | 135 | 120.05 | 14.95 |
| 8 | 129 | 137.25 | -8.25 |
| 9 | 129 | 124.85 | 4.14999999999998 |
| 10 | 130 | 126.85 | 3.14999999999999 |
| 11 | 109 | 115.25 | -6.25 |
| 12 | 126 | 116.45 | 9.54999999999999 |
| 13 | 73 | 72.625 | 0.37499999999994 |
| 14 | 68 | 65.025 | 2.97499999999999 |
| 15 | 74 | 70.625 | 3.375 |
| 16 | 95 | 81.625 | 13.375 |
| 17 | 105 | 97.825 | 7.175 |
| 18 | 108 | 103.625 | 4.375 |
| 19 | 127 | 125.625 | 1.375 |
| 20 | 108 | 142.825 | -34.825 |
| 21 | 126 | 130.425 | -4.425 |
| 22 | 154 | 132.425 | 21.575 |
| 23 | 127 | 120.825 | 6.175 |
| 24 | 103 | 122.025 | -19.025 |
| 25 | 95 | 78.2 | 16.7999999999999 |
| 26 | 59 | 70.6 | -11.6 |
| 27 | 68 | 76.2 | -8.2 |
| 28 | 82 | 87.2 | -5.2 |
| 29 | 92 | 103.4 | -11.4 |
| 30 | 124 | 109.2 | 14.8 |
| 31 | 139 | 131.2 | 7.8 |
| 32 | 167 | 148.4 | 18.6 |
| 33 | 138 | 136 | 2 |
| 34 | 146 | 138 | 8 |
| 35 | 128 | 126.4 | 1.6 |
| 36 | 145 | 127.6 | 17.4 |
| 37 | 91 | 83.775 | 7.22499999999996 |
| 38 | 66 | 76.175 | -10.175 |
| 39 | 89 | 81.775 | 7.225 |
| 40 | 98 | 92.775 | 5.22500000000001 |
| 41 | 113 | 108.975 | 4.02500000000001 |
| 42 | 130 | 114.775 | 15.225 |
| 43 | 127 | 136.775 | -9.775 |
| 44 | 157 | 153.975 | 3.025 |
| 45 | 157 | 141.575 | 15.425 |
| 46 | 136 | 143.575 | -7.575 |
| 47 | 145 | 131.975 | 13.025 |
| 48 | 112 | 133.175 | -21.175 |
| 49 | 71 | 89.35 | -18.35 |
| 50 | 95 | 81.75 | 13.25 |
| 51 | 95 | 87.35 | 7.65000000000001 |
| 52 | 105 | 98.35 | 6.65000000000001 |
| 53 | 116 | 114.55 | 1.45000000000001 |
| 54 | 104 | 120.35 | -16.35 |
| 55 | 128 | 142.35 | -14.35 |
| 56 | 181 | 159.55 | 21.45 |
| 57 | 130 | 147.15 | -17.15 |
| 58 | 124 | 149.15 | -25.15 |
| 59 | 123 | 137.55 | -14.55 |
| 60 | 152 | 138.75 | 13.25 |
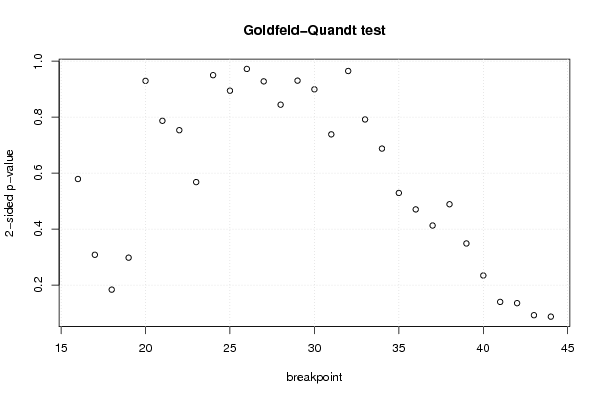
| Goldfeld-Quandt test for Heteroskedasticity | |||
| p-values | Alternative Hypothesis | ||
| breakpoint index | greater | 2-sided | less |
| 16 | 0.289493636391056 | 0.578987272782111 | 0.710506363608944 |
| 17 | 0.154085620002091 | 0.308171240004182 | 0.845914379997909 |
| 18 | 0.091789351304218 | 0.183578702608436 | 0.908210648695782 |
| 19 | 0.148933036061173 | 0.297866072122346 | 0.851066963938827 |
| 20 | 0.464848000030418 | 0.929696000060837 | 0.535151999969582 |
| 21 | 0.393494238525783 | 0.786988477051567 | 0.606505761474217 |
| 22 | 0.376708749958213 | 0.753417499916427 | 0.623291250041787 |
| 23 | 0.284000681753404 | 0.568001363506809 | 0.715999318246596 |
| 24 | 0.474996756111594 | 0.949993512223189 | 0.525003243888405 |
| 25 | 0.447271117346286 | 0.894542234692573 | 0.552728882653714 |
| 26 | 0.486137269639243 | 0.972274539278487 | 0.513862730360757 |
| 27 | 0.46394898413771 | 0.92789796827542 | 0.53605101586229 |
| 28 | 0.422257004251604 | 0.844514008503208 | 0.577742995748396 |
| 29 | 0.46519883185615 | 0.9303976637123 | 0.53480116814385 |
| 30 | 0.449676493651399 | 0.899352987302798 | 0.550323506348601 |
| 31 | 0.369277929890921 | 0.738555859781841 | 0.630722070109079 |
| 32 | 0.482475603125155 | 0.96495120625031 | 0.517524396874845 |
| 33 | 0.395910144380112 | 0.791820288760223 | 0.604089855619888 |
| 34 | 0.343853754562446 | 0.687707509124892 | 0.656146245437554 |
| 35 | 0.26454827961991 | 0.529096559239819 | 0.73545172038009 |
| 36 | 0.235188971170885 | 0.470377942341771 | 0.764811028829115 |
| 37 | 0.206396157769414 | 0.412792315538828 | 0.793603842230586 |
| 38 | 0.244419302751182 | 0.488838605502365 | 0.755580697248818 |
| 39 | 0.174344093918252 | 0.348688187836503 | 0.825655906081748 |
| 40 | 0.117083790578556 | 0.234167581157112 | 0.882916209421444 |
| 41 | 0.0698884219237928 | 0.139776843847586 | 0.930111578076207 |
| 42 | 0.0676672402627455 | 0.135334480525491 | 0.932332759737254 |
| 43 | 0.0461552306263695 | 0.092310461252739 | 0.95384476937363 |
| 44 | 0.0435652378862557 | 0.0871304757725114 | 0.956434762113744 |
| Meta Analysis of Goldfeld-Quandt test for Heteroskedasticity | |||
| Description | # significant tests | % significant tests | OK/NOK |
| 1% type I error level | 0 | 0 | OK |
| 5% type I error level | 0 | 0 | OK |
| 10% type I error level | 2 | 0.0689655172413793 | OK |