Free Statistics

of Irreproducible Research!

Author's title

Author*The author of this computation has been verified*
R Software Modulerwasp_multipleregression.wasp
Title produced by softwareMultiple Regression
Date of computationTue, 29 Nov 2011 06:56:03 -0500
Cite this page as followsStatistical Computations at FreeStatistics.org, Office for Research Development and Education, URL https://freestatistics.org/blog/index.php?v=date/2011/Nov/29/t1322569470lnpfese2fjm9qyl.htm/, Retrieved Fri, 26 Apr 2024 17:18:14 +0000
Statistical Computations at FreeStatistics.org, Office for Research Development and Education, URL https://freestatistics.org/blog/index.php?pk=148250, Retrieved Fri, 26 Apr 2024 17:18:14 +0000
QR Codes:

Original text written by user:
IsPrivate?No (this computation is public)
User-defined keywords
Estimated Impact136
Family? (F = Feedback message, R = changed R code, M = changed R Module, P = changed Parameters, D = changed Data)
-     [Multiple Regression] [HPC Retail Sales] [2008-03-08 13:40:54] [1c0f2c85e8a48e42648374b3bcceca26]
- RMPD  [Multiple Regression] [WS8 - Multiple Re...] [2010-11-29 21:09:57] [1f5baf2b24e732d76900bb8178fc04e7]
-         [Multiple Regression] [WS8 Multiple Regr...] [2010-11-30 10:52:15] [afe9379cca749d06b3d6872e02cc47ed]
- R  D        [Multiple Regression] [] [2011-11-29 11:56:03] [fe5ec8748c528a1557751a5a0f6a19ab] [Current]
-  M            [Multiple Regression] [] [2011-12-22 18:28:45] [bdca8f3e7c3554be8c1291e54f61d441]
-  M            [Multiple Regression] [] [2012-11-27 20:50:17] [74be16979710d4c4e7c6647856088456]
-  M            [Multiple Regression] [] [2012-11-27 20:51:46] [74be16979710d4c4e7c6647856088456]
-  M            [Multiple Regression] [] [2012-11-27 20:53:02] [74be16979710d4c4e7c6647856088456]
-  M            [Multiple Regression] [] [2012-11-27 20:54:09] [74be16979710d4c4e7c6647856088456]
Feedback Forum

Post a new message
Dataseries X:
61
65
55
56
91
80
135
129
129
130
109
126
73
68
74
95
105
108
127
108
126
154
127
103
95
59
68
82
92
124
139
167
138
146
128
145
91
66
89
98
113
130
127
157
157
136
145
112
71
95
95
105
116
104
128
181
130
124
123
152


Summary of computational transaction
Raw Inputview raw input (R code)
Raw Outputview raw output of R engine
Computing time5 seconds
R Server'George Udny Yule' @ yule.wessa.net

\begin{tabular}{lllllllll}
\hline
Summary of computational transaction \tabularnewline
Raw Input & view raw input (R code)  \tabularnewline
Raw Output & view raw output of R engine  \tabularnewline
Computing time & 5 seconds \tabularnewline
R Server & 'George Udny Yule' @ yule.wessa.net \tabularnewline
\hline
\end{tabular}
%Source: https://freestatistics.org/blog/index.php?pk=148250&T=0

[TABLE]
[ROW][C]Summary of computational transaction[/C][/ROW]
[ROW][C]Raw Input[/C][C]view raw input (R code) [/C][/ROW]
[ROW][C]Raw Output[/C][C]view raw output of R engine [/C][/ROW]
[ROW][C]Computing time[/C][C]5 seconds[/C][/ROW]
[ROW][C]R Server[/C][C]'George Udny Yule' @ yule.wessa.net[/C][/ROW]
[/TABLE]
Source: https://freestatistics.org/blog/index.php?pk=148250&T=0

Globally Unique Identifier (entire table): ba.freestatistics.org/blog/index.php?pk=148250&T=0

As an alternative you can also use a QR Code:  

The GUIDs for individual cells are displayed in the table below:

Summary of computational transaction
Raw Inputview raw input (R code)
Raw Outputview raw output of R engine
Computing time5 seconds
R Server'George Udny Yule' @ yule.wessa.net


Multiple Linear Regression - Estimated Regression Equation
MaandelijkseSterfgevallenInOntario[t] = + 110.875 -44.2895833333333M1[t] -52.3541666666667M2[t] -47.21875M3[t] -36.6833333333333M4[t] -20.9479166666667M5[t] -15.6125M6[t] + 5.92291666666666M7[t] + 22.6583333333333M8[t] + 9.79375M9[t] + 11.3291666666667M10[t] -0.735416666666673M11[t] + 0.464583333333333t + e[t]

\begin{tabular}{lllllllll}
\hline
Multiple Linear Regression - Estimated Regression Equation \tabularnewline
MaandelijkseSterfgevallenInOntario[t] =  +  110.875 -44.2895833333333M1[t] -52.3541666666667M2[t] -47.21875M3[t] -36.6833333333333M4[t] -20.9479166666667M5[t] -15.6125M6[t] +  5.92291666666666M7[t] +  22.6583333333333M8[t] +  9.79375M9[t] +  11.3291666666667M10[t] -0.735416666666673M11[t] +  0.464583333333333t  + e[t] \tabularnewline
\hline
\end{tabular}
%Source: https://freestatistics.org/blog/index.php?pk=148250&T=1

[TABLE]
[ROW][C]Multiple Linear Regression - Estimated Regression Equation[/C][/ROW]
[ROW][C]MaandelijkseSterfgevallenInOntario[t] =  +  110.875 -44.2895833333333M1[t] -52.3541666666667M2[t] -47.21875M3[t] -36.6833333333333M4[t] -20.9479166666667M5[t] -15.6125M6[t] +  5.92291666666666M7[t] +  22.6583333333333M8[t] +  9.79375M9[t] +  11.3291666666667M10[t] -0.735416666666673M11[t] +  0.464583333333333t  + e[t][/C][/ROW]
[/TABLE]
Source: https://freestatistics.org/blog/index.php?pk=148250&T=1

Globally Unique Identifier (entire table): ba.freestatistics.org/blog/index.php?pk=148250&T=1

As an alternative you can also use a QR Code:  

The GUIDs for individual cells are displayed in the table below:

Multiple Linear Regression - Estimated Regression Equation
MaandelijkseSterfgevallenInOntario[t] = + 110.875 -44.2895833333333M1[t] -52.3541666666667M2[t] -47.21875M3[t] -36.6833333333333M4[t] -20.9479166666667M5[t] -15.6125M6[t] + 5.92291666666666M7[t] + 22.6583333333333M8[t] + 9.79375M9[t] + 11.3291666666667M10[t] -0.735416666666673M11[t] + 0.464583333333333t + e[t]


Multiple Linear Regression - Ordinary Least Squares
VariableParameterS.D.T-STATH0: parameter = 02-tail p-value1-tail p-value
(Intercept)110.8757.54227714.700500
M1-44.28958333333339.175602-4.82691.5e-058e-06
M2-52.35416666666679.161893-5.71431e-060
M3-47.218759.149472-5.16085e-062e-06
M4-36.68333333333339.138344-4.01420.0002130.000107
M5-20.94791666666679.128514-2.29480.0262570.013129
M6-15.61259.119986-1.71190.0935070.046754
M75.922916666666669.1127640.650.5188840.259442
M822.65833333333339.1068512.48810.0164470.008224
M99.793759.1022491.0760.2874330.143716
M1011.32916666666679.098961.24510.2192650.109633
M11-0.7354166666666739.096986-0.08080.9359110.467956
t0.4645833333333330.1094124.24620.0001025.1e-05

\begin{tabular}{lllllllll}
\hline
Multiple Linear Regression - Ordinary Least Squares \tabularnewline
Variable & Parameter & S.D. & T-STATH0: parameter = 0 & 2-tail p-value & 1-tail p-value \tabularnewline
(Intercept) & 110.875 & 7.542277 & 14.7005 & 0 & 0 \tabularnewline
M1 & -44.2895833333333 & 9.175602 & -4.8269 & 1.5e-05 & 8e-06 \tabularnewline
M2 & -52.3541666666667 & 9.161893 & -5.7143 & 1e-06 & 0 \tabularnewline
M3 & -47.21875 & 9.149472 & -5.1608 & 5e-06 & 2e-06 \tabularnewline
M4 & -36.6833333333333 & 9.138344 & -4.0142 & 0.000213 & 0.000107 \tabularnewline
M5 & -20.9479166666667 & 9.128514 & -2.2948 & 0.026257 & 0.013129 \tabularnewline
M6 & -15.6125 & 9.119986 & -1.7119 & 0.093507 & 0.046754 \tabularnewline
M7 & 5.92291666666666 & 9.112764 & 0.65 & 0.518884 & 0.259442 \tabularnewline
M8 & 22.6583333333333 & 9.106851 & 2.4881 & 0.016447 & 0.008224 \tabularnewline
M9 & 9.79375 & 9.102249 & 1.076 & 0.287433 & 0.143716 \tabularnewline
M10 & 11.3291666666667 & 9.09896 & 1.2451 & 0.219265 & 0.109633 \tabularnewline
M11 & -0.735416666666673 & 9.096986 & -0.0808 & 0.935911 & 0.467956 \tabularnewline
t & 0.464583333333333 & 0.109412 & 4.2462 & 0.000102 & 5.1e-05 \tabularnewline
\hline
\end{tabular}
%Source: https://freestatistics.org/blog/index.php?pk=148250&T=2

[TABLE]
[ROW][C]Multiple Linear Regression - Ordinary Least Squares[/C][/ROW]
[ROW][C]Variable[/C][C]Parameter[/C][C]S.D.[/C][C]T-STATH0: parameter = 0[/C][C]2-tail p-value[/C][C]1-tail p-value[/C][/ROW]
[ROW][C](Intercept)[/C][C]110.875[/C][C]7.542277[/C][C]14.7005[/C][C]0[/C][C]0[/C][/ROW]
[ROW][C]M1[/C][C]-44.2895833333333[/C][C]9.175602[/C][C]-4.8269[/C][C]1.5e-05[/C][C]8e-06[/C][/ROW]
[ROW][C]M2[/C][C]-52.3541666666667[/C][C]9.161893[/C][C]-5.7143[/C][C]1e-06[/C][C]0[/C][/ROW]
[ROW][C]M3[/C][C]-47.21875[/C][C]9.149472[/C][C]-5.1608[/C][C]5e-06[/C][C]2e-06[/C][/ROW]
[ROW][C]M4[/C][C]-36.6833333333333[/C][C]9.138344[/C][C]-4.0142[/C][C]0.000213[/C][C]0.000107[/C][/ROW]
[ROW][C]M5[/C][C]-20.9479166666667[/C][C]9.128514[/C][C]-2.2948[/C][C]0.026257[/C][C]0.013129[/C][/ROW]
[ROW][C]M6[/C][C]-15.6125[/C][C]9.119986[/C][C]-1.7119[/C][C]0.093507[/C][C]0.046754[/C][/ROW]
[ROW][C]M7[/C][C]5.92291666666666[/C][C]9.112764[/C][C]0.65[/C][C]0.518884[/C][C]0.259442[/C][/ROW]
[ROW][C]M8[/C][C]22.6583333333333[/C][C]9.106851[/C][C]2.4881[/C][C]0.016447[/C][C]0.008224[/C][/ROW]
[ROW][C]M9[/C][C]9.79375[/C][C]9.102249[/C][C]1.076[/C][C]0.287433[/C][C]0.143716[/C][/ROW]
[ROW][C]M10[/C][C]11.3291666666667[/C][C]9.09896[/C][C]1.2451[/C][C]0.219265[/C][C]0.109633[/C][/ROW]
[ROW][C]M11[/C][C]-0.735416666666673[/C][C]9.096986[/C][C]-0.0808[/C][C]0.935911[/C][C]0.467956[/C][/ROW]
[ROW][C]t[/C][C]0.464583333333333[/C][C]0.109412[/C][C]4.2462[/C][C]0.000102[/C][C]5.1e-05[/C][/ROW]
[/TABLE]
Source: https://freestatistics.org/blog/index.php?pk=148250&T=2

Globally Unique Identifier (entire table): ba.freestatistics.org/blog/index.php?pk=148250&T=2

As an alternative you can also use a QR Code:  

The GUIDs for individual cells are displayed in the table below:

Multiple Linear Regression - Ordinary Least Squares
VariableParameterS.D.T-STATH0: parameter = 02-tail p-value1-tail p-value
(Intercept)110.8757.54227714.700500
M1-44.28958333333339.175602-4.82691.5e-058e-06
M2-52.35416666666679.161893-5.71431e-060
M3-47.218759.149472-5.16085e-062e-06
M4-36.68333333333339.138344-4.01420.0002130.000107
M5-20.94791666666679.128514-2.29480.0262570.013129
M6-15.61259.119986-1.71190.0935070.046754
M75.922916666666669.1127640.650.5188840.259442
M822.65833333333339.1068512.48810.0164470.008224
M99.793759.1022491.0760.2874330.143716
M1011.32916666666679.098961.24510.2192650.109633
M11-0.7354166666666739.096986-0.08080.9359110.467956
t0.4645833333333330.1094124.24620.0001025.1e-05


Multiple Linear Regression - Regression Statistics
Multiple R0.906520018393706
R-squared0.821778543748526
Adjusted R-squared0.776275193216235
F-TEST (value)18.0597370113516
F-TEST (DF numerator)12
F-TEST (DF denominator)47
p-value1.0591527654924e-13
Multiple Linear Regression - Residual Statistics
Residual Standard Deviation14.3825581425352
Sum Squared Residuals9722.325

\begin{tabular}{lllllllll}
\hline
Multiple Linear Regression - Regression Statistics \tabularnewline
Multiple R & 0.906520018393706 \tabularnewline
R-squared & 0.821778543748526 \tabularnewline
Adjusted R-squared & 0.776275193216235 \tabularnewline
F-TEST (value) & 18.0597370113516 \tabularnewline
F-TEST (DF numerator) & 12 \tabularnewline
F-TEST (DF denominator) & 47 \tabularnewline
p-value & 1.0591527654924e-13 \tabularnewline
Multiple Linear Regression - Residual Statistics \tabularnewline
Residual Standard Deviation & 14.3825581425352 \tabularnewline
Sum Squared Residuals & 9722.325 \tabularnewline
\hline
\end{tabular}
%Source: https://freestatistics.org/blog/index.php?pk=148250&T=3

[TABLE]
[ROW][C]Multiple Linear Regression - Regression Statistics[/C][/ROW]
[ROW][C]Multiple R[/C][C]0.906520018393706[/C][/ROW]
[ROW][C]R-squared[/C][C]0.821778543748526[/C][/ROW]
[ROW][C]Adjusted R-squared[/C][C]0.776275193216235[/C][/ROW]
[ROW][C]F-TEST (value)[/C][C]18.0597370113516[/C][/ROW]
[ROW][C]F-TEST (DF numerator)[/C][C]12[/C][/ROW]
[ROW][C]F-TEST (DF denominator)[/C][C]47[/C][/ROW]
[ROW][C]p-value[/C][C]1.0591527654924e-13[/C][/ROW]
[ROW][C]Multiple Linear Regression - Residual Statistics[/C][/ROW]
[ROW][C]Residual Standard Deviation[/C][C]14.3825581425352[/C][/ROW]
[ROW][C]Sum Squared Residuals[/C][C]9722.325[/C][/ROW]
[/TABLE]
Source: https://freestatistics.org/blog/index.php?pk=148250&T=3

Globally Unique Identifier (entire table): ba.freestatistics.org/blog/index.php?pk=148250&T=3

As an alternative you can also use a QR Code:  

The GUIDs for individual cells are displayed in the table below:

Multiple Linear Regression - Regression Statistics
Multiple R0.906520018393706
R-squared0.821778543748526
Adjusted R-squared0.776275193216235
F-TEST (value)18.0597370113516
F-TEST (DF numerator)12
F-TEST (DF denominator)47
p-value1.0591527654924e-13
Multiple Linear Regression - Residual Statistics
Residual Standard Deviation14.3825581425352
Sum Squared Residuals9722.325


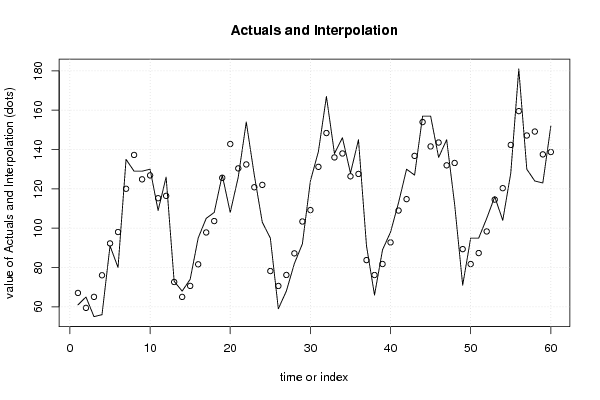
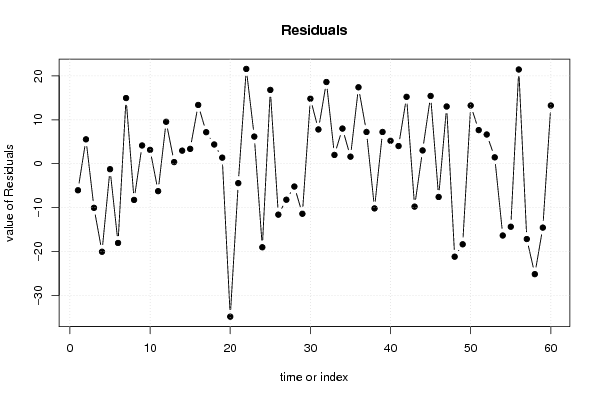
Multiple Linear Regression - Actuals, Interpolation, and Residuals
Time or IndexActualsInterpolationForecastResidualsPrediction Error
16167.0499999999998-6.04999999999979
26559.455.54999999999999
35565.05-10.05
45676.05-20.05
59192.25-1.25
68098.05-18.05
7135120.0514.95
8129137.25-8.25
9129124.854.14999999999998
10130126.853.14999999999999
11109115.25-6.25
12126116.459.54999999999999
137372.6250.37499999999994
146865.0252.97499999999999
157470.6253.375
169581.62513.375
1710597.8257.175
18108103.6254.375
19127125.6251.375
20108142.825-34.825
21126130.425-4.425
22154132.42521.575
23127120.8256.175
24103122.025-19.025
259578.216.7999999999999
265970.6-11.6
276876.2-8.2
288287.2-5.2
2992103.4-11.4
30124109.214.8
31139131.27.8
32167148.418.6
331381362
341461388
35128126.41.6
36145127.617.4
379183.7757.22499999999996
386676.175-10.175
398981.7757.225
409892.7755.22500000000001
41113108.9754.02500000000001
42130114.77515.225
43127136.775-9.775
44157153.9753.025
45157141.57515.425
46136143.575-7.575
47145131.97513.025
48112133.175-21.175
497189.35-18.35
509581.7513.25
519587.357.65000000000001
5210598.356.65000000000001
53116114.551.45000000000001
54104120.35-16.35
55128142.35-14.35
56181159.5521.45
57130147.15-17.15
58124149.15-25.15
59123137.55-14.55
60152138.7513.25

\begin{tabular}{lllllllll}
\hline
Multiple Linear Regression - Actuals, Interpolation, and Residuals \tabularnewline
Time or Index & Actuals & InterpolationForecast & ResidualsPrediction Error \tabularnewline
1 & 61 & 67.0499999999998 & -6.04999999999979 \tabularnewline
2 & 65 & 59.45 & 5.54999999999999 \tabularnewline
3 & 55 & 65.05 & -10.05 \tabularnewline
4 & 56 & 76.05 & -20.05 \tabularnewline
5 & 91 & 92.25 & -1.25 \tabularnewline
6 & 80 & 98.05 & -18.05 \tabularnewline
7 & 135 & 120.05 & 14.95 \tabularnewline
8 & 129 & 137.25 & -8.25 \tabularnewline
9 & 129 & 124.85 & 4.14999999999998 \tabularnewline
10 & 130 & 126.85 & 3.14999999999999 \tabularnewline
11 & 109 & 115.25 & -6.25 \tabularnewline
12 & 126 & 116.45 & 9.54999999999999 \tabularnewline
13 & 73 & 72.625 & 0.37499999999994 \tabularnewline
14 & 68 & 65.025 & 2.97499999999999 \tabularnewline
15 & 74 & 70.625 & 3.375 \tabularnewline
16 & 95 & 81.625 & 13.375 \tabularnewline
17 & 105 & 97.825 & 7.175 \tabularnewline
18 & 108 & 103.625 & 4.375 \tabularnewline
19 & 127 & 125.625 & 1.375 \tabularnewline
20 & 108 & 142.825 & -34.825 \tabularnewline
21 & 126 & 130.425 & -4.425 \tabularnewline
22 & 154 & 132.425 & 21.575 \tabularnewline
23 & 127 & 120.825 & 6.175 \tabularnewline
24 & 103 & 122.025 & -19.025 \tabularnewline
25 & 95 & 78.2 & 16.7999999999999 \tabularnewline
26 & 59 & 70.6 & -11.6 \tabularnewline
27 & 68 & 76.2 & -8.2 \tabularnewline
28 & 82 & 87.2 & -5.2 \tabularnewline
29 & 92 & 103.4 & -11.4 \tabularnewline
30 & 124 & 109.2 & 14.8 \tabularnewline
31 & 139 & 131.2 & 7.8 \tabularnewline
32 & 167 & 148.4 & 18.6 \tabularnewline
33 & 138 & 136 & 2 \tabularnewline
34 & 146 & 138 & 8 \tabularnewline
35 & 128 & 126.4 & 1.6 \tabularnewline
36 & 145 & 127.6 & 17.4 \tabularnewline
37 & 91 & 83.775 & 7.22499999999996 \tabularnewline
38 & 66 & 76.175 & -10.175 \tabularnewline
39 & 89 & 81.775 & 7.225 \tabularnewline
40 & 98 & 92.775 & 5.22500000000001 \tabularnewline
41 & 113 & 108.975 & 4.02500000000001 \tabularnewline
42 & 130 & 114.775 & 15.225 \tabularnewline
43 & 127 & 136.775 & -9.775 \tabularnewline
44 & 157 & 153.975 & 3.025 \tabularnewline
45 & 157 & 141.575 & 15.425 \tabularnewline
46 & 136 & 143.575 & -7.575 \tabularnewline
47 & 145 & 131.975 & 13.025 \tabularnewline
48 & 112 & 133.175 & -21.175 \tabularnewline
49 & 71 & 89.35 & -18.35 \tabularnewline
50 & 95 & 81.75 & 13.25 \tabularnewline
51 & 95 & 87.35 & 7.65000000000001 \tabularnewline
52 & 105 & 98.35 & 6.65000000000001 \tabularnewline
53 & 116 & 114.55 & 1.45000000000001 \tabularnewline
54 & 104 & 120.35 & -16.35 \tabularnewline
55 & 128 & 142.35 & -14.35 \tabularnewline
56 & 181 & 159.55 & 21.45 \tabularnewline
57 & 130 & 147.15 & -17.15 \tabularnewline
58 & 124 & 149.15 & -25.15 \tabularnewline
59 & 123 & 137.55 & -14.55 \tabularnewline
60 & 152 & 138.75 & 13.25 \tabularnewline
\hline
\end{tabular}
%Source: https://freestatistics.org/blog/index.php?pk=148250&T=4

[TABLE]
[ROW][C]Multiple Linear Regression - Actuals, Interpolation, and Residuals[/C][/ROW]
[ROW][C]Time or Index[/C][C]Actuals[/C][C]InterpolationForecast[/C][C]ResidualsPrediction Error[/C][/ROW]
[ROW][C]1[/C][C]61[/C][C]67.0499999999998[/C][C]-6.04999999999979[/C][/ROW]
[ROW][C]2[/C][C]65[/C][C]59.45[/C][C]5.54999999999999[/C][/ROW]
[ROW][C]3[/C][C]55[/C][C]65.05[/C][C]-10.05[/C][/ROW]
[ROW][C]4[/C][C]56[/C][C]76.05[/C][C]-20.05[/C][/ROW]
[ROW][C]5[/C][C]91[/C][C]92.25[/C][C]-1.25[/C][/ROW]
[ROW][C]6[/C][C]80[/C][C]98.05[/C][C]-18.05[/C][/ROW]
[ROW][C]7[/C][C]135[/C][C]120.05[/C][C]14.95[/C][/ROW]
[ROW][C]8[/C][C]129[/C][C]137.25[/C][C]-8.25[/C][/ROW]
[ROW][C]9[/C][C]129[/C][C]124.85[/C][C]4.14999999999998[/C][/ROW]
[ROW][C]10[/C][C]130[/C][C]126.85[/C][C]3.14999999999999[/C][/ROW]
[ROW][C]11[/C][C]109[/C][C]115.25[/C][C]-6.25[/C][/ROW]
[ROW][C]12[/C][C]126[/C][C]116.45[/C][C]9.54999999999999[/C][/ROW]
[ROW][C]13[/C][C]73[/C][C]72.625[/C][C]0.37499999999994[/C][/ROW]
[ROW][C]14[/C][C]68[/C][C]65.025[/C][C]2.97499999999999[/C][/ROW]
[ROW][C]15[/C][C]74[/C][C]70.625[/C][C]3.375[/C][/ROW]
[ROW][C]16[/C][C]95[/C][C]81.625[/C][C]13.375[/C][/ROW]
[ROW][C]17[/C][C]105[/C][C]97.825[/C][C]7.175[/C][/ROW]
[ROW][C]18[/C][C]108[/C][C]103.625[/C][C]4.375[/C][/ROW]
[ROW][C]19[/C][C]127[/C][C]125.625[/C][C]1.375[/C][/ROW]
[ROW][C]20[/C][C]108[/C][C]142.825[/C][C]-34.825[/C][/ROW]
[ROW][C]21[/C][C]126[/C][C]130.425[/C][C]-4.425[/C][/ROW]
[ROW][C]22[/C][C]154[/C][C]132.425[/C][C]21.575[/C][/ROW]
[ROW][C]23[/C][C]127[/C][C]120.825[/C][C]6.175[/C][/ROW]
[ROW][C]24[/C][C]103[/C][C]122.025[/C][C]-19.025[/C][/ROW]
[ROW][C]25[/C][C]95[/C][C]78.2[/C][C]16.7999999999999[/C][/ROW]
[ROW][C]26[/C][C]59[/C][C]70.6[/C][C]-11.6[/C][/ROW]
[ROW][C]27[/C][C]68[/C][C]76.2[/C][C]-8.2[/C][/ROW]
[ROW][C]28[/C][C]82[/C][C]87.2[/C][C]-5.2[/C][/ROW]
[ROW][C]29[/C][C]92[/C][C]103.4[/C][C]-11.4[/C][/ROW]
[ROW][C]30[/C][C]124[/C][C]109.2[/C][C]14.8[/C][/ROW]
[ROW][C]31[/C][C]139[/C][C]131.2[/C][C]7.8[/C][/ROW]
[ROW][C]32[/C][C]167[/C][C]148.4[/C][C]18.6[/C][/ROW]
[ROW][C]33[/C][C]138[/C][C]136[/C][C]2[/C][/ROW]
[ROW][C]34[/C][C]146[/C][C]138[/C][C]8[/C][/ROW]
[ROW][C]35[/C][C]128[/C][C]126.4[/C][C]1.6[/C][/ROW]
[ROW][C]36[/C][C]145[/C][C]127.6[/C][C]17.4[/C][/ROW]
[ROW][C]37[/C][C]91[/C][C]83.775[/C][C]7.22499999999996[/C][/ROW]
[ROW][C]38[/C][C]66[/C][C]76.175[/C][C]-10.175[/C][/ROW]
[ROW][C]39[/C][C]89[/C][C]81.775[/C][C]7.225[/C][/ROW]
[ROW][C]40[/C][C]98[/C][C]92.775[/C][C]5.22500000000001[/C][/ROW]
[ROW][C]41[/C][C]113[/C][C]108.975[/C][C]4.02500000000001[/C][/ROW]
[ROW][C]42[/C][C]130[/C][C]114.775[/C][C]15.225[/C][/ROW]
[ROW][C]43[/C][C]127[/C][C]136.775[/C][C]-9.775[/C][/ROW]
[ROW][C]44[/C][C]157[/C][C]153.975[/C][C]3.025[/C][/ROW]
[ROW][C]45[/C][C]157[/C][C]141.575[/C][C]15.425[/C][/ROW]
[ROW][C]46[/C][C]136[/C][C]143.575[/C][C]-7.575[/C][/ROW]
[ROW][C]47[/C][C]145[/C][C]131.975[/C][C]13.025[/C][/ROW]
[ROW][C]48[/C][C]112[/C][C]133.175[/C][C]-21.175[/C][/ROW]
[ROW][C]49[/C][C]71[/C][C]89.35[/C][C]-18.35[/C][/ROW]
[ROW][C]50[/C][C]95[/C][C]81.75[/C][C]13.25[/C][/ROW]
[ROW][C]51[/C][C]95[/C][C]87.35[/C][C]7.65000000000001[/C][/ROW]
[ROW][C]52[/C][C]105[/C][C]98.35[/C][C]6.65000000000001[/C][/ROW]
[ROW][C]53[/C][C]116[/C][C]114.55[/C][C]1.45000000000001[/C][/ROW]
[ROW][C]54[/C][C]104[/C][C]120.35[/C][C]-16.35[/C][/ROW]
[ROW][C]55[/C][C]128[/C][C]142.35[/C][C]-14.35[/C][/ROW]
[ROW][C]56[/C][C]181[/C][C]159.55[/C][C]21.45[/C][/ROW]
[ROW][C]57[/C][C]130[/C][C]147.15[/C][C]-17.15[/C][/ROW]
[ROW][C]58[/C][C]124[/C][C]149.15[/C][C]-25.15[/C][/ROW]
[ROW][C]59[/C][C]123[/C][C]137.55[/C][C]-14.55[/C][/ROW]
[ROW][C]60[/C][C]152[/C][C]138.75[/C][C]13.25[/C][/ROW]
[/TABLE]
Source: https://freestatistics.org/blog/index.php?pk=148250&T=4

Globally Unique Identifier (entire table): ba.freestatistics.org/blog/index.php?pk=148250&T=4

As an alternative you can also use a QR Code:  

The GUIDs for individual cells are displayed in the table below:

Multiple Linear Regression - Actuals, Interpolation, and Residuals
Time or IndexActualsInterpolationForecastResidualsPrediction Error
16167.0499999999998-6.04999999999979
26559.455.54999999999999
35565.05-10.05
45676.05-20.05
59192.25-1.25
68098.05-18.05
7135120.0514.95
8129137.25-8.25
9129124.854.14999999999998
10130126.853.14999999999999
11109115.25-6.25
12126116.459.54999999999999
137372.6250.37499999999994
146865.0252.97499999999999
157470.6253.375
169581.62513.375
1710597.8257.175
18108103.6254.375
19127125.6251.375
20108142.825-34.825
21126130.425-4.425
22154132.42521.575
23127120.8256.175
24103122.025-19.025
259578.216.7999999999999
265970.6-11.6
276876.2-8.2
288287.2-5.2
2992103.4-11.4
30124109.214.8
31139131.27.8
32167148.418.6
331381362
341461388
35128126.41.6
36145127.617.4
379183.7757.22499999999996
386676.175-10.175
398981.7757.225
409892.7755.22500000000001
41113108.9754.02500000000001
42130114.77515.225
43127136.775-9.775
44157153.9753.025
45157141.57515.425
46136143.575-7.575
47145131.97513.025
48112133.175-21.175
497189.35-18.35
509581.7513.25
519587.357.65000000000001
5210598.356.65000000000001
53116114.551.45000000000001
54104120.35-16.35
55128142.35-14.35
56181159.5521.45
57130147.15-17.15
58124149.15-25.15
59123137.55-14.55
60152138.7513.25


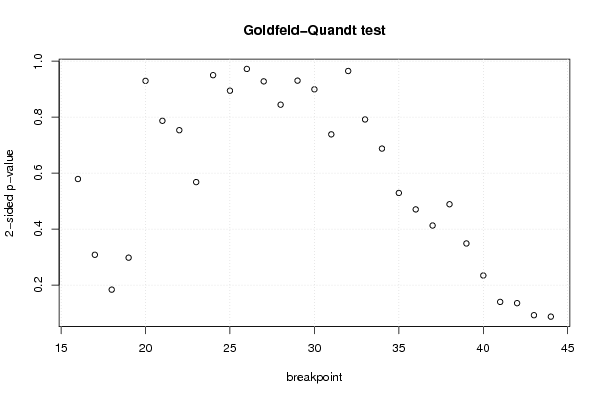
Goldfeld-Quandt test for Heteroskedasticity
p-valuesAlternative Hypothesis
breakpoint indexgreater2-sidedless
160.2894936363910560.5789872727821110.710506363608944
170.1540856200020910.3081712400041820.845914379997909
180.0917893513042180.1835787026084360.908210648695782
190.1489330360611730.2978660721223460.851066963938827
200.4648480000304180.9296960000608370.535151999969582
210.3934942385257830.7869884770515670.606505761474217
220.3767087499582130.7534174999164270.623291250041787
230.2840006817534040.5680013635068090.715999318246596
240.4749967561115940.9499935122231890.525003243888405
250.4472711173462860.8945422346925730.552728882653714
260.4861372696392430.9722745392784870.513862730360757
270.463948984137710.927897968275420.53605101586229
280.4222570042516040.8445140085032080.577742995748396
290.465198831856150.93039766371230.53480116814385
300.4496764936513990.8993529873027980.550323506348601
310.3692779298909210.7385558597818410.630722070109079
320.4824756031251550.964951206250310.517524396874845
330.3959101443801120.7918202887602230.604089855619888
340.3438537545624460.6877075091248920.656146245437554
350.264548279619910.5290965592398190.73545172038009
360.2351889711708850.4703779423417710.764811028829115
370.2063961577694140.4127923155388280.793603842230586
380.2444193027511820.4888386055023650.755580697248818
390.1743440939182520.3486881878365030.825655906081748
400.1170837905785560.2341675811571120.882916209421444
410.06988842192379280.1397768438475860.930111578076207
420.06766724026274550.1353344805254910.932332759737254
430.04615523062636950.0923104612527390.95384476937363
440.04356523788625570.08713047577251140.956434762113744

\begin{tabular}{lllllllll}
\hline
Goldfeld-Quandt test for Heteroskedasticity \tabularnewline
p-values & Alternative Hypothesis \tabularnewline
breakpoint index & greater & 2-sided & less \tabularnewline
16 & 0.289493636391056 & 0.578987272782111 & 0.710506363608944 \tabularnewline
17 & 0.154085620002091 & 0.308171240004182 & 0.845914379997909 \tabularnewline
18 & 0.091789351304218 & 0.183578702608436 & 0.908210648695782 \tabularnewline
19 & 0.148933036061173 & 0.297866072122346 & 0.851066963938827 \tabularnewline
20 & 0.464848000030418 & 0.929696000060837 & 0.535151999969582 \tabularnewline
21 & 0.393494238525783 & 0.786988477051567 & 0.606505761474217 \tabularnewline
22 & 0.376708749958213 & 0.753417499916427 & 0.623291250041787 \tabularnewline
23 & 0.284000681753404 & 0.568001363506809 & 0.715999318246596 \tabularnewline
24 & 0.474996756111594 & 0.949993512223189 & 0.525003243888405 \tabularnewline
25 & 0.447271117346286 & 0.894542234692573 & 0.552728882653714 \tabularnewline
26 & 0.486137269639243 & 0.972274539278487 & 0.513862730360757 \tabularnewline
27 & 0.46394898413771 & 0.92789796827542 & 0.53605101586229 \tabularnewline
28 & 0.422257004251604 & 0.844514008503208 & 0.577742995748396 \tabularnewline
29 & 0.46519883185615 & 0.9303976637123 & 0.53480116814385 \tabularnewline
30 & 0.449676493651399 & 0.899352987302798 & 0.550323506348601 \tabularnewline
31 & 0.369277929890921 & 0.738555859781841 & 0.630722070109079 \tabularnewline
32 & 0.482475603125155 & 0.96495120625031 & 0.517524396874845 \tabularnewline
33 & 0.395910144380112 & 0.791820288760223 & 0.604089855619888 \tabularnewline
34 & 0.343853754562446 & 0.687707509124892 & 0.656146245437554 \tabularnewline
35 & 0.26454827961991 & 0.529096559239819 & 0.73545172038009 \tabularnewline
36 & 0.235188971170885 & 0.470377942341771 & 0.764811028829115 \tabularnewline
37 & 0.206396157769414 & 0.412792315538828 & 0.793603842230586 \tabularnewline
38 & 0.244419302751182 & 0.488838605502365 & 0.755580697248818 \tabularnewline
39 & 0.174344093918252 & 0.348688187836503 & 0.825655906081748 \tabularnewline
40 & 0.117083790578556 & 0.234167581157112 & 0.882916209421444 \tabularnewline
41 & 0.0698884219237928 & 0.139776843847586 & 0.930111578076207 \tabularnewline
42 & 0.0676672402627455 & 0.135334480525491 & 0.932332759737254 \tabularnewline
43 & 0.0461552306263695 & 0.092310461252739 & 0.95384476937363 \tabularnewline
44 & 0.0435652378862557 & 0.0871304757725114 & 0.956434762113744 \tabularnewline
\hline
\end{tabular}
%Source: https://freestatistics.org/blog/index.php?pk=148250&T=5

[TABLE]
[ROW][C]Goldfeld-Quandt test for Heteroskedasticity[/C][/ROW]
[ROW][C]p-values[/C][C]Alternative Hypothesis[/C][/ROW]
[ROW][C]breakpoint index[/C][C]greater[/C][C]2-sided[/C][C]less[/C][/ROW]
[ROW][C]16[/C][C]0.289493636391056[/C][C]0.578987272782111[/C][C]0.710506363608944[/C][/ROW]
[ROW][C]17[/C][C]0.154085620002091[/C][C]0.308171240004182[/C][C]0.845914379997909[/C][/ROW]
[ROW][C]18[/C][C]0.091789351304218[/C][C]0.183578702608436[/C][C]0.908210648695782[/C][/ROW]
[ROW][C]19[/C][C]0.148933036061173[/C][C]0.297866072122346[/C][C]0.851066963938827[/C][/ROW]
[ROW][C]20[/C][C]0.464848000030418[/C][C]0.929696000060837[/C][C]0.535151999969582[/C][/ROW]
[ROW][C]21[/C][C]0.393494238525783[/C][C]0.786988477051567[/C][C]0.606505761474217[/C][/ROW]
[ROW][C]22[/C][C]0.376708749958213[/C][C]0.753417499916427[/C][C]0.623291250041787[/C][/ROW]
[ROW][C]23[/C][C]0.284000681753404[/C][C]0.568001363506809[/C][C]0.715999318246596[/C][/ROW]
[ROW][C]24[/C][C]0.474996756111594[/C][C]0.949993512223189[/C][C]0.525003243888405[/C][/ROW]
[ROW][C]25[/C][C]0.447271117346286[/C][C]0.894542234692573[/C][C]0.552728882653714[/C][/ROW]
[ROW][C]26[/C][C]0.486137269639243[/C][C]0.972274539278487[/C][C]0.513862730360757[/C][/ROW]
[ROW][C]27[/C][C]0.46394898413771[/C][C]0.92789796827542[/C][C]0.53605101586229[/C][/ROW]
[ROW][C]28[/C][C]0.422257004251604[/C][C]0.844514008503208[/C][C]0.577742995748396[/C][/ROW]
[ROW][C]29[/C][C]0.46519883185615[/C][C]0.9303976637123[/C][C]0.53480116814385[/C][/ROW]
[ROW][C]30[/C][C]0.449676493651399[/C][C]0.899352987302798[/C][C]0.550323506348601[/C][/ROW]
[ROW][C]31[/C][C]0.369277929890921[/C][C]0.738555859781841[/C][C]0.630722070109079[/C][/ROW]
[ROW][C]32[/C][C]0.482475603125155[/C][C]0.96495120625031[/C][C]0.517524396874845[/C][/ROW]
[ROW][C]33[/C][C]0.395910144380112[/C][C]0.791820288760223[/C][C]0.604089855619888[/C][/ROW]
[ROW][C]34[/C][C]0.343853754562446[/C][C]0.687707509124892[/C][C]0.656146245437554[/C][/ROW]
[ROW][C]35[/C][C]0.26454827961991[/C][C]0.529096559239819[/C][C]0.73545172038009[/C][/ROW]
[ROW][C]36[/C][C]0.235188971170885[/C][C]0.470377942341771[/C][C]0.764811028829115[/C][/ROW]
[ROW][C]37[/C][C]0.206396157769414[/C][C]0.412792315538828[/C][C]0.793603842230586[/C][/ROW]
[ROW][C]38[/C][C]0.244419302751182[/C][C]0.488838605502365[/C][C]0.755580697248818[/C][/ROW]
[ROW][C]39[/C][C]0.174344093918252[/C][C]0.348688187836503[/C][C]0.825655906081748[/C][/ROW]
[ROW][C]40[/C][C]0.117083790578556[/C][C]0.234167581157112[/C][C]0.882916209421444[/C][/ROW]
[ROW][C]41[/C][C]0.0698884219237928[/C][C]0.139776843847586[/C][C]0.930111578076207[/C][/ROW]
[ROW][C]42[/C][C]0.0676672402627455[/C][C]0.135334480525491[/C][C]0.932332759737254[/C][/ROW]
[ROW][C]43[/C][C]0.0461552306263695[/C][C]0.092310461252739[/C][C]0.95384476937363[/C][/ROW]
[ROW][C]44[/C][C]0.0435652378862557[/C][C]0.0871304757725114[/C][C]0.956434762113744[/C][/ROW]
[/TABLE]
Source: https://freestatistics.org/blog/index.php?pk=148250&T=5

Globally Unique Identifier (entire table): ba.freestatistics.org/blog/index.php?pk=148250&T=5

As an alternative you can also use a QR Code:  

The GUIDs for individual cells are displayed in the table below:

Goldfeld-Quandt test for Heteroskedasticity
p-valuesAlternative Hypothesis
breakpoint indexgreater2-sidedless
160.2894936363910560.5789872727821110.710506363608944
170.1540856200020910.3081712400041820.845914379997909
180.0917893513042180.1835787026084360.908210648695782
190.1489330360611730.2978660721223460.851066963938827
200.4648480000304180.9296960000608370.535151999969582
210.3934942385257830.7869884770515670.606505761474217
220.3767087499582130.7534174999164270.623291250041787
230.2840006817534040.5680013635068090.715999318246596
240.4749967561115940.9499935122231890.525003243888405
250.4472711173462860.8945422346925730.552728882653714
260.4861372696392430.9722745392784870.513862730360757
270.463948984137710.927897968275420.53605101586229
280.4222570042516040.8445140085032080.577742995748396
290.465198831856150.93039766371230.53480116814385
300.4496764936513990.8993529873027980.550323506348601
310.3692779298909210.7385558597818410.630722070109079
320.4824756031251550.964951206250310.517524396874845
330.3959101443801120.7918202887602230.604089855619888
340.3438537545624460.6877075091248920.656146245437554
350.264548279619910.5290965592398190.73545172038009
360.2351889711708850.4703779423417710.764811028829115
370.2063961577694140.4127923155388280.793603842230586
380.2444193027511820.4888386055023650.755580697248818
390.1743440939182520.3486881878365030.825655906081748
400.1170837905785560.2341675811571120.882916209421444
410.06988842192379280.1397768438475860.930111578076207
420.06766724026274550.1353344805254910.932332759737254
430.04615523062636950.0923104612527390.95384476937363
440.04356523788625570.08713047577251140.956434762113744


Meta Analysis of Goldfeld-Quandt test for Heteroskedasticity
Description# significant tests% significant testsOK/NOK
1% type I error level00OK
5% type I error level00OK
10% type I error level20.0689655172413793OK

\begin{tabular}{lllllllll}
\hline
Meta Analysis of Goldfeld-Quandt test for Heteroskedasticity \tabularnewline
Description & # significant tests & % significant tests & OK/NOK \tabularnewline
1% type I error level & 0 & 0 & OK \tabularnewline
5% type I error level & 0 & 0 & OK \tabularnewline
10% type I error level & 2 & 0.0689655172413793 & OK \tabularnewline
\hline
\end{tabular}
%Source: https://freestatistics.org/blog/index.php?pk=148250&T=6

[TABLE]
[ROW][C]Meta Analysis of Goldfeld-Quandt test for Heteroskedasticity[/C][/ROW]
[ROW][C]Description[/C][C]# significant tests[/C][C]% significant tests[/C][C]OK/NOK[/C][/ROW]
[ROW][C]1% type I error level[/C][C]0[/C][C]0[/C][C]OK[/C][/ROW]
[ROW][C]5% type I error level[/C][C]0[/C][C]0[/C][C]OK[/C][/ROW]
[ROW][C]10% type I error level[/C][C]2[/C][C]0.0689655172413793[/C][C]OK[/C][/ROW]
[/TABLE]
Source: https://freestatistics.org/blog/index.php?pk=148250&T=6

Globally Unique Identifier (entire table): ba.freestatistics.org/blog/index.php?pk=148250&T=6

As an alternative you can also use a QR Code:  

The GUIDs for individual cells are displayed in the table below:

Meta Analysis of Goldfeld-Quandt test for Heteroskedasticity
Description# significant tests% significant testsOK/NOK
1% type I error level00OK
5% type I error level00OK
10% type I error level20.0689655172413793OK


Parameters (Session):
par1 = 1 ; par2 = Include Monthly Dummies ; par3 = Linear Trend ;
Parameters (R input):
par1 = 1 ; par2 = Include Monthly Dummies ; par3 = Linear Trend ;
R code (references can be found in the software module):
library(lattice)
library(lmtest)
n25 <- 25 #minimum number of obs. for Goldfeld-Quandt test
par1 <- as.numeric(par1)
x <- t(y)
k <- length(x[1,])
n <- length(x[,1])
x1 <- cbind(x[,par1], x[,1:k!=par1])
mycolnames <- c(colnames(x)[par1], colnames(x)[1:k!=par1])
colnames(x1) <- mycolnames #colnames(x)[par1]
x <- x1
if (par3 == 'First Differences'){
x2 <- array(0, dim=c(n-1,k), dimnames=list(1:(n-1), paste('(1-B)',colnames(x),sep='')))
for (i in 1:n-1) {
for (j in 1:k) {
x2[i,j] <- x[i+1,j] - x[i,j]
}
}
x <- x2
}
if (par2 == 'Include Monthly Dummies'){
x2 <- array(0, dim=c(n,11), dimnames=list(1:n, paste('M', seq(1:11), sep ='')))
for (i in 1:11){
x2[seq(i,n,12),i] <- 1
}
x <- cbind(x, x2)
}
if (par2 == 'Include Quarterly Dummies'){
x2 <- array(0, dim=c(n,3), dimnames=list(1:n, paste('Q', seq(1:3), sep ='')))
for (i in 1:3){
x2[seq(i,n,4),i] <- 1
}
x <- cbind(x, x2)
}
k <- length(x[1,])
if (par3 == 'Linear Trend'){
x <- cbind(x, c(1:n))
colnames(x)[k+1] <- 't'
}
x
k <- length(x[1,])
df <- as.data.frame(x)
(mylm <- lm(df))
(mysum <- summary(mylm))
if (n > n25) {
kp3 <- k + 3
nmkm3 <- n - k - 3
gqarr <- array(NA, dim=c(nmkm3-kp3+1,3))
numgqtests <- 0
numsignificant1 <- 0
numsignificant5 <- 0
numsignificant10 <- 0
for (mypoint in kp3:nmkm3) {
j <- 0
numgqtests <- numgqtests + 1
for (myalt in c('greater', 'two.sided', 'less')) {
j <- j + 1
gqarr[mypoint-kp3+1,j] <- gqtest(mylm, point=mypoint, alternative=myalt)$p.value
}
if (gqarr[mypoint-kp3+1,2] < 0.01) numsignificant1 <- numsignificant1 + 1
if (gqarr[mypoint-kp3+1,2] < 0.05) numsignificant5 <- numsignificant5 + 1
if (gqarr[mypoint-kp3+1,2] < 0.10) numsignificant10 <- numsignificant10 + 1
}
gqarr
}
bitmap(file='test0.png')
plot(x[,1], type='l', main='Actuals and Interpolation', ylab='value of Actuals and Interpolation (dots)', xlab='time or index')
points(x[,1]-mysum$resid)
grid()
dev.off()
bitmap(file='test1.png')
plot(mysum$resid, type='b', pch=19, main='Residuals', ylab='value of Residuals', xlab='time or index')
grid()
dev.off()
bitmap(file='test2.png')
hist(mysum$resid, main='Residual Histogram', xlab='values of Residuals')
grid()
dev.off()
bitmap(file='test3.png')
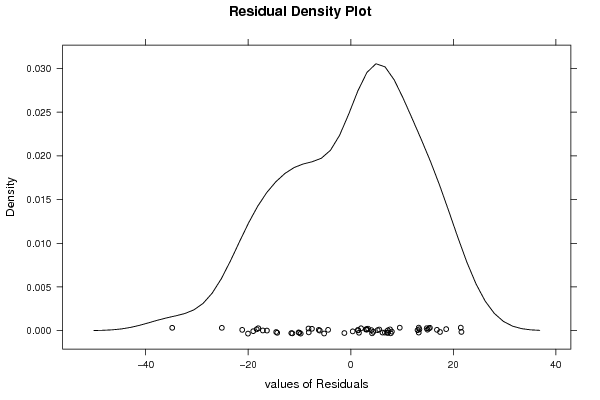
densityplot(~mysum$resid,col='black',main='Residual Density Plot', xlab='values of Residuals')
dev.off()
bitmap(file='test4.png')
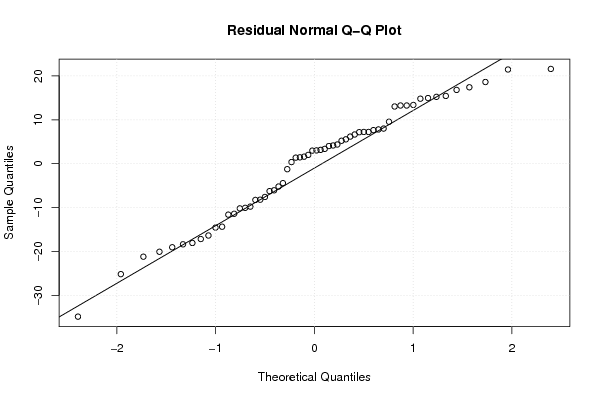
qqnorm(mysum$resid, main='Residual Normal Q-Q Plot')
qqline(mysum$resid)
grid()
dev.off()
(myerror <- as.ts(mysum$resid))
bitmap(file='test5.png')
dum <- cbind(lag(myerror,k=1),myerror)
dum
dum1 <- dum[2:length(myerror),]
dum1
z <- as.data.frame(dum1)
z
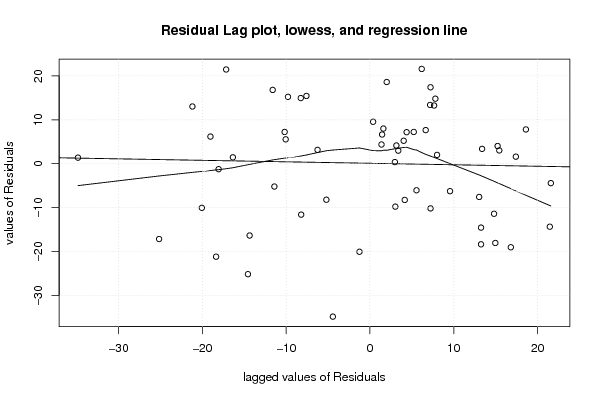
plot(z,main=paste('Residual Lag plot, lowess, and regression line'), ylab='values of Residuals', xlab='lagged values of Residuals')
lines(lowess(z))
abline(lm(z))
grid()
dev.off()
bitmap(file='test6.png')
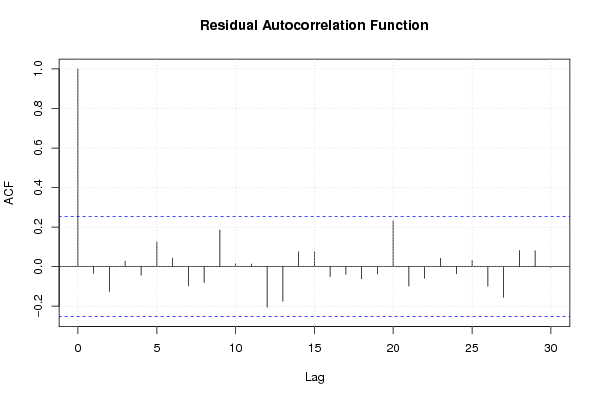
acf(mysum$resid, lag.max=length(mysum$resid)/2, main='Residual Autocorrelation Function')
grid()
dev.off()
bitmap(file='test7.png')
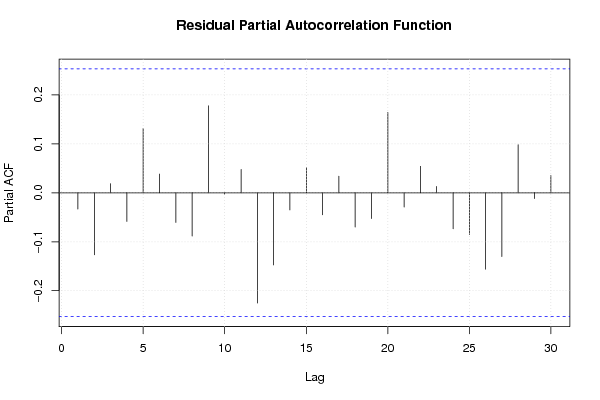
pacf(mysum$resid, lag.max=length(mysum$resid)/2, main='Residual Partial Autocorrelation Function')
grid()
dev.off()
bitmap(file='test8.png')
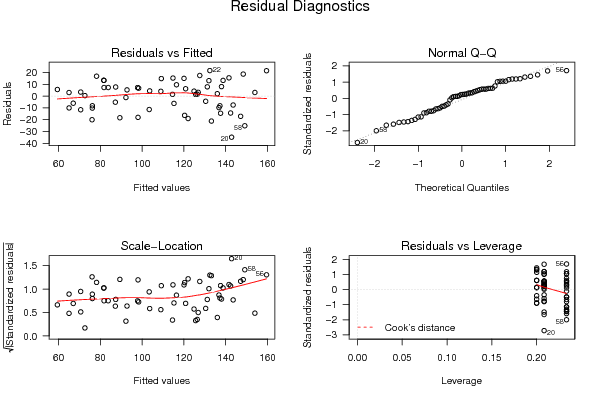
opar <- par(mfrow = c(2,2), oma = c(0, 0, 1.1, 0))
plot(mylm, las = 1, sub='Residual Diagnostics')
par(opar)
dev.off()
if (n > n25) {
bitmap(file='test9.png')
plot(kp3:nmkm3,gqarr[,2], main='Goldfeld-Quandt test',ylab='2-sided p-value',xlab='breakpoint')
grid()
dev.off()
}
load(file='createtable')
a<-table.start()
a<-table.row.start(a)
a<-table.element(a, 'Multiple Linear Regression - Estimated Regression Equation', 1, TRUE)
a<-table.row.end(a)
myeq <- colnames(x)[1]
myeq <- paste(myeq, '[t] = ', sep='')
for (i in 1:k){
if (mysum$coefficients[i,1] > 0) myeq <- paste(myeq, '+', '')
myeq <- paste(myeq, mysum$coefficients[i,1], sep=' ')
if (rownames(mysum$coefficients)[i] != '(Intercept)') {
myeq <- paste(myeq, rownames(mysum$coefficients)[i], sep='')
if (rownames(mysum$coefficients)[i] != 't') myeq <- paste(myeq, '[t]', sep='')
}
}
myeq <- paste(myeq, ' + e[t]')
a<-table.row.start(a)
a<-table.element(a, myeq)
a<-table.row.end(a)
a<-table.end(a)
table.save(a,file='mytable1.tab')
a<-table.start()
a<-table.row.start(a)
a<-table.element(a,hyperlink('ols1.htm','Multiple Linear Regression - Ordinary Least Squares',''), 6, TRUE)
a<-table.row.end(a)
a<-table.row.start(a)
a<-table.element(a,'Variable',header=TRUE)
a<-table.element(a,'Parameter',header=TRUE)
a<-table.element(a,'S.D.',header=TRUE)
a<-table.element(a,'T-STAT
H0: parameter = 0',header=TRUE)
a<-table.element(a,'2-tail p-value',header=TRUE)
a<-table.element(a,'1-tail p-value',header=TRUE)
a<-table.row.end(a)
for (i in 1:k){
a<-table.row.start(a)
a<-table.element(a,rownames(mysum$coefficients)[i],header=TRUE)
a<-table.element(a,mysum$coefficients[i,1])
a<-table.element(a, round(mysum$coefficients[i,2],6))
a<-table.element(a, round(mysum$coefficients[i,3],4))
a<-table.element(a, round(mysum$coefficients[i,4],6))
a<-table.element(a, round(mysum$coefficients[i,4]/2,6))
a<-table.row.end(a)
}
a<-table.end(a)
table.save(a,file='mytable2.tab')
a<-table.start()
a<-table.row.start(a)
a<-table.element(a, 'Multiple Linear Regression - Regression Statistics', 2, TRUE)
a<-table.row.end(a)
a<-table.row.start(a)
a<-table.element(a, 'Multiple R',1,TRUE)
a<-table.element(a, sqrt(mysum$r.squared))
a<-table.row.end(a)
a<-table.row.start(a)
a<-table.element(a, 'R-squared',1,TRUE)
a<-table.element(a, mysum$r.squared)
a<-table.row.end(a)
a<-table.row.start(a)
a<-table.element(a, 'Adjusted R-squared',1,TRUE)
a<-table.element(a, mysum$adj.r.squared)
a<-table.row.end(a)
a<-table.row.start(a)
a<-table.element(a, 'F-TEST (value)',1,TRUE)
a<-table.element(a, mysum$fstatistic[1])
a<-table.row.end(a)
a<-table.row.start(a)
a<-table.element(a, 'F-TEST (DF numerator)',1,TRUE)
a<-table.element(a, mysum$fstatistic[2])
a<-table.row.end(a)
a<-table.row.start(a)
a<-table.element(a, 'F-TEST (DF denominator)',1,TRUE)
a<-table.element(a, mysum$fstatistic[3])
a<-table.row.end(a)
a<-table.row.start(a)
a<-table.element(a, 'p-value',1,TRUE)
a<-table.element(a, 1-pf(mysum$fstatistic[1],mysum$fstatistic[2],mysum$fstatistic[3]))
a<-table.row.end(a)
a<-table.row.start(a)
a<-table.element(a, 'Multiple Linear Regression - Residual Statistics', 2, TRUE)
a<-table.row.end(a)
a<-table.row.start(a)
a<-table.element(a, 'Residual Standard Deviation',1,TRUE)
a<-table.element(a, mysum$sigma)
a<-table.row.end(a)
a<-table.row.start(a)
a<-table.element(a, 'Sum Squared Residuals',1,TRUE)
a<-table.element(a, sum(myerror*myerror))
a<-table.row.end(a)
a<-table.end(a)
table.save(a,file='mytable3.tab')
a<-table.start()
a<-table.row.start(a)
a<-table.element(a, 'Multiple Linear Regression - Actuals, Interpolation, and Residuals', 4, TRUE)
a<-table.row.end(a)
a<-table.row.start(a)
a<-table.element(a, 'Time or Index', 1, TRUE)
a<-table.element(a, 'Actuals', 1, TRUE)
a<-table.element(a, 'Interpolation
Forecast', 1, TRUE)
a<-table.element(a, 'Residuals
Prediction Error', 1, TRUE)
a<-table.row.end(a)
for (i in 1:n) {
a<-table.row.start(a)
a<-table.element(a,i, 1, TRUE)
a<-table.element(a,x[i])
a<-table.element(a,x[i]-mysum$resid[i])
a<-table.element(a,mysum$resid[i])
a<-table.row.end(a)
}
a<-table.end(a)
table.save(a,file='mytable4.tab')
if (n > n25) {
a<-table.start()
a<-table.row.start(a)
a<-table.element(a,'Goldfeld-Quandt test for Heteroskedasticity',4,TRUE)
a<-table.row.end(a)
a<-table.row.start(a)
a<-table.element(a,'p-values',header=TRUE)
a<-table.element(a,'Alternative Hypothesis',3,header=TRUE)
a<-table.row.end(a)
a<-table.row.start(a)
a<-table.element(a,'breakpoint index',header=TRUE)
a<-table.element(a,'greater',header=TRUE)
a<-table.element(a,'2-sided',header=TRUE)
a<-table.element(a,'less',header=TRUE)
a<-table.row.end(a)
for (mypoint in kp3:nmkm3) {
a<-table.row.start(a)
a<-table.element(a,mypoint,header=TRUE)
a<-table.element(a,gqarr[mypoint-kp3+1,1])
a<-table.element(a,gqarr[mypoint-kp3+1,2])
a<-table.element(a,gqarr[mypoint-kp3+1,3])
a<-table.row.end(a)
}
a<-table.end(a)
table.save(a,file='mytable5.tab')
a<-table.start()
a<-table.row.start(a)
a<-table.element(a,'Meta Analysis of Goldfeld-Quandt test for Heteroskedasticity',4,TRUE)
a<-table.row.end(a)
a<-table.row.start(a)
a<-table.element(a,'Description',header=TRUE)
a<-table.element(a,'# significant tests',header=TRUE)
a<-table.element(a,'% significant tests',header=TRUE)
a<-table.element(a,'OK/NOK',header=TRUE)
a<-table.row.end(a)
a<-table.row.start(a)
a<-table.element(a,'1% type I error level',header=TRUE)
a<-table.element(a,numsignificant1)
a<-table.element(a,numsignificant1/numgqtests)
if (numsignificant1/numgqtests < 0.01) dum <- 'OK' else dum <- 'NOK'
a<-table.element(a,dum)
a<-table.row.end(a)
a<-table.row.start(a)
a<-table.element(a,'5% type I error level',header=TRUE)
a<-table.element(a,numsignificant5)
a<-table.element(a,numsignificant5/numgqtests)
if (numsignificant5/numgqtests < 0.05) dum <- 'OK' else dum <- 'NOK'
a<-table.element(a,dum)
a<-table.row.end(a)
a<-table.row.start(a)
a<-table.element(a,'10% type I error level',header=TRUE)
a<-table.element(a,numsignificant10)
a<-table.element(a,numsignificant10/numgqtests)
if (numsignificant10/numgqtests < 0.1) dum <- 'OK' else dum <- 'NOK'
a<-table.element(a,dum)
a<-table.row.end(a)
a<-table.end(a)
table.save(a,file='mytable6.tab')
}