Free Statistics

of Irreproducible Research!

Author's title

Author*The author of this computation has been verified*
R Software Modulerwasp_twosampletests_mean.wasp
Title produced by softwarePaired and Unpaired Two Samples Tests about the Mean
Date of computationTue, 29 Nov 2011 07:03:26 -0500
Cite this page as followsStatistical Computations at FreeStatistics.org, Office for Research Development and Education, URL https://freestatistics.org/blog/index.php?v=date/2011/Nov/29/t1322568428fej5scu59j569ob.htm/, Retrieved Fri, 19 Apr 2024 22:04:51 +0000
Statistical Computations at FreeStatistics.org, Office for Research Development and Education, URL https://freestatistics.org/blog/index.php?pk=148225, Retrieved Fri, 19 Apr 2024 22:04:51 +0000
QR Codes:

Original text written by user:
IsPrivate?No (this computation is public)
User-defined keywords
Estimated Impact66
Family? (F = Feedback message, R = changed R code, M = changed R Module, P = changed Parameters, D = changed Data)
-       [Paired and Unpaired Two Samples Tests about the Mean] [two sample t-test...] [2011-11-29 12:03:26] [3bdb54d050744f47368418ea7c7e8e96] [Current]
Feedback Forum

Post a new message
Dataseries X:
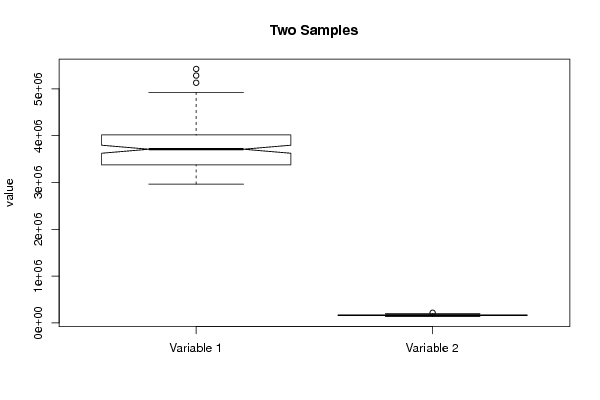
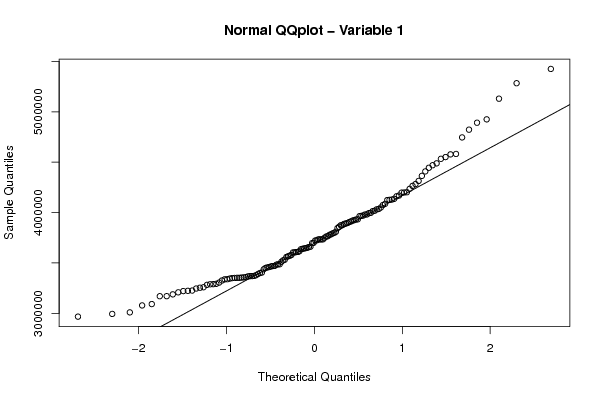
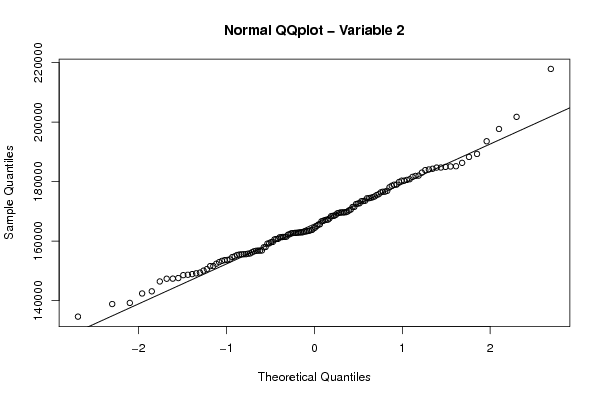
4581945	193572
3874038	180303
4086290	178978
4364364	183016
3793586	173405
4533914	185085
4823043	197695
3981535	176908
4746356	201772
5284534	217889
4264830	186296
3924674	178952
3734753	182010
3762290	160719
3609739	175751
3877594	184732
3636415	181583
3578195	180793
3604342	184314
3459513	174547
3366571	181904
3371277	180553
3724848	188285
3350830	184075
3305159	184710
3390736	185165
3349758	183858
3253655	176374
3734250	179867
3455433	152919
2966726	134569
2993716	170594
3009320	175472
3169713	172444
3170061	167593
3368934	178081
3292638	176617
3337344	167033
3208306	171483
3359130	174373
3223078	169615
3437159	169627
3400156	167165
3657576	171452
3765613	172603
3481921	164246
3604800	164538
3981340	184937
3734078	173475
4018173	167173
3887417	162951
3919880	162925
4014466	165517
4197758	176580
3896531	163429
3964742	161378
4201847	169646
4050512	168842
3997402	162903
4314479	166636
4925744	174396
5130631	189289
4444855	174750
3967319	165089
3931250	162605
4235952	169358
4169219	172718
3779064	162125
3558810	162719
3699466	169897
3650693	169705
3525633	169465
3470276	163228
3859094	180314
3661155	168509
3356365	160680
3344440	173548
3338684	159224
3404294	162800
3289319	163336
3469252	163625
3571850	148873
3639914	142365
3091730	168464
3078149	162302
3188115	161287
3246082	155836
3486992	161265
3378187	162697
3282306	178590
3288345	162764
3325749	155748
3352262	168340
3531954	156793
3722622	170320
3809365	149149
3750617	166763
3615286	165642
3696556	154608
4123959	160565
4136163	157996
3933392	155448
4035576	155564
4551202	159700
4032195	157902
3970893	152370
4489016	156769
5426127	175004
4578224	159617
4126390	151568
4892100	155308
4128697	139183
4408721	153829
4199465	155532
4074767	147321
4161758	143100
3891319	146407
4470302	159126
4283111	163729
3845962	153325
3911471	147558
3798478	153640
3644313	148529
3784029	163150
3647134	156807
3994662	156221
3607836	154862
3566008	151588
3511412	161384
3258665	148655
3486573	155579
3369443	150044
3465544	156718
3905224	153577
3733881	138813
3220642	149389
3225812	161463
3354461	150575
3352261	147350
3450652	156568


Summary of computational transaction
Raw Inputview raw input (R code)
Raw Outputview raw output of R engine
Computing time2 seconds
R Server'Gwilym Jenkins' @ jenkins.wessa.net

\begin{tabular}{lllllllll}
\hline
Summary of computational transaction \tabularnewline
Raw Input & view raw input (R code)  \tabularnewline
Raw Output & view raw output of R engine  \tabularnewline
Computing time & 2 seconds \tabularnewline
R Server & 'Gwilym Jenkins' @ jenkins.wessa.net \tabularnewline
\hline
\end{tabular}
%Source: https://freestatistics.org/blog/index.php?pk=148225&T=0

[TABLE]
[ROW][C]Summary of computational transaction[/C][/ROW]
[ROW][C]Raw Input[/C][C]view raw input (R code) [/C][/ROW]
[ROW][C]Raw Output[/C][C]view raw output of R engine [/C][/ROW]
[ROW][C]Computing time[/C][C]2 seconds[/C][/ROW]
[ROW][C]R Server[/C][C]'Gwilym Jenkins' @ jenkins.wessa.net[/C][/ROW]
[/TABLE]
Source: https://freestatistics.org/blog/index.php?pk=148225&T=0

Globally Unique Identifier (entire table): ba.freestatistics.org/blog/index.php?pk=148225&T=0

As an alternative you can also use a QR Code:  

The GUIDs for individual cells are displayed in the table below:

Summary of computational transaction
Raw Inputview raw input (R code)
Raw Outputview raw output of R engine
Computing time2 seconds
R Server'Gwilym Jenkins' @ jenkins.wessa.net


Two Sample t-test (paired)
Difference: Mean1 - Mean23603455.52142857
t-stat90.2243079270848
df139
p-value2.9633925859432e-125
H0 value0
Alternativetwo.sided
CI Level0.95
CI[3524489.30764594,3682421.7352112]
F-test to compare two variances
F-stat1273.49349484737
df139
p-value0
H0 value1
Alternativetwo.sided
CI Level0.95
CI[912.025284270302,1778.22447402447]

\begin{tabular}{lllllllll}
\hline
Two Sample t-test (paired) \tabularnewline
Difference: Mean1 - Mean2 & 3603455.52142857 \tabularnewline
t-stat & 90.2243079270848 \tabularnewline
df & 139 \tabularnewline
p-value & 2.9633925859432e-125 \tabularnewline
H0 value & 0 \tabularnewline
Alternative & two.sided \tabularnewline
CI Level & 0.95 \tabularnewline
CI & [3524489.30764594,3682421.7352112] \tabularnewline
F-test to compare two variances \tabularnewline
F-stat & 1273.49349484737 \tabularnewline
df & 139 \tabularnewline
p-value & 0 \tabularnewline
H0 value & 1 \tabularnewline
Alternative & two.sided \tabularnewline
CI Level & 0.95 \tabularnewline
CI & [912.025284270302,1778.22447402447] \tabularnewline
\hline
\end{tabular}
%Source: https://freestatistics.org/blog/index.php?pk=148225&T=1

[TABLE]
[ROW][C]Two Sample t-test (paired)[/C][/ROW]
[ROW][C]Difference: Mean1 - Mean2[/C][C]3603455.52142857[/C][/ROW]
[ROW][C]t-stat[/C][C]90.2243079270848[/C][/ROW]
[ROW][C]df[/C][C]139[/C][/ROW]
[ROW][C]p-value[/C][C]2.9633925859432e-125[/C][/ROW]
[ROW][C]H0 value[/C][C]0[/C][/ROW]
[ROW][C]Alternative[/C][C]two.sided[/C][/ROW]
[ROW][C]CI Level[/C][C]0.95[/C][/ROW]
[ROW][C]CI[/C][C][3524489.30764594,3682421.7352112][/C][/ROW]
[ROW][C]F-test to compare two variances[/C][/ROW]
[ROW][C]F-stat[/C][C]1273.49349484737[/C][/ROW]
[ROW][C]df[/C][C]139[/C][/ROW]
[ROW][C]p-value[/C][C]0[/C][/ROW]
[ROW][C]H0 value[/C][C]1[/C][/ROW]
[ROW][C]Alternative[/C][C]two.sided[/C][/ROW]
[ROW][C]CI Level[/C][C]0.95[/C][/ROW]
[ROW][C]CI[/C][C][912.025284270302,1778.22447402447][/C][/ROW]
[/TABLE]
Source: https://freestatistics.org/blog/index.php?pk=148225&T=1

Globally Unique Identifier (entire table): ba.freestatistics.org/blog/index.php?pk=148225&T=1

As an alternative you can also use a QR Code:  

The GUIDs for individual cells are displayed in the table below:

Two Sample t-test (paired)
Difference: Mean1 - Mean23603455.52142857
t-stat90.2243079270848
df139
p-value2.9633925859432e-125
H0 value0
Alternativetwo.sided
CI Level0.95
CI[3524489.30764594,3682421.7352112]
F-test to compare two variances
F-stat1273.49349484737
df139
p-value0
H0 value1
Alternativetwo.sided
CI Level0.95
CI[912.025284270302,1778.22447402447]


Welch Two Sample t-test (paired)
Difference: Mean1 - Mean23603455.52142857
t-stat90.2243079270848
df139
p-value2.9633925859432e-125
H0 value0
Alternativetwo.sided
CI Level0.95
CI[3524489.30764594,3682421.7352112]

\begin{tabular}{lllllllll}
\hline
Welch Two Sample t-test (paired) \tabularnewline
Difference: Mean1 - Mean2 & 3603455.52142857 \tabularnewline
t-stat & 90.2243079270848 \tabularnewline
df & 139 \tabularnewline
p-value & 2.9633925859432e-125 \tabularnewline
H0 value & 0 \tabularnewline
Alternative & two.sided \tabularnewline
CI Level & 0.95 \tabularnewline
CI & [3524489.30764594,3682421.7352112] \tabularnewline
\hline
\end{tabular}
%Source: https://freestatistics.org/blog/index.php?pk=148225&T=2

[TABLE]
[ROW][C]Welch Two Sample t-test (paired)[/C][/ROW]
[ROW][C]Difference: Mean1 - Mean2[/C][C]3603455.52142857[/C][/ROW]
[ROW][C]t-stat[/C][C]90.2243079270848[/C][/ROW]
[ROW][C]df[/C][C]139[/C][/ROW]
[ROW][C]p-value[/C][C]2.9633925859432e-125[/C][/ROW]
[ROW][C]H0 value[/C][C]0[/C][/ROW]
[ROW][C]Alternative[/C][C]two.sided[/C][/ROW]
[ROW][C]CI Level[/C][C]0.95[/C][/ROW]
[ROW][C]CI[/C][C][3524489.30764594,3682421.7352112][/C][/ROW]
[/TABLE]
Source: https://freestatistics.org/blog/index.php?pk=148225&T=2

Globally Unique Identifier (entire table): ba.freestatistics.org/blog/index.php?pk=148225&T=2

As an alternative you can also use a QR Code:  

The GUIDs for individual cells are displayed in the table below:

Welch Two Sample t-test (paired)
Difference: Mean1 - Mean23603455.52142857
t-stat90.2243079270848
df139
p-value2.9633925859432e-125
H0 value0
Alternativetwo.sided
CI Level0.95
CI[3524489.30764594,3682421.7352112]


Wicoxon rank sum test with continuity correction (paired)
W9870
p-value1.02240949948294e-24
H0 value0
Alternativetwo.sided
Kolmogorov-Smirnov Test to compare Distributions of two Samples
KS Statistic1
p-value0
Kolmogorov-Smirnov Test to compare Distributional Shape of two Samples
KS Statistic0.542857142857143
p-value0

\begin{tabular}{lllllllll}
\hline
Wicoxon rank sum test with continuity correction (paired) \tabularnewline
W & 9870 \tabularnewline
p-value & 1.02240949948294e-24 \tabularnewline
H0 value & 0 \tabularnewline
Alternative & two.sided \tabularnewline
Kolmogorov-Smirnov Test to compare Distributions of two Samples \tabularnewline
KS Statistic & 1 \tabularnewline
p-value & 0 \tabularnewline
Kolmogorov-Smirnov Test to compare Distributional Shape of two Samples \tabularnewline
KS Statistic & 0.542857142857143 \tabularnewline
p-value & 0 \tabularnewline
\hline
\end{tabular}
%Source: https://freestatistics.org/blog/index.php?pk=148225&T=3

[TABLE]
[ROW][C]Wicoxon rank sum test with continuity correction (paired)[/C][/ROW]
[ROW][C]W[/C][C]9870[/C][/ROW]
[ROW][C]p-value[/C][C]1.02240949948294e-24[/C][/ROW]
[ROW][C]H0 value[/C][C]0[/C][/ROW]
[ROW][C]Alternative[/C][C]two.sided[/C][/ROW]
[ROW][C]Kolmogorov-Smirnov Test to compare Distributions of two Samples[/C][/ROW]
[ROW][C]KS Statistic[/C][C]1[/C][/ROW]
[ROW][C]p-value[/C][C]0[/C][/ROW]
[ROW][C]Kolmogorov-Smirnov Test to compare Distributional Shape of two Samples[/C][/ROW]
[ROW][C]KS Statistic[/C][C]0.542857142857143[/C][/ROW]
[ROW][C]p-value[/C][C]0[/C][/ROW]
[/TABLE]
Source: https://freestatistics.org/blog/index.php?pk=148225&T=3

Globally Unique Identifier (entire table): ba.freestatistics.org/blog/index.php?pk=148225&T=3

As an alternative you can also use a QR Code:  

The GUIDs for individual cells are displayed in the table below:

Wicoxon rank sum test with continuity correction (paired)
W9870
p-value1.02240949948294e-24
H0 value0
Alternativetwo.sided
Kolmogorov-Smirnov Test to compare Distributions of two Samples
KS Statistic1
p-value0
Kolmogorov-Smirnov Test to compare Distributional Shape of two Samples
KS Statistic0.542857142857143
p-value0


Parameters (Session):
par1 = 1 ; par2 = 2 ; par3 = 0.95 ; par4 = two.sided ; par5 = paired ; par6 = 0.0 ;
Parameters (R input):
par1 = 1 ; par2 = 2 ; par3 = 0.95 ; par4 = two.sided ; par5 = paired ; par6 = 0.0 ;
R code (references can be found in the software module):
par1 <- as.numeric(par1) #column number of first sample
par2 <- as.numeric(par2) #column number of second sample
par3 <- as.numeric(par3) #confidence (= 1 - alpha)
if (par5 == 'unpaired') paired <- FALSE else paired <- TRUE
par6 <- as.numeric(par6) #H0
z <- t(y)
if (par1 == par2) stop('Please, select two different column numbers')
if (par1 < 1) stop('Please, select a column number greater than zero for the first sample')
if (par2 < 1) stop('Please, select a column number greater than zero for the second sample')
if (par1 > length(z[1,])) stop('The column number for the first sample should be smaller')
if (par2 > length(z[1,])) stop('The column number for the second sample should be smaller')
if (par3 <= 0) stop('The confidence level should be larger than zero')
if (par3 >= 1) stop('The confidence level should be smaller than zero')
(r.t <- t.test(z[,par1],z[,par2],var.equal=TRUE,alternative=par4,paired=paired,mu=par6,conf.level=par3))
(v.t <- var.test(z[,par1],z[,par2],conf.level=par3))
(r.w <- t.test(z[,par1],z[,par2],var.equal=FALSE,alternative=par4,paired=paired,mu=par6,conf.level=par3))
(w.t <- wilcox.test(z[,par1],z[,par2],alternative=par4,paired=paired,mu=par6,conf.level=par3))
(ks.t <- ks.test(z[,par1],z[,par2],alternative=par4))
m1 <- mean(z[,par1],na.rm=T)
m2 <- mean(z[,par2],na.rm=T)
mdiff <- m1 - m2
newsam1 <- z[!is.na(z[,par1]),par1]
newsam2 <- z[,par2]+mdiff
newsam2 <- newsam2[!is.na(newsam2)]
(ks1.t <- ks.test(newsam1,newsam2,alternative=par4))
mydf <- data.frame(cbind(z[,par1],z[,par2]))
colnames(mydf) <- c('Variable 1','Variable 2')
bitmap(file='test1.png')
boxplot(mydf, notch=TRUE, ylab='value',main=main)
dev.off()
bitmap(file='test2.png')
qqnorm(z[,par1],main='Normal QQplot - Variable 1')
qqline(z[,par1])
dev.off()
bitmap(file='test3.png')
qqnorm(z[,par2],main='Normal QQplot - Variable 2')
qqline(z[,par2])
dev.off()
load(file='createtable')
a<-table.start()
a<-table.row.start(a)
a<-table.element(a,paste('Two Sample t-test (',par5,')',sep=''),2,TRUE)
a<-table.row.end(a)
if(!paired){
a<-table.row.start(a)
a<-table.element(a,'Mean of Sample 1',header=TRUE)
a<-table.element(a,r.t$estimate[[1]])
a<-table.row.end(a)
a<-table.row.start(a)
a<-table.element(a,'Mean of Sample 2',header=TRUE)
a<-table.element(a,r.t$estimate[[2]])
a<-table.row.end(a)
} else {
a<-table.row.start(a)
a<-table.element(a,'Difference: Mean1 - Mean2',header=TRUE)
a<-table.element(a,r.t$estimate)
a<-table.row.end(a)
}
a<-table.row.start(a)
a<-table.element(a,'t-stat',header=TRUE)
a<-table.element(a,r.t$statistic[[1]])
a<-table.row.end(a)
a<-table.row.start(a)
a<-table.element(a,'df',header=TRUE)
a<-table.element(a,r.t$parameter[[1]])
a<-table.row.end(a)
a<-table.row.start(a)
a<-table.element(a,'p-value',header=TRUE)
a<-table.element(a,r.t$p.value)
a<-table.row.end(a)
a<-table.row.start(a)
a<-table.element(a,'H0 value',header=TRUE)
a<-table.element(a,r.t$null.value[[1]])
a<-table.row.end(a)
a<-table.row.start(a)
a<-table.element(a,'Alternative',header=TRUE)
a<-table.element(a,r.t$alternative)
a<-table.row.end(a)
a<-table.row.start(a)
a<-table.element(a,'CI Level',header=TRUE)
a<-table.element(a,attr(r.t$conf.int,'conf.level'))
a<-table.row.end(a)
a<-table.row.start(a)
a<-table.element(a,'CI',header=TRUE)
a<-table.element(a,paste('[',r.t$conf.int[1],',',r.t$conf.int[2],']',sep=''))
a<-table.row.end(a)
a<-table.row.start(a)
a<-table.element(a,'F-test to compare two variances',2,TRUE)
a<-table.row.end(a)
a<-table.row.start(a)
a<-table.element(a,'F-stat',header=TRUE)
a<-table.element(a,v.t$statistic[[1]])
a<-table.row.end(a)
a<-table.row.start(a)
a<-table.element(a,'df',header=TRUE)
a<-table.element(a,v.t$parameter[[1]])
a<-table.row.end(a)
a<-table.row.start(a)
a<-table.element(a,'p-value',header=TRUE)
a<-table.element(a,v.t$p.value)
a<-table.row.end(a)
a<-table.row.start(a)
a<-table.element(a,'H0 value',header=TRUE)
a<-table.element(a,v.t$null.value[[1]])
a<-table.row.end(a)
a<-table.row.start(a)
a<-table.element(a,'Alternative',header=TRUE)
a<-table.element(a,v.t$alternative)
a<-table.row.end(a)
a<-table.row.start(a)
a<-table.element(a,'CI Level',header=TRUE)
a<-table.element(a,attr(v.t$conf.int,'conf.level'))
a<-table.row.end(a)
a<-table.row.start(a)
a<-table.element(a,'CI',header=TRUE)
a<-table.element(a,paste('[',v.t$conf.int[1],',',v.t$conf.int[2],']',sep=''))
a<-table.row.end(a)
a<-table.end(a)
table.save(a,file='mytable.tab')
a<-table.start()
a<-table.row.start(a)
a<-table.element(a,paste('Welch Two Sample t-test (',par5,')',sep=''),2,TRUE)
a<-table.row.end(a)
if(!paired){
a<-table.row.start(a)
a<-table.element(a,'Mean of Sample 1',header=TRUE)
a<-table.element(a,r.w$estimate[[1]])
a<-table.row.end(a)
a<-table.row.start(a)
a<-table.element(a,'Mean of Sample 2',header=TRUE)
a<-table.element(a,r.w$estimate[[2]])
a<-table.row.end(a)
} else {
a<-table.row.start(a)
a<-table.element(a,'Difference: Mean1 - Mean2',header=TRUE)
a<-table.element(a,r.w$estimate)
a<-table.row.end(a)
}
a<-table.row.start(a)
a<-table.element(a,'t-stat',header=TRUE)
a<-table.element(a,r.w$statistic[[1]])
a<-table.row.end(a)
a<-table.row.start(a)
a<-table.element(a,'df',header=TRUE)
a<-table.element(a,r.w$parameter[[1]])
a<-table.row.end(a)
a<-table.row.start(a)
a<-table.element(a,'p-value',header=TRUE)
a<-table.element(a,r.w$p.value)
a<-table.row.end(a)
a<-table.row.start(a)
a<-table.element(a,'H0 value',header=TRUE)
a<-table.element(a,r.w$null.value[[1]])
a<-table.row.end(a)
a<-table.row.start(a)
a<-table.element(a,'Alternative',header=TRUE)
a<-table.element(a,r.w$alternative)
a<-table.row.end(a)
a<-table.row.start(a)
a<-table.element(a,'CI Level',header=TRUE)
a<-table.element(a,attr(r.w$conf.int,'conf.level'))
a<-table.row.end(a)
a<-table.row.start(a)
a<-table.element(a,'CI',header=TRUE)
a<-table.element(a,paste('[',r.w$conf.int[1],',',r.w$conf.int[2],']',sep=''))
a<-table.row.end(a)
a<-table.end(a)
table.save(a,file='mytable1.tab')
a<-table.start()
a<-table.row.start(a)
a<-table.element(a,paste('Wicoxon rank sum test with continuity correction (',par5,')',sep=''),2,TRUE)
a<-table.row.end(a)
a<-table.row.start(a)
a<-table.element(a,'W',header=TRUE)
a<-table.element(a,w.t$statistic[[1]])
a<-table.row.end(a)
a<-table.row.start(a)
a<-table.element(a,'p-value',header=TRUE)
a<-table.element(a,w.t$p.value)
a<-table.row.end(a)
a<-table.row.start(a)
a<-table.element(a,'H0 value',header=TRUE)
a<-table.element(a,w.t$null.value[[1]])
a<-table.row.end(a)
a<-table.row.start(a)
a<-table.element(a,'Alternative',header=TRUE)
a<-table.element(a,w.t$alternative)
a<-table.row.end(a)
a<-table.row.start(a)
a<-table.element(a,'Kolmogorov-Smirnov Test to compare Distributions of two Samples',2,TRUE)
a<-table.row.end(a)
a<-table.row.start(a)
a<-table.element(a,'KS Statistic',header=TRUE)
a<-table.element(a,ks.t$statistic[[1]])
a<-table.row.end(a)
a<-table.row.start(a)
a<-table.element(a,'p-value',header=TRUE)
a<-table.element(a,ks.t$p.value)
a<-table.row.end(a)
a<-table.row.start(a)
a<-table.element(a,'Kolmogorov-Smirnov Test to compare Distributional Shape of two Samples',2,TRUE)
a<-table.row.end(a)
a<-table.row.start(a)
a<-table.element(a,'KS Statistic',header=TRUE)
a<-table.element(a,ks1.t$statistic[[1]])
a<-table.row.end(a)
a<-table.row.start(a)
a<-table.element(a,'p-value',header=TRUE)
a<-table.element(a,ks1.t$p.value)
a<-table.row.end(a)
a<-table.end(a)
table.save(a,file='mytable2.tab')