Free Statistics

of Irreproducible Research!

Author's title

Author*The author of this computation has been verified*
R Software Modulerwasp_exponentialsmoothing.wasp
Title produced by softwareExponential Smoothing
Date of computationTue, 29 Nov 2011 06:02:24 -0500
Cite this page as followsStatistical Computations at FreeStatistics.org, Office for Research Development and Education, URL https://freestatistics.org/blog/index.php?v=date/2011/Nov/29/t13225645645ugwsz4vscztypj.htm/, Retrieved Fri, 26 Apr 2024 09:21:32 +0000
Statistical Computations at FreeStatistics.org, Office for Research Development and Education, URL https://freestatistics.org/blog/index.php?pk=148189, Retrieved Fri, 26 Apr 2024 09:21:32 +0000
QR Codes:

Original text written by user:
IsPrivate?No (this computation is public)
User-defined keywords
Estimated Impact84
Family? (F = Feedback message, R = changed R code, M = changed R Module, P = changed Parameters, D = changed Data)
-     [Exponential Smoothing] [Single] [2011-11-29 10:45:34] [f2faabc3a2466a29562900bc59f67898]
- R P   [Exponential Smoothing] [Double] [2011-11-29 10:57:03] [f2faabc3a2466a29562900bc59f67898]
-   P       [Exponential Smoothing] [Triple] [2011-11-29 11:02:24] [5988e21ec0676b551e455a86717edc1d] [Current]
Feedback Forum

Post a new message
Dataseries X:
16111
15554
15220
14807
14291
14653
17006
18032
16558
16102
15055
15484
14596
14609
13923
14226
14056
14278
16142
16509
15680
14086
13129
13086
13096
12280
11534
11135
10903
10926
13220
13581
11788
11088
10434
11061
10828
10270
10360
9899
9395
9944
12117
12474
11106
10643
10227
11273
11516
11583
11605
11414
11181
12000
14007
14582
13251
12806
12645
13869
13342
13079
12513
12331
11882
12388
14394
14635
13218
12554
12031
12429


Summary of computational transaction
Raw Inputview raw input (R code)
Raw Outputview raw output of R engine
Computing time2 seconds
R Server'Gwilym Jenkins' @ jenkins.wessa.net

\begin{tabular}{lllllllll}
\hline
Summary of computational transaction \tabularnewline
Raw Input & view raw input (R code)  \tabularnewline
Raw Output & view raw output of R engine  \tabularnewline
Computing time & 2 seconds \tabularnewline
R Server & 'Gwilym Jenkins' @ jenkins.wessa.net \tabularnewline
\hline
\end{tabular}
%Source: https://freestatistics.org/blog/index.php?pk=148189&T=0

[TABLE]
[ROW][C]Summary of computational transaction[/C][/ROW]
[ROW][C]Raw Input[/C][C]view raw input (R code) [/C][/ROW]
[ROW][C]Raw Output[/C][C]view raw output of R engine [/C][/ROW]
[ROW][C]Computing time[/C][C]2 seconds[/C][/ROW]
[ROW][C]R Server[/C][C]'Gwilym Jenkins' @ jenkins.wessa.net[/C][/ROW]
[/TABLE]
Source: https://freestatistics.org/blog/index.php?pk=148189&T=0

Globally Unique Identifier (entire table): ba.freestatistics.org/blog/index.php?pk=148189&T=0

As an alternative you can also use a QR Code:  

The GUIDs for individual cells are displayed in the table below:

Summary of computational transaction
Raw Inputview raw input (R code)
Raw Outputview raw output of R engine
Computing time2 seconds
R Server'Gwilym Jenkins' @ jenkins.wessa.net


Estimated Parameters of Exponential Smoothing
ParameterValue
alpha0.718586430766471
beta0.120942347498989
gamma1

\begin{tabular}{lllllllll}
\hline
Estimated Parameters of Exponential Smoothing \tabularnewline
Parameter & Value \tabularnewline
alpha & 0.718586430766471 \tabularnewline
beta & 0.120942347498989 \tabularnewline
gamma & 1 \tabularnewline
\hline
\end{tabular}
%Source: https://freestatistics.org/blog/index.php?pk=148189&T=1

[TABLE]
[ROW][C]Estimated Parameters of Exponential Smoothing[/C][/ROW]
[ROW][C]Parameter[/C][C]Value[/C][/ROW]
[ROW][C]alpha[/C][C]0.718586430766471[/C][/ROW]
[ROW][C]beta[/C][C]0.120942347498989[/C][/ROW]
[ROW][C]gamma[/C][C]1[/C][/ROW]
[/TABLE]
Source: https://freestatistics.org/blog/index.php?pk=148189&T=1

Globally Unique Identifier (entire table): ba.freestatistics.org/blog/index.php?pk=148189&T=1

As an alternative you can also use a QR Code:  

The GUIDs for individual cells are displayed in the table below:

Estimated Parameters of Exponential Smoothing
ParameterValue
alpha0.718586430766471
beta0.120942347498989
gamma1


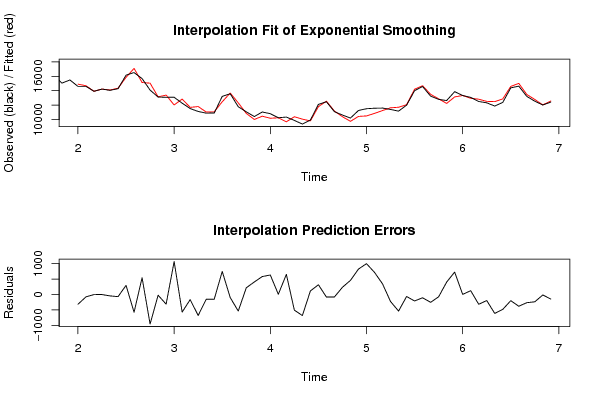
Interpolation Forecasts of Exponential Smoothing
tObservedFittedResiduals
131459614912.5894764957-316.589476495717
141460914685.5976502755-76.5976502754584
151392313925.98711463-2.98711462999199
161422614228.5541749737-2.55417497369854
171405614101.8770295087-45.8770295087397
181427814347.9982759895-69.9982759895101
191614215846.8279447983295.172055201727
201650917083.9250660417-574.92506604172
211568015136.7335518573543.266448142704
221408615043.1065651383-957.106565138323
231312913152.9021226388-23.9021226388159
241308613398.6251218812-312.62512188117
251309612029.8219732871066.17802671302
261228012849.9298209176-569.929820917609
271153411699.5829575639-165.582957563876
281113511814.3523559087-679.352355908735
291090311059.2463933806-156.246393380621
301092611079.7785490108-153.778549010829
311322012474.3964826301745.603517369853
321358113682.6840357291-101.684035729102
331178812323.7332100756-535.73321007559
341108810872.2550309132215.744969086772
351043410029.1204544854404.879545514561
361106110480.6322033835580.367796616451
371082810198.066003696629.933996304022
381027010262.88941002587.11058997415421
39103609709.75135519001650.248644809993
40989910405.853207172-506.853207172035
41939510076.5719976917-681.571997691672
4299449829.31212604586114.687873954135
431211711802.2817982116314.71820178837
441247412557.3927099031-83.3927099031225
451110611185.9180234284-79.9180234284449
461064310409.5519488674233.448051132578
47102279769.99547426949457.004525730506
481127310450.5102260992822.489773900761
491151610519.0823423497996.91765765032
501158310867.4420610534715.557938946635
511160511261.0396335229343.960366477088
521141411641.4711648771-227.471164877059
531118111718.1107069267-537.110706926664
541200012065.6207104368-65.6207104368314
551400714216.5277746689-209.527774668906
561458214688.5413515031-106.541351503118
571325113505.0509207655-254.050920765472
581280612880.248046138-74.2480461380073
591264512244.2633205262400.736679473786
601386913144.0733340536724.92666594641
611334213340.02139372721.97860627284717
621307912956.1823683206122.817631679414
631251312829.6880042326-316.688004232552
641233112527.5784804994-196.578480499446
651188212494.9656109611-612.965610961062
661238812869.7439234733-481.743923473252
671439414594.0617831402-200.061783140221
681463515015.6106263407-380.610626340687
691321813483.5992119318-265.599211931756
701255412790.0258999214-236.025899921362
711203112046.326276337-15.3262763369512
721242912577.1008785278-148.100878527761

\begin{tabular}{lllllllll}
\hline
Interpolation Forecasts of Exponential Smoothing \tabularnewline
t & Observed & Fitted & Residuals \tabularnewline
13 & 14596 & 14912.5894764957 & -316.589476495717 \tabularnewline
14 & 14609 & 14685.5976502755 & -76.5976502754584 \tabularnewline
15 & 13923 & 13925.98711463 & -2.98711462999199 \tabularnewline
16 & 14226 & 14228.5541749737 & -2.55417497369854 \tabularnewline
17 & 14056 & 14101.8770295087 & -45.8770295087397 \tabularnewline
18 & 14278 & 14347.9982759895 & -69.9982759895101 \tabularnewline
19 & 16142 & 15846.8279447983 & 295.172055201727 \tabularnewline
20 & 16509 & 17083.9250660417 & -574.92506604172 \tabularnewline
21 & 15680 & 15136.7335518573 & 543.266448142704 \tabularnewline
22 & 14086 & 15043.1065651383 & -957.106565138323 \tabularnewline
23 & 13129 & 13152.9021226388 & -23.9021226388159 \tabularnewline
24 & 13086 & 13398.6251218812 & -312.62512188117 \tabularnewline
25 & 13096 & 12029.821973287 & 1066.17802671302 \tabularnewline
26 & 12280 & 12849.9298209176 & -569.929820917609 \tabularnewline
27 & 11534 & 11699.5829575639 & -165.582957563876 \tabularnewline
28 & 11135 & 11814.3523559087 & -679.352355908735 \tabularnewline
29 & 10903 & 11059.2463933806 & -156.246393380621 \tabularnewline
30 & 10926 & 11079.7785490108 & -153.778549010829 \tabularnewline
31 & 13220 & 12474.3964826301 & 745.603517369853 \tabularnewline
32 & 13581 & 13682.6840357291 & -101.684035729102 \tabularnewline
33 & 11788 & 12323.7332100756 & -535.73321007559 \tabularnewline
34 & 11088 & 10872.2550309132 & 215.744969086772 \tabularnewline
35 & 10434 & 10029.1204544854 & 404.879545514561 \tabularnewline
36 & 11061 & 10480.6322033835 & 580.367796616451 \tabularnewline
37 & 10828 & 10198.066003696 & 629.933996304022 \tabularnewline
38 & 10270 & 10262.8894100258 & 7.11058997415421 \tabularnewline
39 & 10360 & 9709.75135519001 & 650.248644809993 \tabularnewline
40 & 9899 & 10405.853207172 & -506.853207172035 \tabularnewline
41 & 9395 & 10076.5719976917 & -681.571997691672 \tabularnewline
42 & 9944 & 9829.31212604586 & 114.687873954135 \tabularnewline
43 & 12117 & 11802.2817982116 & 314.71820178837 \tabularnewline
44 & 12474 & 12557.3927099031 & -83.3927099031225 \tabularnewline
45 & 11106 & 11185.9180234284 & -79.9180234284449 \tabularnewline
46 & 10643 & 10409.5519488674 & 233.448051132578 \tabularnewline
47 & 10227 & 9769.99547426949 & 457.004525730506 \tabularnewline
48 & 11273 & 10450.5102260992 & 822.489773900761 \tabularnewline
49 & 11516 & 10519.0823423497 & 996.91765765032 \tabularnewline
50 & 11583 & 10867.4420610534 & 715.557938946635 \tabularnewline
51 & 11605 & 11261.0396335229 & 343.960366477088 \tabularnewline
52 & 11414 & 11641.4711648771 & -227.471164877059 \tabularnewline
53 & 11181 & 11718.1107069267 & -537.110706926664 \tabularnewline
54 & 12000 & 12065.6207104368 & -65.6207104368314 \tabularnewline
55 & 14007 & 14216.5277746689 & -209.527774668906 \tabularnewline
56 & 14582 & 14688.5413515031 & -106.541351503118 \tabularnewline
57 & 13251 & 13505.0509207655 & -254.050920765472 \tabularnewline
58 & 12806 & 12880.248046138 & -74.2480461380073 \tabularnewline
59 & 12645 & 12244.2633205262 & 400.736679473786 \tabularnewline
60 & 13869 & 13144.0733340536 & 724.92666594641 \tabularnewline
61 & 13342 & 13340.0213937272 & 1.97860627284717 \tabularnewline
62 & 13079 & 12956.1823683206 & 122.817631679414 \tabularnewline
63 & 12513 & 12829.6880042326 & -316.688004232552 \tabularnewline
64 & 12331 & 12527.5784804994 & -196.578480499446 \tabularnewline
65 & 11882 & 12494.9656109611 & -612.965610961062 \tabularnewline
66 & 12388 & 12869.7439234733 & -481.743923473252 \tabularnewline
67 & 14394 & 14594.0617831402 & -200.061783140221 \tabularnewline
68 & 14635 & 15015.6106263407 & -380.610626340687 \tabularnewline
69 & 13218 & 13483.5992119318 & -265.599211931756 \tabularnewline
70 & 12554 & 12790.0258999214 & -236.025899921362 \tabularnewline
71 & 12031 & 12046.326276337 & -15.3262763369512 \tabularnewline
72 & 12429 & 12577.1008785278 & -148.100878527761 \tabularnewline
\hline
\end{tabular}
%Source: https://freestatistics.org/blog/index.php?pk=148189&T=2

[TABLE]
[ROW][C]Interpolation Forecasts of Exponential Smoothing[/C][/ROW]
[ROW][C]t[/C][C]Observed[/C][C]Fitted[/C][C]Residuals[/C][/ROW]
[ROW][C]13[/C][C]14596[/C][C]14912.5894764957[/C][C]-316.589476495717[/C][/ROW]
[ROW][C]14[/C][C]14609[/C][C]14685.5976502755[/C][C]-76.5976502754584[/C][/ROW]
[ROW][C]15[/C][C]13923[/C][C]13925.98711463[/C][C]-2.98711462999199[/C][/ROW]
[ROW][C]16[/C][C]14226[/C][C]14228.5541749737[/C][C]-2.55417497369854[/C][/ROW]
[ROW][C]17[/C][C]14056[/C][C]14101.8770295087[/C][C]-45.8770295087397[/C][/ROW]
[ROW][C]18[/C][C]14278[/C][C]14347.9982759895[/C][C]-69.9982759895101[/C][/ROW]
[ROW][C]19[/C][C]16142[/C][C]15846.8279447983[/C][C]295.172055201727[/C][/ROW]
[ROW][C]20[/C][C]16509[/C][C]17083.9250660417[/C][C]-574.92506604172[/C][/ROW]
[ROW][C]21[/C][C]15680[/C][C]15136.7335518573[/C][C]543.266448142704[/C][/ROW]
[ROW][C]22[/C][C]14086[/C][C]15043.1065651383[/C][C]-957.106565138323[/C][/ROW]
[ROW][C]23[/C][C]13129[/C][C]13152.9021226388[/C][C]-23.9021226388159[/C][/ROW]
[ROW][C]24[/C][C]13086[/C][C]13398.6251218812[/C][C]-312.62512188117[/C][/ROW]
[ROW][C]25[/C][C]13096[/C][C]12029.821973287[/C][C]1066.17802671302[/C][/ROW]
[ROW][C]26[/C][C]12280[/C][C]12849.9298209176[/C][C]-569.929820917609[/C][/ROW]
[ROW][C]27[/C][C]11534[/C][C]11699.5829575639[/C][C]-165.582957563876[/C][/ROW]
[ROW][C]28[/C][C]11135[/C][C]11814.3523559087[/C][C]-679.352355908735[/C][/ROW]
[ROW][C]29[/C][C]10903[/C][C]11059.2463933806[/C][C]-156.246393380621[/C][/ROW]
[ROW][C]30[/C][C]10926[/C][C]11079.7785490108[/C][C]-153.778549010829[/C][/ROW]
[ROW][C]31[/C][C]13220[/C][C]12474.3964826301[/C][C]745.603517369853[/C][/ROW]
[ROW][C]32[/C][C]13581[/C][C]13682.6840357291[/C][C]-101.684035729102[/C][/ROW]
[ROW][C]33[/C][C]11788[/C][C]12323.7332100756[/C][C]-535.73321007559[/C][/ROW]
[ROW][C]34[/C][C]11088[/C][C]10872.2550309132[/C][C]215.744969086772[/C][/ROW]
[ROW][C]35[/C][C]10434[/C][C]10029.1204544854[/C][C]404.879545514561[/C][/ROW]
[ROW][C]36[/C][C]11061[/C][C]10480.6322033835[/C][C]580.367796616451[/C][/ROW]
[ROW][C]37[/C][C]10828[/C][C]10198.066003696[/C][C]629.933996304022[/C][/ROW]
[ROW][C]38[/C][C]10270[/C][C]10262.8894100258[/C][C]7.11058997415421[/C][/ROW]
[ROW][C]39[/C][C]10360[/C][C]9709.75135519001[/C][C]650.248644809993[/C][/ROW]
[ROW][C]40[/C][C]9899[/C][C]10405.853207172[/C][C]-506.853207172035[/C][/ROW]
[ROW][C]41[/C][C]9395[/C][C]10076.5719976917[/C][C]-681.571997691672[/C][/ROW]
[ROW][C]42[/C][C]9944[/C][C]9829.31212604586[/C][C]114.687873954135[/C][/ROW]
[ROW][C]43[/C][C]12117[/C][C]11802.2817982116[/C][C]314.71820178837[/C][/ROW]
[ROW][C]44[/C][C]12474[/C][C]12557.3927099031[/C][C]-83.3927099031225[/C][/ROW]
[ROW][C]45[/C][C]11106[/C][C]11185.9180234284[/C][C]-79.9180234284449[/C][/ROW]
[ROW][C]46[/C][C]10643[/C][C]10409.5519488674[/C][C]233.448051132578[/C][/ROW]
[ROW][C]47[/C][C]10227[/C][C]9769.99547426949[/C][C]457.004525730506[/C][/ROW]
[ROW][C]48[/C][C]11273[/C][C]10450.5102260992[/C][C]822.489773900761[/C][/ROW]
[ROW][C]49[/C][C]11516[/C][C]10519.0823423497[/C][C]996.91765765032[/C][/ROW]
[ROW][C]50[/C][C]11583[/C][C]10867.4420610534[/C][C]715.557938946635[/C][/ROW]
[ROW][C]51[/C][C]11605[/C][C]11261.0396335229[/C][C]343.960366477088[/C][/ROW]
[ROW][C]52[/C][C]11414[/C][C]11641.4711648771[/C][C]-227.471164877059[/C][/ROW]
[ROW][C]53[/C][C]11181[/C][C]11718.1107069267[/C][C]-537.110706926664[/C][/ROW]
[ROW][C]54[/C][C]12000[/C][C]12065.6207104368[/C][C]-65.6207104368314[/C][/ROW]
[ROW][C]55[/C][C]14007[/C][C]14216.5277746689[/C][C]-209.527774668906[/C][/ROW]
[ROW][C]56[/C][C]14582[/C][C]14688.5413515031[/C][C]-106.541351503118[/C][/ROW]
[ROW][C]57[/C][C]13251[/C][C]13505.0509207655[/C][C]-254.050920765472[/C][/ROW]
[ROW][C]58[/C][C]12806[/C][C]12880.248046138[/C][C]-74.2480461380073[/C][/ROW]
[ROW][C]59[/C][C]12645[/C][C]12244.2633205262[/C][C]400.736679473786[/C][/ROW]
[ROW][C]60[/C][C]13869[/C][C]13144.0733340536[/C][C]724.92666594641[/C][/ROW]
[ROW][C]61[/C][C]13342[/C][C]13340.0213937272[/C][C]1.97860627284717[/C][/ROW]
[ROW][C]62[/C][C]13079[/C][C]12956.1823683206[/C][C]122.817631679414[/C][/ROW]
[ROW][C]63[/C][C]12513[/C][C]12829.6880042326[/C][C]-316.688004232552[/C][/ROW]
[ROW][C]64[/C][C]12331[/C][C]12527.5784804994[/C][C]-196.578480499446[/C][/ROW]
[ROW][C]65[/C][C]11882[/C][C]12494.9656109611[/C][C]-612.965610961062[/C][/ROW]
[ROW][C]66[/C][C]12388[/C][C]12869.7439234733[/C][C]-481.743923473252[/C][/ROW]
[ROW][C]67[/C][C]14394[/C][C]14594.0617831402[/C][C]-200.061783140221[/C][/ROW]
[ROW][C]68[/C][C]14635[/C][C]15015.6106263407[/C][C]-380.610626340687[/C][/ROW]
[ROW][C]69[/C][C]13218[/C][C]13483.5992119318[/C][C]-265.599211931756[/C][/ROW]
[ROW][C]70[/C][C]12554[/C][C]12790.0258999214[/C][C]-236.025899921362[/C][/ROW]
[ROW][C]71[/C][C]12031[/C][C]12046.326276337[/C][C]-15.3262763369512[/C][/ROW]
[ROW][C]72[/C][C]12429[/C][C]12577.1008785278[/C][C]-148.100878527761[/C][/ROW]
[/TABLE]
Source: https://freestatistics.org/blog/index.php?pk=148189&T=2

Globally Unique Identifier (entire table): ba.freestatistics.org/blog/index.php?pk=148189&T=2

As an alternative you can also use a QR Code:  

The GUIDs for individual cells are displayed in the table below:

Interpolation Forecasts of Exponential Smoothing
tObservedFittedResiduals
131459614912.5894764957-316.589476495717
141460914685.5976502755-76.5976502754584
151392313925.98711463-2.98711462999199
161422614228.5541749737-2.55417497369854
171405614101.8770295087-45.8770295087397
181427814347.9982759895-69.9982759895101
191614215846.8279447983295.172055201727
201650917083.9250660417-574.92506604172
211568015136.7335518573543.266448142704
221408615043.1065651383-957.106565138323
231312913152.9021226388-23.9021226388159
241308613398.6251218812-312.62512188117
251309612029.8219732871066.17802671302
261228012849.9298209176-569.929820917609
271153411699.5829575639-165.582957563876
281113511814.3523559087-679.352355908735
291090311059.2463933806-156.246393380621
301092611079.7785490108-153.778549010829
311322012474.3964826301745.603517369853
321358113682.6840357291-101.684035729102
331178812323.7332100756-535.73321007559
341108810872.2550309132215.744969086772
351043410029.1204544854404.879545514561
361106110480.6322033835580.367796616451
371082810198.066003696629.933996304022
381027010262.88941002587.11058997415421
39103609709.75135519001650.248644809993
40989910405.853207172-506.853207172035
41939510076.5719976917-681.571997691672
4299449829.31212604586114.687873954135
431211711802.2817982116314.71820178837
441247412557.3927099031-83.3927099031225
451110611185.9180234284-79.9180234284449
461064310409.5519488674233.448051132578
47102279769.99547426949457.004525730506
481127310450.5102260992822.489773900761
491151610519.0823423497996.91765765032
501158310867.4420610534715.557938946635
511160511261.0396335229343.960366477088
521141411641.4711648771-227.471164877059
531118111718.1107069267-537.110706926664
541200012065.6207104368-65.6207104368314
551400714216.5277746689-209.527774668906
561458214688.5413515031-106.541351503118
571325113505.0509207655-254.050920765472
581280612880.248046138-74.2480461380073
591264512244.2633205262400.736679473786
601386913144.0733340536724.92666594641
611334213340.02139372721.97860627284717
621307912956.1823683206122.817631679414
631251312829.6880042326-316.688004232552
641233112527.5784804994-196.578480499446
651188212494.9656109611-612.965610961062
661238812869.7439234733-481.743923473252
671439414594.0617831402-200.061783140221
681463515015.6106263407-380.610626340687
691321813483.5992119318-265.599211931756
701255412790.0258999214-236.025899921362
711203112046.326276337-15.3262763369512
721242912577.1008785278-148.100878527761


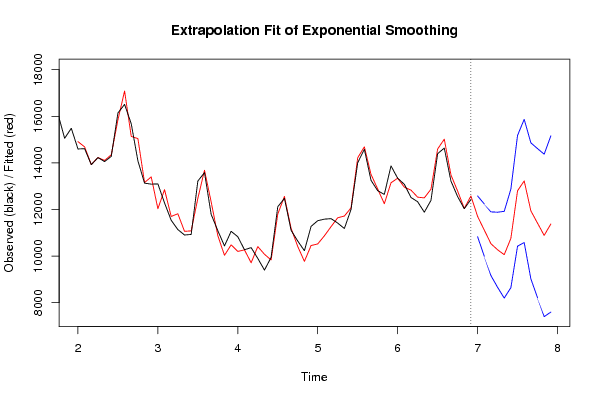
Extrapolation Forecasts of Exponential Smoothing
tForecast95% Lower Bound95% Upper Bound
7311705.09345171110831.503905092812578.6829983293
7411116.50406684119994.7591233148312238.2490103674
7510530.06369119569164.0196358307911896.1077465604
7610268.83681376048657.0115205589611880.6621069618
7710056.90422837638195.3046169191811918.5038398334
7810758.9488460538642.27184538712875.625846719
7912800.44767429110422.672629769515178.2227188124
8013224.073326727110578.783328218415869.3633252357
8111940.13126674339020.6990072171214859.5635262695
8211411.02079746668210.7209773189414611.3206176143
8310884.83100134217396.9104188078314372.7515838763
8411376.383201527594.1053134108215158.6610896292

\begin{tabular}{lllllllll}
\hline
Extrapolation Forecasts of Exponential Smoothing \tabularnewline
t & Forecast & 95% Lower Bound & 95% Upper Bound \tabularnewline
73 & 11705.093451711 & 10831.5039050928 & 12578.6829983293 \tabularnewline
74 & 11116.5040668411 & 9994.75912331483 & 12238.2490103674 \tabularnewline
75 & 10530.0636911956 & 9164.01963583079 & 11896.1077465604 \tabularnewline
76 & 10268.8368137604 & 8657.01152055896 & 11880.6621069618 \tabularnewline
77 & 10056.9042283763 & 8195.30461691918 & 11918.5038398334 \tabularnewline
78 & 10758.948846053 & 8642.271845387 & 12875.625846719 \tabularnewline
79 & 12800.447674291 & 10422.6726297695 & 15178.2227188124 \tabularnewline
80 & 13224.0733267271 & 10578.7833282184 & 15869.3633252357 \tabularnewline
81 & 11940.1312667433 & 9020.69900721712 & 14859.5635262695 \tabularnewline
82 & 11411.0207974666 & 8210.72097731894 & 14611.3206176143 \tabularnewline
83 & 10884.8310013421 & 7396.91041880783 & 14372.7515838763 \tabularnewline
84 & 11376.38320152 & 7594.10531341082 & 15158.6610896292 \tabularnewline
\hline
\end{tabular}
%Source: https://freestatistics.org/blog/index.php?pk=148189&T=3

[TABLE]
[ROW][C]Extrapolation Forecasts of Exponential Smoothing[/C][/ROW]
[ROW][C]t[/C][C]Forecast[/C][C]95% Lower Bound[/C][C]95% Upper Bound[/C][/ROW]
[ROW][C]73[/C][C]11705.093451711[/C][C]10831.5039050928[/C][C]12578.6829983293[/C][/ROW]
[ROW][C]74[/C][C]11116.5040668411[/C][C]9994.75912331483[/C][C]12238.2490103674[/C][/ROW]
[ROW][C]75[/C][C]10530.0636911956[/C][C]9164.01963583079[/C][C]11896.1077465604[/C][/ROW]
[ROW][C]76[/C][C]10268.8368137604[/C][C]8657.01152055896[/C][C]11880.6621069618[/C][/ROW]
[ROW][C]77[/C][C]10056.9042283763[/C][C]8195.30461691918[/C][C]11918.5038398334[/C][/ROW]
[ROW][C]78[/C][C]10758.948846053[/C][C]8642.271845387[/C][C]12875.625846719[/C][/ROW]
[ROW][C]79[/C][C]12800.447674291[/C][C]10422.6726297695[/C][C]15178.2227188124[/C][/ROW]
[ROW][C]80[/C][C]13224.0733267271[/C][C]10578.7833282184[/C][C]15869.3633252357[/C][/ROW]
[ROW][C]81[/C][C]11940.1312667433[/C][C]9020.69900721712[/C][C]14859.5635262695[/C][/ROW]
[ROW][C]82[/C][C]11411.0207974666[/C][C]8210.72097731894[/C][C]14611.3206176143[/C][/ROW]
[ROW][C]83[/C][C]10884.8310013421[/C][C]7396.91041880783[/C][C]14372.7515838763[/C][/ROW]
[ROW][C]84[/C][C]11376.38320152[/C][C]7594.10531341082[/C][C]15158.6610896292[/C][/ROW]
[/TABLE]
Source: https://freestatistics.org/blog/index.php?pk=148189&T=3

Globally Unique Identifier (entire table): ba.freestatistics.org/blog/index.php?pk=148189&T=3

As an alternative you can also use a QR Code:  

The GUIDs for individual cells are displayed in the table below:

Extrapolation Forecasts of Exponential Smoothing
tForecast95% Lower Bound95% Upper Bound
7311705.09345171110831.503905092812578.6829983293
7411116.50406684119994.7591233148312238.2490103674
7510530.06369119569164.0196358307911896.1077465604
7610268.83681376048657.0115205589611880.6621069618
7710056.90422837638195.3046169191811918.5038398334
7810758.9488460538642.27184538712875.625846719
7912800.44767429110422.672629769515178.2227188124
8013224.073326727110578.783328218415869.3633252357
8111940.13126674339020.6990072171214859.5635262695
8211411.02079746668210.7209773189414611.3206176143
8310884.83100134217396.9104188078314372.7515838763
8411376.383201527594.1053134108215158.6610896292


Parameters (Session):
par1 = 12 ; par2 = Triple ; par3 = additive ;
Parameters (R input):
par1 = 12 ; par2 = Triple ; par3 = additive ;
R code (references can be found in the software module):
par1 <- as.numeric(par1)
if (par2 == 'Single') K <- 1
if (par2 == 'Double') K <- 2
if (par2 == 'Triple') K <- par1
nx <- length(x)
nxmK <- nx - K
x <- ts(x, frequency = par1)
if (par2 == 'Single') fit <- HoltWinters(x, gamma=F, beta=F)
if (par2 == 'Double') fit <- HoltWinters(x, gamma=F)
if (par2 == 'Triple') fit <- HoltWinters(x, seasonal=par3)
fit
myresid <- x - fit$fitted[,'xhat']
bitmap(file='test1.png')
op <- par(mfrow=c(2,1))
plot(fit,ylab='Observed (black) / Fitted (red)',main='Interpolation Fit of Exponential Smoothing')
plot(myresid,ylab='Residuals',main='Interpolation Prediction Errors')
par(op)
dev.off()
bitmap(file='test2.png')
p <- predict(fit, par1, prediction.interval=TRUE)
np <- length(p[,1])
plot(fit,p,ylab='Observed (black) / Fitted (red)',main='Extrapolation Fit of Exponential Smoothing')
dev.off()
bitmap(file='test3.png')
op <- par(mfrow = c(2,2))
acf(as.numeric(myresid),lag.max = nx/2,main='Residual ACF')
spectrum(myresid,main='Residals Periodogram')
cpgram(myresid,main='Residal Cumulative Periodogram')
qqnorm(myresid,main='Residual Normal QQ Plot')
qqline(myresid)
par(op)
dev.off()
load(file='createtable')
a<-table.start()
a<-table.row.start(a)
a<-table.element(a,'Estimated Parameters of Exponential Smoothing',2,TRUE)
a<-table.row.end(a)
a<-table.row.start(a)
a<-table.element(a,'Parameter',header=TRUE)
a<-table.element(a,'Value',header=TRUE)
a<-table.row.end(a)
a<-table.row.start(a)
a<-table.element(a,'alpha',header=TRUE)
a<-table.element(a,fit$alpha)
a<-table.row.end(a)
a<-table.row.start(a)
a<-table.element(a,'beta',header=TRUE)
a<-table.element(a,fit$beta)
a<-table.row.end(a)
a<-table.row.start(a)
a<-table.element(a,'gamma',header=TRUE)
a<-table.element(a,fit$gamma)
a<-table.row.end(a)
a<-table.end(a)
table.save(a,file='mytable.tab')
a<-table.start()
a<-table.row.start(a)
a<-table.element(a,'Interpolation Forecasts of Exponential Smoothing',4,TRUE)
a<-table.row.end(a)
a<-table.row.start(a)
a<-table.element(a,'t',header=TRUE)
a<-table.element(a,'Observed',header=TRUE)
a<-table.element(a,'Fitted',header=TRUE)
a<-table.element(a,'Residuals',header=TRUE)
a<-table.row.end(a)
for (i in 1:nxmK) {
a<-table.row.start(a)
a<-table.element(a,i+K,header=TRUE)
a<-table.element(a,x[i+K])
a<-table.element(a,fit$fitted[i,'xhat'])
a<-table.element(a,myresid[i])
a<-table.row.end(a)
}
a<-table.end(a)
table.save(a,file='mytable1.tab')
a<-table.start()
a<-table.row.start(a)
a<-table.element(a,'Extrapolation Forecasts of Exponential Smoothing',4,TRUE)
a<-table.row.end(a)
a<-table.row.start(a)
a<-table.element(a,'t',header=TRUE)
a<-table.element(a,'Forecast',header=TRUE)
a<-table.element(a,'95% Lower Bound',header=TRUE)
a<-table.element(a,'95% Upper Bound',header=TRUE)
a<-table.row.end(a)
for (i in 1:np) {
a<-table.row.start(a)
a<-table.element(a,nx+i,header=TRUE)
a<-table.element(a,p[i,'fit'])
a<-table.element(a,p[i,'lwr'])
a<-table.element(a,p[i,'upr'])
a<-table.row.end(a)
}
a<-table.end(a)
table.save(a,file='mytable2.tab')