Free Statistics

of Irreproducible Research!

Author's title

Author*Unverified author*
R Software Modulerwasp_smp.wasp
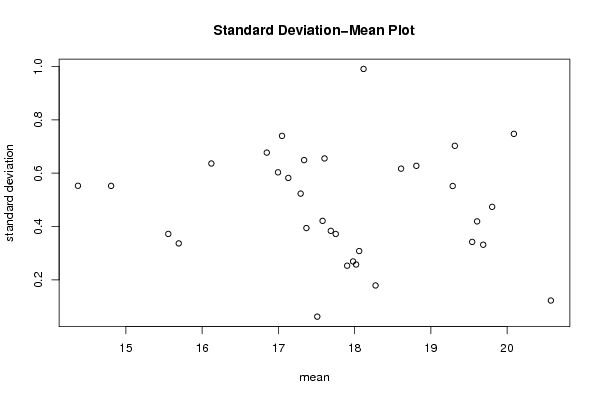
Title produced by softwareStandard Deviation-Mean Plot
Date of computationTue, 29 Nov 2011 03:35:58 -0500
Cite this page as followsStatistical Computations at FreeStatistics.org, Office for Research Development and Education, URL https://freestatistics.org/blog/index.php?v=date/2011/Nov/29/t1322555938hemwppztuero1pv.htm/, Retrieved Wed, 24 Apr 2024 04:32:12 +0000
Statistical Computations at FreeStatistics.org, Office for Research Development and Education, URL https://freestatistics.org/blog/index.php?pk=148105, Retrieved Wed, 24 Apr 2024 04:32:12 +0000
QR Codes:

Original text written by user:
IsPrivate?No (this computation is public)
User-defined keywordsKDGP2W83
Estimated Impact102
Family? (F = Feedback message, R = changed R code, M = changed R Module, P = changed Parameters, D = changed Data)
-       [Standard Deviation-Mean Plot] [gemiddelde consum...] [2011-11-29 08:35:58] [08802a004a000ae20ac4145e9a22f7e4] [Current]
Feedback Forum

Post a new message
Dataseries X:
15.14
14.2
13.83
14.31
14.04
14.9
14.92
15.36
15.5
15.65
16.18
15.44
15.58
15.24
15.33
16.07
15.82
15.87
15.72
17.07
16.83
17.52
17.76
17.36
17.95
16.71
17.14
16.72
17.26
17.24
17.69
18.13
18.08
18.18
18.18
17.64
17.89
16.82
16.61
16.66
17.02
16.91
17.18
18.06
17.58
17.48
17.54
17.44
17.79
16.79
16.19
16.62
16.39
16.54
17.26
18
17.29
18.16
17.82
17.48
18.31
17.04
17.03
16.97
17.11
17.12
17.69
18.5
18.27
18.45
18.35
18.03
18.49
18.07
17.8
17.88
18.12
18.68
18.8
19.64
19.56
19.3
20.07
19.82
20.29
19.36
18.74
18.87
18.87
18.91
19.31
20.06
20.72
20.42
20.58
20.58
21.18
19.87
19.83
19.48
19.49
19.4
19.89
20.44
20.07
19.75
19.54
19.07
19.55
18.01
17.5
17.41
17.47
17.6
17.64
18.3
18.27
17.99
18.04
17.62
18.22
17.67
17.73
17.99
18.15
18.41
18.36
19.52
19.96
19.6
19.48
19.13


Summary of computational transaction
Raw Inputview raw input (R code)
Raw Outputview raw output of R engine
Computing time1 seconds
R Server'Gertrude Mary Cox' @ cox.wessa.net

\begin{tabular}{lllllllll}
\hline
Summary of computational transaction \tabularnewline
Raw Input & view raw input (R code)  \tabularnewline
Raw Output & view raw output of R engine  \tabularnewline
Computing time & 1 seconds \tabularnewline
R Server & 'Gertrude Mary Cox' @ cox.wessa.net \tabularnewline
\hline
\end{tabular}
%Source: https://freestatistics.org/blog/index.php?pk=148105&T=0

[TABLE]
[ROW][C]Summary of computational transaction[/C][/ROW]
[ROW][C]Raw Input[/C][C]view raw input (R code) [/C][/ROW]
[ROW][C]Raw Output[/C][C]view raw output of R engine [/C][/ROW]
[ROW][C]Computing time[/C][C]1 seconds[/C][/ROW]
[ROW][C]R Server[/C][C]'Gertrude Mary Cox' @ cox.wessa.net[/C][/ROW]
[/TABLE]
Source: https://freestatistics.org/blog/index.php?pk=148105&T=0

Globally Unique Identifier (entire table): ba.freestatistics.org/blog/index.php?pk=148105&T=0

As an alternative you can also use a QR Code:  

The GUIDs for individual cells are displayed in the table below:

Summary of computational transaction
Raw Inputview raw input (R code)
Raw Outputview raw output of R engine
Computing time1 seconds
R Server'Gertrude Mary Cox' @ cox.wessa.net


Standard Deviation-Mean Plot
SectionMeanStandard DeviationRange
114.370.5528712930390461.31
214.8050.5524189231612791.32
315.69250.3367862823809780.74
415.5550.3722454387452810.83
516.120.6363961030678931.35
617.36750.394239774756430.930000000000003
717.130.5822370651203851.24
817.580.421347046190350.890000000000001
918.020.2576819745345020.539999999999999
1016.9950.6033517492585351.28
1117.29250.5235376458925051.15
1217.510.06218252702059080.139999999999997
1316.84750.6771693535101341.6
1417.04750.7398817473083121.61
1517.68750.3837859646556490.870000000000001
1617.33750.6490698472943151.34
1717.6050.6553624951124381.39
1818.2750.1791647286716890.419999999999998
1918.060.3082207001484480.689999999999998
2018.810.6276941930590091.52
2119.68750.3318006429569820.77
2219.3150.7026853254954641.55
2319.28750.5519888283893671.19
2420.5750.1226104943849960.299999999999997
2520.090.7474846709687991.7
2619.8050.4738846554454661.04
2719.60750.419394404667811
2818.11750.9908708291195182.14
2917.75250.3721446851248410.830000000000002
3017.980.2691963347942660.649999999999999
3117.90250.2531633201446570.549999999999997
3218.610.6170359254803031.37
3319.54250.3423813663154010.830000000000002

\begin{tabular}{lllllllll}
\hline
Standard Deviation-Mean Plot \tabularnewline
Section & Mean & Standard Deviation & Range \tabularnewline
1 & 14.37 & 0.552871293039046 & 1.31 \tabularnewline
2 & 14.805 & 0.552418923161279 & 1.32 \tabularnewline
3 & 15.6925 & 0.336786282380978 & 0.74 \tabularnewline
4 & 15.555 & 0.372245438745281 & 0.83 \tabularnewline
5 & 16.12 & 0.636396103067893 & 1.35 \tabularnewline
6 & 17.3675 & 0.39423977475643 & 0.930000000000003 \tabularnewline
7 & 17.13 & 0.582237065120385 & 1.24 \tabularnewline
8 & 17.58 & 0.42134704619035 & 0.890000000000001 \tabularnewline
9 & 18.02 & 0.257681974534502 & 0.539999999999999 \tabularnewline
10 & 16.995 & 0.603351749258535 & 1.28 \tabularnewline
11 & 17.2925 & 0.523537645892505 & 1.15 \tabularnewline
12 & 17.51 & 0.0621825270205908 & 0.139999999999997 \tabularnewline
13 & 16.8475 & 0.677169353510134 & 1.6 \tabularnewline
14 & 17.0475 & 0.739881747308312 & 1.61 \tabularnewline
15 & 17.6875 & 0.383785964655649 & 0.870000000000001 \tabularnewline
16 & 17.3375 & 0.649069847294315 & 1.34 \tabularnewline
17 & 17.605 & 0.655362495112438 & 1.39 \tabularnewline
18 & 18.275 & 0.179164728671689 & 0.419999999999998 \tabularnewline
19 & 18.06 & 0.308220700148448 & 0.689999999999998 \tabularnewline
20 & 18.81 & 0.627694193059009 & 1.52 \tabularnewline
21 & 19.6875 & 0.331800642956982 & 0.77 \tabularnewline
22 & 19.315 & 0.702685325495464 & 1.55 \tabularnewline
23 & 19.2875 & 0.551988828389367 & 1.19 \tabularnewline
24 & 20.575 & 0.122610494384996 & 0.299999999999997 \tabularnewline
25 & 20.09 & 0.747484670968799 & 1.7 \tabularnewline
26 & 19.805 & 0.473884655445466 & 1.04 \tabularnewline
27 & 19.6075 & 0.41939440466781 & 1 \tabularnewline
28 & 18.1175 & 0.990870829119518 & 2.14 \tabularnewline
29 & 17.7525 & 0.372144685124841 & 0.830000000000002 \tabularnewline
30 & 17.98 & 0.269196334794266 & 0.649999999999999 \tabularnewline
31 & 17.9025 & 0.253163320144657 & 0.549999999999997 \tabularnewline
32 & 18.61 & 0.617035925480303 & 1.37 \tabularnewline
33 & 19.5425 & 0.342381366315401 & 0.830000000000002 \tabularnewline
\hline
\end{tabular}
%Source: https://freestatistics.org/blog/index.php?pk=148105&T=1

[TABLE]
[ROW][C]Standard Deviation-Mean Plot[/C][/ROW]
[ROW][C]Section[/C][C]Mean[/C][C]Standard Deviation[/C][C]Range[/C][/ROW]
[ROW][C]1[/C][C]14.37[/C][C]0.552871293039046[/C][C]1.31[/C][/ROW]
[ROW][C]2[/C][C]14.805[/C][C]0.552418923161279[/C][C]1.32[/C][/ROW]
[ROW][C]3[/C][C]15.6925[/C][C]0.336786282380978[/C][C]0.74[/C][/ROW]
[ROW][C]4[/C][C]15.555[/C][C]0.372245438745281[/C][C]0.83[/C][/ROW]
[ROW][C]5[/C][C]16.12[/C][C]0.636396103067893[/C][C]1.35[/C][/ROW]
[ROW][C]6[/C][C]17.3675[/C][C]0.39423977475643[/C][C]0.930000000000003[/C][/ROW]
[ROW][C]7[/C][C]17.13[/C][C]0.582237065120385[/C][C]1.24[/C][/ROW]
[ROW][C]8[/C][C]17.58[/C][C]0.42134704619035[/C][C]0.890000000000001[/C][/ROW]
[ROW][C]9[/C][C]18.02[/C][C]0.257681974534502[/C][C]0.539999999999999[/C][/ROW]
[ROW][C]10[/C][C]16.995[/C][C]0.603351749258535[/C][C]1.28[/C][/ROW]
[ROW][C]11[/C][C]17.2925[/C][C]0.523537645892505[/C][C]1.15[/C][/ROW]
[ROW][C]12[/C][C]17.51[/C][C]0.0621825270205908[/C][C]0.139999999999997[/C][/ROW]
[ROW][C]13[/C][C]16.8475[/C][C]0.677169353510134[/C][C]1.6[/C][/ROW]
[ROW][C]14[/C][C]17.0475[/C][C]0.739881747308312[/C][C]1.61[/C][/ROW]
[ROW][C]15[/C][C]17.6875[/C][C]0.383785964655649[/C][C]0.870000000000001[/C][/ROW]
[ROW][C]16[/C][C]17.3375[/C][C]0.649069847294315[/C][C]1.34[/C][/ROW]
[ROW][C]17[/C][C]17.605[/C][C]0.655362495112438[/C][C]1.39[/C][/ROW]
[ROW][C]18[/C][C]18.275[/C][C]0.179164728671689[/C][C]0.419999999999998[/C][/ROW]
[ROW][C]19[/C][C]18.06[/C][C]0.308220700148448[/C][C]0.689999999999998[/C][/ROW]
[ROW][C]20[/C][C]18.81[/C][C]0.627694193059009[/C][C]1.52[/C][/ROW]
[ROW][C]21[/C][C]19.6875[/C][C]0.331800642956982[/C][C]0.77[/C][/ROW]
[ROW][C]22[/C][C]19.315[/C][C]0.702685325495464[/C][C]1.55[/C][/ROW]
[ROW][C]23[/C][C]19.2875[/C][C]0.551988828389367[/C][C]1.19[/C][/ROW]
[ROW][C]24[/C][C]20.575[/C][C]0.122610494384996[/C][C]0.299999999999997[/C][/ROW]
[ROW][C]25[/C][C]20.09[/C][C]0.747484670968799[/C][C]1.7[/C][/ROW]
[ROW][C]26[/C][C]19.805[/C][C]0.473884655445466[/C][C]1.04[/C][/ROW]
[ROW][C]27[/C][C]19.6075[/C][C]0.41939440466781[/C][C]1[/C][/ROW]
[ROW][C]28[/C][C]18.1175[/C][C]0.990870829119518[/C][C]2.14[/C][/ROW]
[ROW][C]29[/C][C]17.7525[/C][C]0.372144685124841[/C][C]0.830000000000002[/C][/ROW]
[ROW][C]30[/C][C]17.98[/C][C]0.269196334794266[/C][C]0.649999999999999[/C][/ROW]
[ROW][C]31[/C][C]17.9025[/C][C]0.253163320144657[/C][C]0.549999999999997[/C][/ROW]
[ROW][C]32[/C][C]18.61[/C][C]0.617035925480303[/C][C]1.37[/C][/ROW]
[ROW][C]33[/C][C]19.5425[/C][C]0.342381366315401[/C][C]0.830000000000002[/C][/ROW]
[/TABLE]
Source: https://freestatistics.org/blog/index.php?pk=148105&T=1

Globally Unique Identifier (entire table): ba.freestatistics.org/blog/index.php?pk=148105&T=1

As an alternative you can also use a QR Code:  

The GUIDs for individual cells are displayed in the table below:

Standard Deviation-Mean Plot
SectionMeanStandard DeviationRange
114.370.5528712930390461.31
214.8050.5524189231612791.32
315.69250.3367862823809780.74
415.5550.3722454387452810.83
516.120.6363961030678931.35
617.36750.394239774756430.930000000000003
717.130.5822370651203851.24
817.580.421347046190350.890000000000001
918.020.2576819745345020.539999999999999
1016.9950.6033517492585351.28
1117.29250.5235376458925051.15
1217.510.06218252702059080.139999999999997
1316.84750.6771693535101341.6
1417.04750.7398817473083121.61
1517.68750.3837859646556490.870000000000001
1617.33750.6490698472943151.34
1717.6050.6553624951124381.39
1818.2750.1791647286716890.419999999999998
1918.060.3082207001484480.689999999999998
2018.810.6276941930590091.52
2119.68750.3318006429569820.77
2219.3150.7026853254954641.55
2319.28750.5519888283893671.19
2420.5750.1226104943849960.299999999999997
2520.090.7474846709687991.7
2619.8050.4738846554454661.04
2719.60750.419394404667811
2818.11750.9908708291195182.14
2917.75250.3721446851248410.830000000000002
3017.980.2691963347942660.649999999999999
3117.90250.2531633201446570.549999999999997
3218.610.6170359254803031.37
3319.54250.3423813663154010.830000000000002


Regression: S.E.(k) = alpha + beta * Mean(k)
alpha0.76469569486532
beta-0.0161879594723476
S.D.0.0246155874421387
T-STAT-0.65763043479661
p-value0.515629457170946

\begin{tabular}{lllllllll}
\hline
Regression: S.E.(k) = alpha + beta * Mean(k) \tabularnewline
alpha & 0.76469569486532 \tabularnewline
beta & -0.0161879594723476 \tabularnewline
S.D. & 0.0246155874421387 \tabularnewline
T-STAT & -0.65763043479661 \tabularnewline
p-value & 0.515629457170946 \tabularnewline
\hline
\end{tabular}
%Source: https://freestatistics.org/blog/index.php?pk=148105&T=2

[TABLE]
[ROW][C]Regression: S.E.(k) = alpha + beta * Mean(k)[/C][/ROW]
[ROW][C]alpha[/C][C]0.76469569486532[/C][/ROW]
[ROW][C]beta[/C][C]-0.0161879594723476[/C][/ROW]
[ROW][C]S.D.[/C][C]0.0246155874421387[/C][/ROW]
[ROW][C]T-STAT[/C][C]-0.65763043479661[/C][/ROW]
[ROW][C]p-value[/C][C]0.515629457170946[/C][/ROW]
[/TABLE]
Source: https://freestatistics.org/blog/index.php?pk=148105&T=2

Globally Unique Identifier (entire table): ba.freestatistics.org/blog/index.php?pk=148105&T=2

As an alternative you can also use a QR Code:  

The GUIDs for individual cells are displayed in the table below:

Regression: S.E.(k) = alpha + beta * Mean(k)
alpha0.76469569486532
beta-0.0161879594723476
S.D.0.0246155874421387
T-STAT-0.65763043479661
p-value0.515629457170946


Regression: ln S.E.(k) = alpha + beta * ln Mean(k)
alpha2.08989594799812
beta-1.02640694389354
S.D.1.17932480306089
T-STAT-0.870334399165983
p-value0.390807496261937
Lambda2.02640694389354

\begin{tabular}{lllllllll}
\hline
Regression: ln S.E.(k) = alpha + beta * ln Mean(k) \tabularnewline
alpha & 2.08989594799812 \tabularnewline
beta & -1.02640694389354 \tabularnewline
S.D. & 1.17932480306089 \tabularnewline
T-STAT & -0.870334399165983 \tabularnewline
p-value & 0.390807496261937 \tabularnewline
Lambda & 2.02640694389354 \tabularnewline
\hline
\end{tabular}
%Source: https://freestatistics.org/blog/index.php?pk=148105&T=3

[TABLE]
[ROW][C]Regression: ln S.E.(k) = alpha + beta * ln Mean(k)[/C][/ROW]
[ROW][C]alpha[/C][C]2.08989594799812[/C][/ROW]
[ROW][C]beta[/C][C]-1.02640694389354[/C][/ROW]
[ROW][C]S.D.[/C][C]1.17932480306089[/C][/ROW]
[ROW][C]T-STAT[/C][C]-0.870334399165983[/C][/ROW]
[ROW][C]p-value[/C][C]0.390807496261937[/C][/ROW]
[ROW][C]Lambda[/C][C]2.02640694389354[/C][/ROW]
[/TABLE]
Source: https://freestatistics.org/blog/index.php?pk=148105&T=3

Globally Unique Identifier (entire table): ba.freestatistics.org/blog/index.php?pk=148105&T=3

As an alternative you can also use a QR Code:  

The GUIDs for individual cells are displayed in the table below:

Regression: ln S.E.(k) = alpha + beta * ln Mean(k)
alpha2.08989594799812
beta-1.02640694389354
S.D.1.17932480306089
T-STAT-0.870334399165983
p-value0.390807496261937
Lambda2.02640694389354


Parameters (Session):
par1 = 4 ;
Parameters (R input):
par1 = 4 ;
R code (references can be found in the software module):
par1 <- as.numeric(par1)
(n <- length(x))
(np <- floor(n / par1))
arr <- array(NA,dim=c(par1,np))
j <- 0
k <- 1
for (i in 1:(np*par1))
{
j = j + 1
arr[j,k] <- x[i]
if (j == par1) {
j = 0
k=k+1
}
}
arr
arr.mean <- array(NA,dim=np)
arr.sd <- array(NA,dim=np)
arr.range <- array(NA,dim=np)
for (j in 1:np)
{
arr.mean[j] <- mean(arr[,j],na.rm=TRUE)
arr.sd[j] <- sd(arr[,j],na.rm=TRUE)
arr.range[j] <- max(arr[,j],na.rm=TRUE) - min(arr[,j],na.rm=TRUE)
}
arr.mean
arr.sd
arr.range
(lm1 <- lm(arr.sd~arr.mean))
(lnlm1 <- lm(log(arr.sd)~log(arr.mean)))
(lm2 <- lm(arr.range~arr.mean))
bitmap(file='test1.png')
plot(arr.mean,arr.sd,main='Standard Deviation-Mean Plot',xlab='mean',ylab='standard deviation')
dev.off()
bitmap(file='test2.png')
plot(arr.mean,arr.range,main='Range-Mean Plot',xlab='mean',ylab='range')
dev.off()
load(file='createtable')
a<-table.start()
a<-table.row.start(a)
a<-table.element(a,'Standard Deviation-Mean Plot',4,TRUE)
a<-table.row.end(a)
a<-table.row.start(a)
a<-table.element(a,'Section',header=TRUE)
a<-table.element(a,'Mean',header=TRUE)
a<-table.element(a,'Standard Deviation',header=TRUE)
a<-table.element(a,'Range',header=TRUE)
a<-table.row.end(a)
for (j in 1:np) {
a<-table.row.start(a)
a<-table.element(a,j,header=TRUE)
a<-table.element(a,arr.mean[j])
a<-table.element(a,arr.sd[j] )
a<-table.element(a,arr.range[j] )
a<-table.row.end(a)
}
a<-table.end(a)
table.save(a,file='mytable.tab')
a<-table.start()
a<-table.row.start(a)
a<-table.element(a,'Regression: S.E.(k) = alpha + beta * Mean(k)',2,TRUE)
a<-table.row.end(a)
a<-table.row.start(a)
a<-table.element(a,'alpha',header=TRUE)
a<-table.element(a,lm1$coefficients[[1]])
a<-table.row.end(a)
a<-table.row.start(a)
a<-table.element(a,'beta',header=TRUE)
a<-table.element(a,lm1$coefficients[[2]])
a<-table.row.end(a)
a<-table.row.start(a)
a<-table.element(a,'S.D.',header=TRUE)
a<-table.element(a,summary(lm1)$coefficients[2,2])
a<-table.row.end(a)
a<-table.row.start(a)
a<-table.element(a,'T-STAT',header=TRUE)
a<-table.element(a,summary(lm1)$coefficients[2,3])
a<-table.row.end(a)
a<-table.row.start(a)
a<-table.element(a,'p-value',header=TRUE)
a<-table.element(a,summary(lm1)$coefficients[2,4])
a<-table.row.end(a)
a<-table.end(a)
table.save(a,file='mytable1.tab')
a<-table.start()
a<-table.row.start(a)
a<-table.element(a,'Regression: ln S.E.(k) = alpha + beta * ln Mean(k)',2,TRUE)
a<-table.row.end(a)
a<-table.row.start(a)
a<-table.element(a,'alpha',header=TRUE)
a<-table.element(a,lnlm1$coefficients[[1]])
a<-table.row.end(a)
a<-table.row.start(a)
a<-table.element(a,'beta',header=TRUE)
a<-table.element(a,lnlm1$coefficients[[2]])
a<-table.row.end(a)
a<-table.row.start(a)
a<-table.element(a,'S.D.',header=TRUE)
a<-table.element(a,summary(lnlm1)$coefficients[2,2])
a<-table.row.end(a)
a<-table.row.start(a)
a<-table.element(a,'T-STAT',header=TRUE)
a<-table.element(a,summary(lnlm1)$coefficients[2,3])
a<-table.row.end(a)
a<-table.row.start(a)
a<-table.element(a,'p-value',header=TRUE)
a<-table.element(a,summary(lnlm1)$coefficients[2,4])
a<-table.row.end(a)
a<-table.row.start(a)
a<-table.element(a,'Lambda',header=TRUE)
a<-table.element(a,1-lnlm1$coefficients[[2]])
a<-table.row.end(a)
a<-table.end(a)
table.save(a,file='mytable2.tab')