Free Statistics

of Irreproducible Research!

Author's title

Author*The author of this computation has been verified*
R Software Modulerwasp_multipleregression.wasp
Title produced by softwareMultiple Regression
Date of computationMon, 28 Nov 2011 13:00:34 -0500
Cite this page as followsStatistical Computations at FreeStatistics.org, Office for Research Development and Education, URL https://freestatistics.org/blog/index.php?v=date/2011/Nov/28/t1322503253md2wm50599ziyua.htm/, Retrieved Fri, 19 Apr 2024 19:23:54 +0000
Statistical Computations at FreeStatistics.org, Office for Research Development and Education, URL https://freestatistics.org/blog/index.php?pk=147930, Retrieved Fri, 19 Apr 2024 19:23:54 +0000
QR Codes:

Original text written by user:
IsPrivate?No (this computation is public)
User-defined keywords
Estimated Impact104
Family? (F = Feedback message, R = changed R code, M = changed R Module, P = changed Parameters, D = changed Data)
-     [Exponential Smoothing] [HPC Retail Sales] [2008-03-10 17:43:04] [74be16979710d4c4e7c6647856088456]
- RMPD    [Multiple Regression] [WS8 Multiple Regr...] [2011-11-28 18:00:34] [2a6d487209befbc7c5ce02a41ecac161] [Current]
Feedback Forum

Post a new message
Dataseries X:
2564
2820
3508
3088
3299
2939
3320
3418
3604
3495
4163
4882
2211
3260
2992
2425
2707
3244
3965
3315
3333
3583
4021
4904
2252
2952
3573
3048
3059
2731
3563
3092
3478
3478
4308
5029
2075
3264
3308
3688
3136
2824
3644
4694
2914
3686
4358
5587
2265
3685
3754
3708
3210
3517
3905
3670
4221
4404
5086
5725


Summary of computational transaction
Raw Inputview raw input (R code)
Raw Outputview raw output of R engine
Computing time4 seconds
R Server'Gwilym Jenkins' @ jenkins.wessa.net

\begin{tabular}{lllllllll}
\hline
Summary of computational transaction \tabularnewline
Raw Input & view raw input (R code)  \tabularnewline
Raw Output & view raw output of R engine  \tabularnewline
Computing time & 4 seconds \tabularnewline
R Server & 'Gwilym Jenkins' @ jenkins.wessa.net \tabularnewline
\hline
\end{tabular}
%Source: https://freestatistics.org/blog/index.php?pk=147930&T=0

[TABLE]
[ROW][C]Summary of computational transaction[/C][/ROW]
[ROW][C]Raw Input[/C][C]view raw input (R code) [/C][/ROW]
[ROW][C]Raw Output[/C][C]view raw output of R engine [/C][/ROW]
[ROW][C]Computing time[/C][C]4 seconds[/C][/ROW]
[ROW][C]R Server[/C][C]'Gwilym Jenkins' @ jenkins.wessa.net[/C][/ROW]
[/TABLE]
Source: https://freestatistics.org/blog/index.php?pk=147930&T=0

Globally Unique Identifier (entire table): ba.freestatistics.org/blog/index.php?pk=147930&T=0

As an alternative you can also use a QR Code:  

The GUIDs for individual cells are displayed in the table below:

Summary of computational transaction
Raw Inputview raw input (R code)
Raw Outputview raw output of R engine
Computing time4 seconds
R Server'Gwilym Jenkins' @ jenkins.wessa.net


Multiple Linear Regression - Estimated Regression Equation
Sales[t] = + 4842.45 -2834.9875M1[t] -1922.825M2[t] -1702.6625M3[t] -1948.9M4[t] -2068.7375M5[t] -2110.575M6[t] -1492.8125M7[t] -1545.05M8[t] -1683.4875M9[t] -1474.925M10[t] -827.5625M11[t] + 10.6375t + e[t]

\begin{tabular}{lllllllll}
\hline
Multiple Linear Regression - Estimated Regression Equation \tabularnewline
Sales[t] =  +  4842.45 -2834.9875M1[t] -1922.825M2[t] -1702.6625M3[t] -1948.9M4[t] -2068.7375M5[t] -2110.575M6[t] -1492.8125M7[t] -1545.05M8[t] -1683.4875M9[t] -1474.925M10[t] -827.5625M11[t] +  10.6375t  + e[t] \tabularnewline
\hline
\end{tabular}
%Source: https://freestatistics.org/blog/index.php?pk=147930&T=1

[TABLE]
[ROW][C]Multiple Linear Regression - Estimated Regression Equation[/C][/ROW]
[ROW][C]Sales[t] =  +  4842.45 -2834.9875M1[t] -1922.825M2[t] -1702.6625M3[t] -1948.9M4[t] -2068.7375M5[t] -2110.575M6[t] -1492.8125M7[t] -1545.05M8[t] -1683.4875M9[t] -1474.925M10[t] -827.5625M11[t] +  10.6375t  + e[t][/C][/ROW]
[/TABLE]
Source: https://freestatistics.org/blog/index.php?pk=147930&T=1

Globally Unique Identifier (entire table): ba.freestatistics.org/blog/index.php?pk=147930&T=1

As an alternative you can also use a QR Code:  

The GUIDs for individual cells are displayed in the table below:

Multiple Linear Regression - Estimated Regression Equation
Sales[t] = + 4842.45 -2834.9875M1[t] -1922.825M2[t] -1702.6625M3[t] -1948.9M4[t] -2068.7375M5[t] -2110.575M6[t] -1492.8125M7[t] -1545.05M8[t] -1683.4875M9[t] -1474.925M10[t] -827.5625M11[t] + 10.6375t + e[t]


Multiple Linear Regression - Ordinary Least Squares
VariableParameterS.D.T-STATH0: parameter = 02-tail p-value1-tail p-value
(Intercept)4842.45177.4594127.287600
M1-2834.9875215.889303-13.131700
M2-1922.825215.566748-8.919900
M3-1702.6625215.274496-7.909300
M4-1948.9215.01267-9.064100
M5-2068.7375214.781382-9.631800
M6-2110.575214.580731-9.835800
M7-1492.8125214.410803-6.962400
M8-1545.05214.271671-7.210700
M9-1683.4875214.163394-7.860800
M10-1474.925214.08602-6.889400
M11-827.5625214.039582-3.86640.0003380.000169
t10.63752.574314.13220.0001477.3e-05

\begin{tabular}{lllllllll}
\hline
Multiple Linear Regression - Ordinary Least Squares \tabularnewline
Variable & Parameter & S.D. & T-STATH0: parameter = 0 & 2-tail p-value & 1-tail p-value \tabularnewline
(Intercept) & 4842.45 & 177.45941 & 27.2876 & 0 & 0 \tabularnewline
M1 & -2834.9875 & 215.889303 & -13.1317 & 0 & 0 \tabularnewline
M2 & -1922.825 & 215.566748 & -8.9199 & 0 & 0 \tabularnewline
M3 & -1702.6625 & 215.274496 & -7.9093 & 0 & 0 \tabularnewline
M4 & -1948.9 & 215.01267 & -9.0641 & 0 & 0 \tabularnewline
M5 & -2068.7375 & 214.781382 & -9.6318 & 0 & 0 \tabularnewline
M6 & -2110.575 & 214.580731 & -9.8358 & 0 & 0 \tabularnewline
M7 & -1492.8125 & 214.410803 & -6.9624 & 0 & 0 \tabularnewline
M8 & -1545.05 & 214.271671 & -7.2107 & 0 & 0 \tabularnewline
M9 & -1683.4875 & 214.163394 & -7.8608 & 0 & 0 \tabularnewline
M10 & -1474.925 & 214.08602 & -6.8894 & 0 & 0 \tabularnewline
M11 & -827.5625 & 214.039582 & -3.8664 & 0.000338 & 0.000169 \tabularnewline
t & 10.6375 & 2.57431 & 4.1322 & 0.000147 & 7.3e-05 \tabularnewline
\hline
\end{tabular}
%Source: https://freestatistics.org/blog/index.php?pk=147930&T=2

[TABLE]
[ROW][C]Multiple Linear Regression - Ordinary Least Squares[/C][/ROW]
[ROW][C]Variable[/C][C]Parameter[/C][C]S.D.[/C][C]T-STATH0: parameter = 0[/C][C]2-tail p-value[/C][C]1-tail p-value[/C][/ROW]
[ROW][C](Intercept)[/C][C]4842.45[/C][C]177.45941[/C][C]27.2876[/C][C]0[/C][C]0[/C][/ROW]
[ROW][C]M1[/C][C]-2834.9875[/C][C]215.889303[/C][C]-13.1317[/C][C]0[/C][C]0[/C][/ROW]
[ROW][C]M2[/C][C]-1922.825[/C][C]215.566748[/C][C]-8.9199[/C][C]0[/C][C]0[/C][/ROW]
[ROW][C]M3[/C][C]-1702.6625[/C][C]215.274496[/C][C]-7.9093[/C][C]0[/C][C]0[/C][/ROW]
[ROW][C]M4[/C][C]-1948.9[/C][C]215.01267[/C][C]-9.0641[/C][C]0[/C][C]0[/C][/ROW]
[ROW][C]M5[/C][C]-2068.7375[/C][C]214.781382[/C][C]-9.6318[/C][C]0[/C][C]0[/C][/ROW]
[ROW][C]M6[/C][C]-2110.575[/C][C]214.580731[/C][C]-9.8358[/C][C]0[/C][C]0[/C][/ROW]
[ROW][C]M7[/C][C]-1492.8125[/C][C]214.410803[/C][C]-6.9624[/C][C]0[/C][C]0[/C][/ROW]
[ROW][C]M8[/C][C]-1545.05[/C][C]214.271671[/C][C]-7.2107[/C][C]0[/C][C]0[/C][/ROW]
[ROW][C]M9[/C][C]-1683.4875[/C][C]214.163394[/C][C]-7.8608[/C][C]0[/C][C]0[/C][/ROW]
[ROW][C]M10[/C][C]-1474.925[/C][C]214.08602[/C][C]-6.8894[/C][C]0[/C][C]0[/C][/ROW]
[ROW][C]M11[/C][C]-827.5625[/C][C]214.039582[/C][C]-3.8664[/C][C]0.000338[/C][C]0.000169[/C][/ROW]
[ROW][C]t[/C][C]10.6375[/C][C]2.57431[/C][C]4.1322[/C][C]0.000147[/C][C]7.3e-05[/C][/ROW]
[/TABLE]
Source: https://freestatistics.org/blog/index.php?pk=147930&T=2

Globally Unique Identifier (entire table): ba.freestatistics.org/blog/index.php?pk=147930&T=2

As an alternative you can also use a QR Code:  

The GUIDs for individual cells are displayed in the table below:

Multiple Linear Regression - Ordinary Least Squares
VariableParameterS.D.T-STATH0: parameter = 02-tail p-value1-tail p-value
(Intercept)4842.45177.4594127.287600
M1-2834.9875215.889303-13.131700
M2-1922.825215.566748-8.919900
M3-1702.6625215.274496-7.909300
M4-1948.9215.01267-9.064100
M5-2068.7375214.781382-9.631800
M6-2110.575214.580731-9.835800
M7-1492.8125214.410803-6.962400
M8-1545.05214.271671-7.210700
M9-1683.4875214.163394-7.860800
M10-1474.925214.08602-6.889400
M11-827.5625214.039582-3.86640.0003380.000169
t10.63752.574314.13220.0001477.3e-05


Multiple Linear Regression - Regression Statistics
Multiple R0.924371003038483
R-squared0.854461751258371
Adjusted R-squared0.817303049451997
F-TEST (value)22.9949301165256
F-TEST (DF numerator)12
F-TEST (DF denominator)47
p-value1.11022302462516e-15
Multiple Linear Regression - Residual Statistics
Residual Standard Deviation338.4018164279
Sum Squared Residuals5382242.10000001

\begin{tabular}{lllllllll}
\hline
Multiple Linear Regression - Regression Statistics \tabularnewline
Multiple R & 0.924371003038483 \tabularnewline
R-squared & 0.854461751258371 \tabularnewline
Adjusted R-squared & 0.817303049451997 \tabularnewline
F-TEST (value) & 22.9949301165256 \tabularnewline
F-TEST (DF numerator) & 12 \tabularnewline
F-TEST (DF denominator) & 47 \tabularnewline
p-value & 1.11022302462516e-15 \tabularnewline
Multiple Linear Regression - Residual Statistics \tabularnewline
Residual Standard Deviation & 338.4018164279 \tabularnewline
Sum Squared Residuals & 5382242.10000001 \tabularnewline
\hline
\end{tabular}
%Source: https://freestatistics.org/blog/index.php?pk=147930&T=3

[TABLE]
[ROW][C]Multiple Linear Regression - Regression Statistics[/C][/ROW]
[ROW][C]Multiple R[/C][C]0.924371003038483[/C][/ROW]
[ROW][C]R-squared[/C][C]0.854461751258371[/C][/ROW]
[ROW][C]Adjusted R-squared[/C][C]0.817303049451997[/C][/ROW]
[ROW][C]F-TEST (value)[/C][C]22.9949301165256[/C][/ROW]
[ROW][C]F-TEST (DF numerator)[/C][C]12[/C][/ROW]
[ROW][C]F-TEST (DF denominator)[/C][C]47[/C][/ROW]
[ROW][C]p-value[/C][C]1.11022302462516e-15[/C][/ROW]
[ROW][C]Multiple Linear Regression - Residual Statistics[/C][/ROW]
[ROW][C]Residual Standard Deviation[/C][C]338.4018164279[/C][/ROW]
[ROW][C]Sum Squared Residuals[/C][C]5382242.10000001[/C][/ROW]
[/TABLE]
Source: https://freestatistics.org/blog/index.php?pk=147930&T=3

Globally Unique Identifier (entire table): ba.freestatistics.org/blog/index.php?pk=147930&T=3

As an alternative you can also use a QR Code:  

The GUIDs for individual cells are displayed in the table below:

Multiple Linear Regression - Regression Statistics
Multiple R0.924371003038483
R-squared0.854461751258371
Adjusted R-squared0.817303049451997
F-TEST (value)22.9949301165256
F-TEST (DF numerator)12
F-TEST (DF denominator)47
p-value1.11022302462516e-15
Multiple Linear Regression - Residual Statistics
Residual Standard Deviation338.4018164279
Sum Squared Residuals5382242.10000001


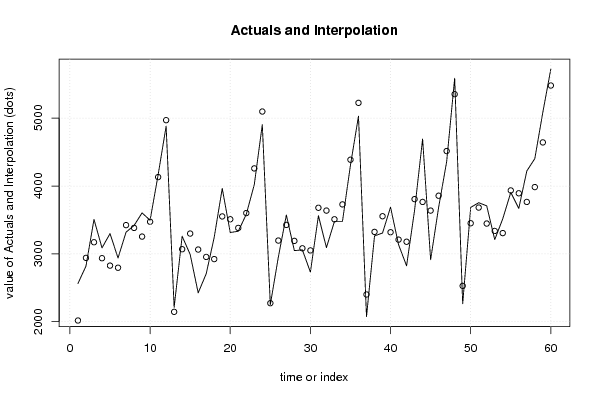
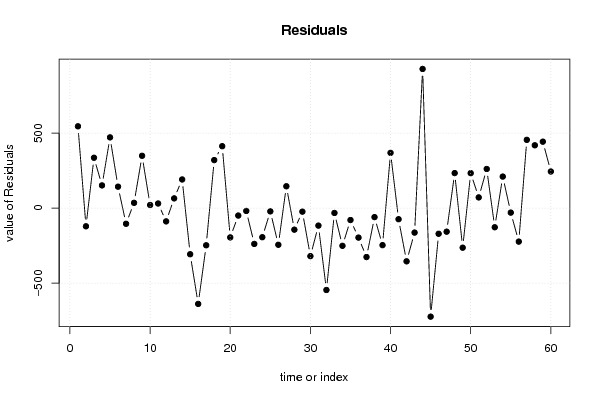
Multiple Linear Regression - Actuals, Interpolation, and Residuals
Time or IndexActualsInterpolationForecastResidualsPrediction Error
125642018.09999999999545.900000000009
228202940.9-120.900000000001
335083171.7336.3
430882936.1151.9
532992826.9472.1
629392795.7143.3
733203424.1-104.1
834183382.535.4999999999997
936043254.7349.3
1034953473.921.0999999999997
1141634131.931.0999999999996
1248824970.1-88.1000000000003
1322112145.7565.2499999999975
1432603068.55191.45
1529923299.35-307.35
1624253063.75-638.75
1727072954.55-247.55
1832442923.35320.65
1939653551.75413.25
2033153510.15-195.15
2133333382.35-49.3500000000003
2235833601.55-18.5500000000001
2340214259.55-238.55
2449045097.75-193.75
2522522273.4-21.4000000000022
2629523196.2-244.2
2735733427146
2830483191.4-143.4
2930593082.2-23.2
3027313051-320
3135633679.4-116.4
3230923637.8-545.8
3334783510-32.0000000000002
3434783729.2-251.2
3543084387.2-79.2000000000001
3650295225.4-196.4
3720752401.05-326.050000000002
3832643323.85-59.8499999999998
3933083554.65-246.65
4036883319.05368.95
4131363209.85-73.8499999999999
4228243178.65-354.65
4336443807.05-163.05
4446943765.45928.55
4529143637.65-723.65
4636863856.85-170.85
4743584514.85-156.85
4855875353.05233.950000000001
4922652528.7-263.700000000002
5036853451.5233.5
5137543682.371.7000000000003
5237083446.7261.3
5332103337.5-127.5
5435173306.3210.7
5539053934.7-29.6999999999996
5636703893.1-223.1
5742213765.3455.7
5844043984.5419.5
5950864642.5443.5
6057255480.7244.300000000001

\begin{tabular}{lllllllll}
\hline
Multiple Linear Regression - Actuals, Interpolation, and Residuals \tabularnewline
Time or Index & Actuals & InterpolationForecast & ResidualsPrediction Error \tabularnewline
1 & 2564 & 2018.09999999999 & 545.900000000009 \tabularnewline
2 & 2820 & 2940.9 & -120.900000000001 \tabularnewline
3 & 3508 & 3171.7 & 336.3 \tabularnewline
4 & 3088 & 2936.1 & 151.9 \tabularnewline
5 & 3299 & 2826.9 & 472.1 \tabularnewline
6 & 2939 & 2795.7 & 143.3 \tabularnewline
7 & 3320 & 3424.1 & -104.1 \tabularnewline
8 & 3418 & 3382.5 & 35.4999999999997 \tabularnewline
9 & 3604 & 3254.7 & 349.3 \tabularnewline
10 & 3495 & 3473.9 & 21.0999999999997 \tabularnewline
11 & 4163 & 4131.9 & 31.0999999999996 \tabularnewline
12 & 4882 & 4970.1 & -88.1000000000003 \tabularnewline
13 & 2211 & 2145.75 & 65.2499999999975 \tabularnewline
14 & 3260 & 3068.55 & 191.45 \tabularnewline
15 & 2992 & 3299.35 & -307.35 \tabularnewline
16 & 2425 & 3063.75 & -638.75 \tabularnewline
17 & 2707 & 2954.55 & -247.55 \tabularnewline
18 & 3244 & 2923.35 & 320.65 \tabularnewline
19 & 3965 & 3551.75 & 413.25 \tabularnewline
20 & 3315 & 3510.15 & -195.15 \tabularnewline
21 & 3333 & 3382.35 & -49.3500000000003 \tabularnewline
22 & 3583 & 3601.55 & -18.5500000000001 \tabularnewline
23 & 4021 & 4259.55 & -238.55 \tabularnewline
24 & 4904 & 5097.75 & -193.75 \tabularnewline
25 & 2252 & 2273.4 & -21.4000000000022 \tabularnewline
26 & 2952 & 3196.2 & -244.2 \tabularnewline
27 & 3573 & 3427 & 146 \tabularnewline
28 & 3048 & 3191.4 & -143.4 \tabularnewline
29 & 3059 & 3082.2 & -23.2 \tabularnewline
30 & 2731 & 3051 & -320 \tabularnewline
31 & 3563 & 3679.4 & -116.4 \tabularnewline
32 & 3092 & 3637.8 & -545.8 \tabularnewline
33 & 3478 & 3510 & -32.0000000000002 \tabularnewline
34 & 3478 & 3729.2 & -251.2 \tabularnewline
35 & 4308 & 4387.2 & -79.2000000000001 \tabularnewline
36 & 5029 & 5225.4 & -196.4 \tabularnewline
37 & 2075 & 2401.05 & -326.050000000002 \tabularnewline
38 & 3264 & 3323.85 & -59.8499999999998 \tabularnewline
39 & 3308 & 3554.65 & -246.65 \tabularnewline
40 & 3688 & 3319.05 & 368.95 \tabularnewline
41 & 3136 & 3209.85 & -73.8499999999999 \tabularnewline
42 & 2824 & 3178.65 & -354.65 \tabularnewline
43 & 3644 & 3807.05 & -163.05 \tabularnewline
44 & 4694 & 3765.45 & 928.55 \tabularnewline
45 & 2914 & 3637.65 & -723.65 \tabularnewline
46 & 3686 & 3856.85 & -170.85 \tabularnewline
47 & 4358 & 4514.85 & -156.85 \tabularnewline
48 & 5587 & 5353.05 & 233.950000000001 \tabularnewline
49 & 2265 & 2528.7 & -263.700000000002 \tabularnewline
50 & 3685 & 3451.5 & 233.5 \tabularnewline
51 & 3754 & 3682.3 & 71.7000000000003 \tabularnewline
52 & 3708 & 3446.7 & 261.3 \tabularnewline
53 & 3210 & 3337.5 & -127.5 \tabularnewline
54 & 3517 & 3306.3 & 210.7 \tabularnewline
55 & 3905 & 3934.7 & -29.6999999999996 \tabularnewline
56 & 3670 & 3893.1 & -223.1 \tabularnewline
57 & 4221 & 3765.3 & 455.7 \tabularnewline
58 & 4404 & 3984.5 & 419.5 \tabularnewline
59 & 5086 & 4642.5 & 443.5 \tabularnewline
60 & 5725 & 5480.7 & 244.300000000001 \tabularnewline
\hline
\end{tabular}
%Source: https://freestatistics.org/blog/index.php?pk=147930&T=4

[TABLE]
[ROW][C]Multiple Linear Regression - Actuals, Interpolation, and Residuals[/C][/ROW]
[ROW][C]Time or Index[/C][C]Actuals[/C][C]InterpolationForecast[/C][C]ResidualsPrediction Error[/C][/ROW]
[ROW][C]1[/C][C]2564[/C][C]2018.09999999999[/C][C]545.900000000009[/C][/ROW]
[ROW][C]2[/C][C]2820[/C][C]2940.9[/C][C]-120.900000000001[/C][/ROW]
[ROW][C]3[/C][C]3508[/C][C]3171.7[/C][C]336.3[/C][/ROW]
[ROW][C]4[/C][C]3088[/C][C]2936.1[/C][C]151.9[/C][/ROW]
[ROW][C]5[/C][C]3299[/C][C]2826.9[/C][C]472.1[/C][/ROW]
[ROW][C]6[/C][C]2939[/C][C]2795.7[/C][C]143.3[/C][/ROW]
[ROW][C]7[/C][C]3320[/C][C]3424.1[/C][C]-104.1[/C][/ROW]
[ROW][C]8[/C][C]3418[/C][C]3382.5[/C][C]35.4999999999997[/C][/ROW]
[ROW][C]9[/C][C]3604[/C][C]3254.7[/C][C]349.3[/C][/ROW]
[ROW][C]10[/C][C]3495[/C][C]3473.9[/C][C]21.0999999999997[/C][/ROW]
[ROW][C]11[/C][C]4163[/C][C]4131.9[/C][C]31.0999999999996[/C][/ROW]
[ROW][C]12[/C][C]4882[/C][C]4970.1[/C][C]-88.1000000000003[/C][/ROW]
[ROW][C]13[/C][C]2211[/C][C]2145.75[/C][C]65.2499999999975[/C][/ROW]
[ROW][C]14[/C][C]3260[/C][C]3068.55[/C][C]191.45[/C][/ROW]
[ROW][C]15[/C][C]2992[/C][C]3299.35[/C][C]-307.35[/C][/ROW]
[ROW][C]16[/C][C]2425[/C][C]3063.75[/C][C]-638.75[/C][/ROW]
[ROW][C]17[/C][C]2707[/C][C]2954.55[/C][C]-247.55[/C][/ROW]
[ROW][C]18[/C][C]3244[/C][C]2923.35[/C][C]320.65[/C][/ROW]
[ROW][C]19[/C][C]3965[/C][C]3551.75[/C][C]413.25[/C][/ROW]
[ROW][C]20[/C][C]3315[/C][C]3510.15[/C][C]-195.15[/C][/ROW]
[ROW][C]21[/C][C]3333[/C][C]3382.35[/C][C]-49.3500000000003[/C][/ROW]
[ROW][C]22[/C][C]3583[/C][C]3601.55[/C][C]-18.5500000000001[/C][/ROW]
[ROW][C]23[/C][C]4021[/C][C]4259.55[/C][C]-238.55[/C][/ROW]
[ROW][C]24[/C][C]4904[/C][C]5097.75[/C][C]-193.75[/C][/ROW]
[ROW][C]25[/C][C]2252[/C][C]2273.4[/C][C]-21.4000000000022[/C][/ROW]
[ROW][C]26[/C][C]2952[/C][C]3196.2[/C][C]-244.2[/C][/ROW]
[ROW][C]27[/C][C]3573[/C][C]3427[/C][C]146[/C][/ROW]
[ROW][C]28[/C][C]3048[/C][C]3191.4[/C][C]-143.4[/C][/ROW]
[ROW][C]29[/C][C]3059[/C][C]3082.2[/C][C]-23.2[/C][/ROW]
[ROW][C]30[/C][C]2731[/C][C]3051[/C][C]-320[/C][/ROW]
[ROW][C]31[/C][C]3563[/C][C]3679.4[/C][C]-116.4[/C][/ROW]
[ROW][C]32[/C][C]3092[/C][C]3637.8[/C][C]-545.8[/C][/ROW]
[ROW][C]33[/C][C]3478[/C][C]3510[/C][C]-32.0000000000002[/C][/ROW]
[ROW][C]34[/C][C]3478[/C][C]3729.2[/C][C]-251.2[/C][/ROW]
[ROW][C]35[/C][C]4308[/C][C]4387.2[/C][C]-79.2000000000001[/C][/ROW]
[ROW][C]36[/C][C]5029[/C][C]5225.4[/C][C]-196.4[/C][/ROW]
[ROW][C]37[/C][C]2075[/C][C]2401.05[/C][C]-326.050000000002[/C][/ROW]
[ROW][C]38[/C][C]3264[/C][C]3323.85[/C][C]-59.8499999999998[/C][/ROW]
[ROW][C]39[/C][C]3308[/C][C]3554.65[/C][C]-246.65[/C][/ROW]
[ROW][C]40[/C][C]3688[/C][C]3319.05[/C][C]368.95[/C][/ROW]
[ROW][C]41[/C][C]3136[/C][C]3209.85[/C][C]-73.8499999999999[/C][/ROW]
[ROW][C]42[/C][C]2824[/C][C]3178.65[/C][C]-354.65[/C][/ROW]
[ROW][C]43[/C][C]3644[/C][C]3807.05[/C][C]-163.05[/C][/ROW]
[ROW][C]44[/C][C]4694[/C][C]3765.45[/C][C]928.55[/C][/ROW]
[ROW][C]45[/C][C]2914[/C][C]3637.65[/C][C]-723.65[/C][/ROW]
[ROW][C]46[/C][C]3686[/C][C]3856.85[/C][C]-170.85[/C][/ROW]
[ROW][C]47[/C][C]4358[/C][C]4514.85[/C][C]-156.85[/C][/ROW]
[ROW][C]48[/C][C]5587[/C][C]5353.05[/C][C]233.950000000001[/C][/ROW]
[ROW][C]49[/C][C]2265[/C][C]2528.7[/C][C]-263.700000000002[/C][/ROW]
[ROW][C]50[/C][C]3685[/C][C]3451.5[/C][C]233.5[/C][/ROW]
[ROW][C]51[/C][C]3754[/C][C]3682.3[/C][C]71.7000000000003[/C][/ROW]
[ROW][C]52[/C][C]3708[/C][C]3446.7[/C][C]261.3[/C][/ROW]
[ROW][C]53[/C][C]3210[/C][C]3337.5[/C][C]-127.5[/C][/ROW]
[ROW][C]54[/C][C]3517[/C][C]3306.3[/C][C]210.7[/C][/ROW]
[ROW][C]55[/C][C]3905[/C][C]3934.7[/C][C]-29.6999999999996[/C][/ROW]
[ROW][C]56[/C][C]3670[/C][C]3893.1[/C][C]-223.1[/C][/ROW]
[ROW][C]57[/C][C]4221[/C][C]3765.3[/C][C]455.7[/C][/ROW]
[ROW][C]58[/C][C]4404[/C][C]3984.5[/C][C]419.5[/C][/ROW]
[ROW][C]59[/C][C]5086[/C][C]4642.5[/C][C]443.5[/C][/ROW]
[ROW][C]60[/C][C]5725[/C][C]5480.7[/C][C]244.300000000001[/C][/ROW]
[/TABLE]
Source: https://freestatistics.org/blog/index.php?pk=147930&T=4

Globally Unique Identifier (entire table): ba.freestatistics.org/blog/index.php?pk=147930&T=4

As an alternative you can also use a QR Code:  

The GUIDs for individual cells are displayed in the table below:

Multiple Linear Regression - Actuals, Interpolation, and Residuals
Time or IndexActualsInterpolationForecastResidualsPrediction Error
125642018.09999999999545.900000000009
228202940.9-120.900000000001
335083171.7336.3
430882936.1151.9
532992826.9472.1
629392795.7143.3
733203424.1-104.1
834183382.535.4999999999997
936043254.7349.3
1034953473.921.0999999999997
1141634131.931.0999999999996
1248824970.1-88.1000000000003
1322112145.7565.2499999999975
1432603068.55191.45
1529923299.35-307.35
1624253063.75-638.75
1727072954.55-247.55
1832442923.35320.65
1939653551.75413.25
2033153510.15-195.15
2133333382.35-49.3500000000003
2235833601.55-18.5500000000001
2340214259.55-238.55
2449045097.75-193.75
2522522273.4-21.4000000000022
2629523196.2-244.2
2735733427146
2830483191.4-143.4
2930593082.2-23.2
3027313051-320
3135633679.4-116.4
3230923637.8-545.8
3334783510-32.0000000000002
3434783729.2-251.2
3543084387.2-79.2000000000001
3650295225.4-196.4
3720752401.05-326.050000000002
3832643323.85-59.8499999999998
3933083554.65-246.65
4036883319.05368.95
4131363209.85-73.8499999999999
4228243178.65-354.65
4336443807.05-163.05
4446943765.45928.55
4529143637.65-723.65
4636863856.85-170.85
4743584514.85-156.85
4855875353.05233.950000000001
4922652528.7-263.700000000002
5036853451.5233.5
5137543682.371.7000000000003
5237083446.7261.3
5332103337.5-127.5
5435173306.3210.7
5539053934.7-29.6999999999996
5636703893.1-223.1
5742213765.3455.7
5844043984.5419.5
5950864642.5443.5
6057255480.7244.300000000001


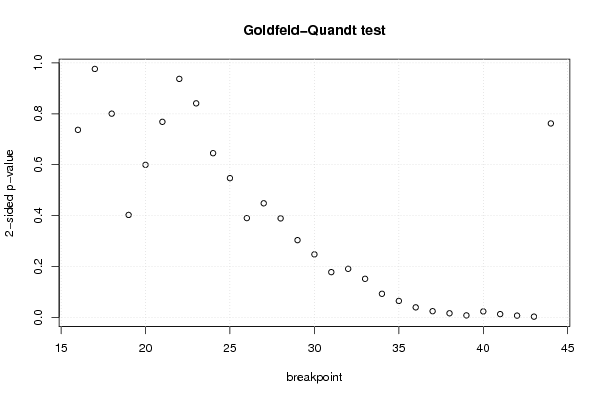
Goldfeld-Quandt test for Heteroskedasticity
p-valuesAlternative Hypothesis
breakpoint indexgreater2-sidedless
160.631629268899310.7367414622013810.36837073110069
170.5118841074768030.9762317850463950.488115892523197
180.5997952888957660.8004094222084670.400204711104234
190.798803148175950.4023937036480990.20119685182405
200.7003473854579190.5993052290841610.299652614542081
210.6158153754477150.7683692491045710.384184624552285
220.5314335719605150.9371328560789710.468566428039485
230.4205226874851520.8410453749703040.579477312514848
240.3225258287089710.6450516574179430.677474171291029
250.2734833143422530.5469666286845070.726516685657747
260.1949627759061270.3899255518122550.805037224093873
270.2240677241196480.4481354482392950.775932275880352
280.1943848222103930.3887696444207870.805615177789607
290.1516034485145410.3032068970290810.848396551485459
300.1236369178678860.2472738357357710.876363082132114
310.08873477138375920.1774695427675180.911265228616241
320.09523860041549860.1904772008309970.904761399584501
330.07559699179644750.1511939835928950.924403008203553
340.04614695810567740.09229391621135490.953853041894323
350.03207828321606270.06415656643212540.967921716783937
360.01952092289298910.03904184578597820.980479077107011
370.0119351643533650.023870328706730.988064835646635
380.00785098154975380.01570196309950760.992149018450246
390.00373500169770250.0074700033954050.996264998302298
400.01148172999388440.02296345998776880.988518270006116
410.006173823764396260.01234764752879250.993826176235604
420.00326092819060810.006521856381216210.996739071809392
430.001218093348411980.002436186696823960.998781906651588
440.3810124420911590.7620248841823180.618987557908841

\begin{tabular}{lllllllll}
\hline
Goldfeld-Quandt test for Heteroskedasticity \tabularnewline
p-values & Alternative Hypothesis \tabularnewline
breakpoint index & greater & 2-sided & less \tabularnewline
16 & 0.63162926889931 & 0.736741462201381 & 0.36837073110069 \tabularnewline
17 & 0.511884107476803 & 0.976231785046395 & 0.488115892523197 \tabularnewline
18 & 0.599795288895766 & 0.800409422208467 & 0.400204711104234 \tabularnewline
19 & 0.79880314817595 & 0.402393703648099 & 0.20119685182405 \tabularnewline
20 & 0.700347385457919 & 0.599305229084161 & 0.299652614542081 \tabularnewline
21 & 0.615815375447715 & 0.768369249104571 & 0.384184624552285 \tabularnewline
22 & 0.531433571960515 & 0.937132856078971 & 0.468566428039485 \tabularnewline
23 & 0.420522687485152 & 0.841045374970304 & 0.579477312514848 \tabularnewline
24 & 0.322525828708971 & 0.645051657417943 & 0.677474171291029 \tabularnewline
25 & 0.273483314342253 & 0.546966628684507 & 0.726516685657747 \tabularnewline
26 & 0.194962775906127 & 0.389925551812255 & 0.805037224093873 \tabularnewline
27 & 0.224067724119648 & 0.448135448239295 & 0.775932275880352 \tabularnewline
28 & 0.194384822210393 & 0.388769644420787 & 0.805615177789607 \tabularnewline
29 & 0.151603448514541 & 0.303206897029081 & 0.848396551485459 \tabularnewline
30 & 0.123636917867886 & 0.247273835735771 & 0.876363082132114 \tabularnewline
31 & 0.0887347713837592 & 0.177469542767518 & 0.911265228616241 \tabularnewline
32 & 0.0952386004154986 & 0.190477200830997 & 0.904761399584501 \tabularnewline
33 & 0.0755969917964475 & 0.151193983592895 & 0.924403008203553 \tabularnewline
34 & 0.0461469581056774 & 0.0922939162113549 & 0.953853041894323 \tabularnewline
35 & 0.0320782832160627 & 0.0641565664321254 & 0.967921716783937 \tabularnewline
36 & 0.0195209228929891 & 0.0390418457859782 & 0.980479077107011 \tabularnewline
37 & 0.011935164353365 & 0.02387032870673 & 0.988064835646635 \tabularnewline
38 & 0.0078509815497538 & 0.0157019630995076 & 0.992149018450246 \tabularnewline
39 & 0.0037350016977025 & 0.007470003395405 & 0.996264998302298 \tabularnewline
40 & 0.0114817299938844 & 0.0229634599877688 & 0.988518270006116 \tabularnewline
41 & 0.00617382376439626 & 0.0123476475287925 & 0.993826176235604 \tabularnewline
42 & 0.0032609281906081 & 0.00652185638121621 & 0.996739071809392 \tabularnewline
43 & 0.00121809334841198 & 0.00243618669682396 & 0.998781906651588 \tabularnewline
44 & 0.381012442091159 & 0.762024884182318 & 0.618987557908841 \tabularnewline
\hline
\end{tabular}
%Source: https://freestatistics.org/blog/index.php?pk=147930&T=5

[TABLE]
[ROW][C]Goldfeld-Quandt test for Heteroskedasticity[/C][/ROW]
[ROW][C]p-values[/C][C]Alternative Hypothesis[/C][/ROW]
[ROW][C]breakpoint index[/C][C]greater[/C][C]2-sided[/C][C]less[/C][/ROW]
[ROW][C]16[/C][C]0.63162926889931[/C][C]0.736741462201381[/C][C]0.36837073110069[/C][/ROW]
[ROW][C]17[/C][C]0.511884107476803[/C][C]0.976231785046395[/C][C]0.488115892523197[/C][/ROW]
[ROW][C]18[/C][C]0.599795288895766[/C][C]0.800409422208467[/C][C]0.400204711104234[/C][/ROW]
[ROW][C]19[/C][C]0.79880314817595[/C][C]0.402393703648099[/C][C]0.20119685182405[/C][/ROW]
[ROW][C]20[/C][C]0.700347385457919[/C][C]0.599305229084161[/C][C]0.299652614542081[/C][/ROW]
[ROW][C]21[/C][C]0.615815375447715[/C][C]0.768369249104571[/C][C]0.384184624552285[/C][/ROW]
[ROW][C]22[/C][C]0.531433571960515[/C][C]0.937132856078971[/C][C]0.468566428039485[/C][/ROW]
[ROW][C]23[/C][C]0.420522687485152[/C][C]0.841045374970304[/C][C]0.579477312514848[/C][/ROW]
[ROW][C]24[/C][C]0.322525828708971[/C][C]0.645051657417943[/C][C]0.677474171291029[/C][/ROW]
[ROW][C]25[/C][C]0.273483314342253[/C][C]0.546966628684507[/C][C]0.726516685657747[/C][/ROW]
[ROW][C]26[/C][C]0.194962775906127[/C][C]0.389925551812255[/C][C]0.805037224093873[/C][/ROW]
[ROW][C]27[/C][C]0.224067724119648[/C][C]0.448135448239295[/C][C]0.775932275880352[/C][/ROW]
[ROW][C]28[/C][C]0.194384822210393[/C][C]0.388769644420787[/C][C]0.805615177789607[/C][/ROW]
[ROW][C]29[/C][C]0.151603448514541[/C][C]0.303206897029081[/C][C]0.848396551485459[/C][/ROW]
[ROW][C]30[/C][C]0.123636917867886[/C][C]0.247273835735771[/C][C]0.876363082132114[/C][/ROW]
[ROW][C]31[/C][C]0.0887347713837592[/C][C]0.177469542767518[/C][C]0.911265228616241[/C][/ROW]
[ROW][C]32[/C][C]0.0952386004154986[/C][C]0.190477200830997[/C][C]0.904761399584501[/C][/ROW]
[ROW][C]33[/C][C]0.0755969917964475[/C][C]0.151193983592895[/C][C]0.924403008203553[/C][/ROW]
[ROW][C]34[/C][C]0.0461469581056774[/C][C]0.0922939162113549[/C][C]0.953853041894323[/C][/ROW]
[ROW][C]35[/C][C]0.0320782832160627[/C][C]0.0641565664321254[/C][C]0.967921716783937[/C][/ROW]
[ROW][C]36[/C][C]0.0195209228929891[/C][C]0.0390418457859782[/C][C]0.980479077107011[/C][/ROW]
[ROW][C]37[/C][C]0.011935164353365[/C][C]0.02387032870673[/C][C]0.988064835646635[/C][/ROW]
[ROW][C]38[/C][C]0.0078509815497538[/C][C]0.0157019630995076[/C][C]0.992149018450246[/C][/ROW]
[ROW][C]39[/C][C]0.0037350016977025[/C][C]0.007470003395405[/C][C]0.996264998302298[/C][/ROW]
[ROW][C]40[/C][C]0.0114817299938844[/C][C]0.0229634599877688[/C][C]0.988518270006116[/C][/ROW]
[ROW][C]41[/C][C]0.00617382376439626[/C][C]0.0123476475287925[/C][C]0.993826176235604[/C][/ROW]
[ROW][C]42[/C][C]0.0032609281906081[/C][C]0.00652185638121621[/C][C]0.996739071809392[/C][/ROW]
[ROW][C]43[/C][C]0.00121809334841198[/C][C]0.00243618669682396[/C][C]0.998781906651588[/C][/ROW]
[ROW][C]44[/C][C]0.381012442091159[/C][C]0.762024884182318[/C][C]0.618987557908841[/C][/ROW]
[/TABLE]
Source: https://freestatistics.org/blog/index.php?pk=147930&T=5

Globally Unique Identifier (entire table): ba.freestatistics.org/blog/index.php?pk=147930&T=5

As an alternative you can also use a QR Code:  

The GUIDs for individual cells are displayed in the table below:

Goldfeld-Quandt test for Heteroskedasticity
p-valuesAlternative Hypothesis
breakpoint indexgreater2-sidedless
160.631629268899310.7367414622013810.36837073110069
170.5118841074768030.9762317850463950.488115892523197
180.5997952888957660.8004094222084670.400204711104234
190.798803148175950.4023937036480990.20119685182405
200.7003473854579190.5993052290841610.299652614542081
210.6158153754477150.7683692491045710.384184624552285
220.5314335719605150.9371328560789710.468566428039485
230.4205226874851520.8410453749703040.579477312514848
240.3225258287089710.6450516574179430.677474171291029
250.2734833143422530.5469666286845070.726516685657747
260.1949627759061270.3899255518122550.805037224093873
270.2240677241196480.4481354482392950.775932275880352
280.1943848222103930.3887696444207870.805615177789607
290.1516034485145410.3032068970290810.848396551485459
300.1236369178678860.2472738357357710.876363082132114
310.08873477138375920.1774695427675180.911265228616241
320.09523860041549860.1904772008309970.904761399584501
330.07559699179644750.1511939835928950.924403008203553
340.04614695810567740.09229391621135490.953853041894323
350.03207828321606270.06415656643212540.967921716783937
360.01952092289298910.03904184578597820.980479077107011
370.0119351643533650.023870328706730.988064835646635
380.00785098154975380.01570196309950760.992149018450246
390.00373500169770250.0074700033954050.996264998302298
400.01148172999388440.02296345998776880.988518270006116
410.006173823764396260.01234764752879250.993826176235604
420.00326092819060810.006521856381216210.996739071809392
430.001218093348411980.002436186696823960.998781906651588
440.3810124420911590.7620248841823180.618987557908841


Meta Analysis of Goldfeld-Quandt test for Heteroskedasticity
Description# significant tests% significant testsOK/NOK
1% type I error level30.103448275862069NOK
5% type I error level80.275862068965517NOK
10% type I error level100.344827586206897NOK

\begin{tabular}{lllllllll}
\hline
Meta Analysis of Goldfeld-Quandt test for Heteroskedasticity \tabularnewline
Description & # significant tests & % significant tests & OK/NOK \tabularnewline
1% type I error level & 3 & 0.103448275862069 & NOK \tabularnewline
5% type I error level & 8 & 0.275862068965517 & NOK \tabularnewline
10% type I error level & 10 & 0.344827586206897 & NOK \tabularnewline
\hline
\end{tabular}
%Source: https://freestatistics.org/blog/index.php?pk=147930&T=6

[TABLE]
[ROW][C]Meta Analysis of Goldfeld-Quandt test for Heteroskedasticity[/C][/ROW]
[ROW][C]Description[/C][C]# significant tests[/C][C]% significant tests[/C][C]OK/NOK[/C][/ROW]
[ROW][C]1% type I error level[/C][C]3[/C][C]0.103448275862069[/C][C]NOK[/C][/ROW]
[ROW][C]5% type I error level[/C][C]8[/C][C]0.275862068965517[/C][C]NOK[/C][/ROW]
[ROW][C]10% type I error level[/C][C]10[/C][C]0.344827586206897[/C][C]NOK[/C][/ROW]
[/TABLE]
Source: https://freestatistics.org/blog/index.php?pk=147930&T=6

Globally Unique Identifier (entire table): ba.freestatistics.org/blog/index.php?pk=147930&T=6

As an alternative you can also use a QR Code:  

The GUIDs for individual cells are displayed in the table below:

Meta Analysis of Goldfeld-Quandt test for Heteroskedasticity
Description# significant tests% significant testsOK/NOK
1% type I error level30.103448275862069NOK
5% type I error level80.275862068965517NOK
10% type I error level100.344827586206897NOK


Parameters (Session):
par1 = 1 ; par2 = Include Monthly Dummies ; par3 = Linear Trend ;
Parameters (R input):
par1 = 1 ; par2 = Include Monthly Dummies ; par3 = Linear Trend ;
R code (references can be found in the software module):
library(lattice)
library(lmtest)
n25 <- 25 #minimum number of obs. for Goldfeld-Quandt test
par1 <- as.numeric(par1)
x <- t(y)
k <- length(x[1,])
n <- length(x[,1])
x1 <- cbind(x[,par1], x[,1:k!=par1])
mycolnames <- c(colnames(x)[par1], colnames(x)[1:k!=par1])
colnames(x1) <- mycolnames #colnames(x)[par1]
x <- x1
if (par3 == 'First Differences'){
x2 <- array(0, dim=c(n-1,k), dimnames=list(1:(n-1), paste('(1-B)',colnames(x),sep='')))
for (i in 1:n-1) {
for (j in 1:k) {
x2[i,j] <- x[i+1,j] - x[i,j]
}
}
x <- x2
}
if (par2 == 'Include Monthly Dummies'){
x2 <- array(0, dim=c(n,11), dimnames=list(1:n, paste('M', seq(1:11), sep ='')))
for (i in 1:11){
x2[seq(i,n,12),i] <- 1
}
x <- cbind(x, x2)
}
if (par2 == 'Include Quarterly Dummies'){
x2 <- array(0, dim=c(n,3), dimnames=list(1:n, paste('Q', seq(1:3), sep ='')))
for (i in 1:3){
x2[seq(i,n,4),i] <- 1
}
x <- cbind(x, x2)
}
k <- length(x[1,])
if (par3 == 'Linear Trend'){
x <- cbind(x, c(1:n))
colnames(x)[k+1] <- 't'
}
x
k <- length(x[1,])
df <- as.data.frame(x)
(mylm <- lm(df))
(mysum <- summary(mylm))
if (n > n25) {
kp3 <- k + 3
nmkm3 <- n - k - 3
gqarr <- array(NA, dim=c(nmkm3-kp3+1,3))
numgqtests <- 0
numsignificant1 <- 0
numsignificant5 <- 0
numsignificant10 <- 0
for (mypoint in kp3:nmkm3) {
j <- 0
numgqtests <- numgqtests + 1
for (myalt in c('greater', 'two.sided', 'less')) {
j <- j + 1
gqarr[mypoint-kp3+1,j] <- gqtest(mylm, point=mypoint, alternative=myalt)$p.value
}
if (gqarr[mypoint-kp3+1,2] < 0.01) numsignificant1 <- numsignificant1 + 1
if (gqarr[mypoint-kp3+1,2] < 0.05) numsignificant5 <- numsignificant5 + 1
if (gqarr[mypoint-kp3+1,2] < 0.10) numsignificant10 <- numsignificant10 + 1
}
gqarr
}
bitmap(file='test0.png')
plot(x[,1], type='l', main='Actuals and Interpolation', ylab='value of Actuals and Interpolation (dots)', xlab='time or index')
points(x[,1]-mysum$resid)
grid()
dev.off()
bitmap(file='test1.png')
plot(mysum$resid, type='b', pch=19, main='Residuals', ylab='value of Residuals', xlab='time or index')
grid()
dev.off()
bitmap(file='test2.png')
hist(mysum$resid, main='Residual Histogram', xlab='values of Residuals')
grid()
dev.off()
bitmap(file='test3.png')
densityplot(~mysum$resid,col='black',main='Residual Density Plot', xlab='values of Residuals')
dev.off()
bitmap(file='test4.png')
qqnorm(mysum$resid, main='Residual Normal Q-Q Plot')
qqline(mysum$resid)
grid()
dev.off()
(myerror <- as.ts(mysum$resid))
bitmap(file='test5.png')
dum <- cbind(lag(myerror,k=1),myerror)
dum
dum1 <- dum[2:length(myerror),]
dum1
z <- as.data.frame(dum1)
z
plot(z,main=paste('Residual Lag plot, lowess, and regression line'), ylab='values of Residuals', xlab='lagged values of Residuals')
lines(lowess(z))
abline(lm(z))
grid()
dev.off()
bitmap(file='test6.png')
acf(mysum$resid, lag.max=length(mysum$resid)/2, main='Residual Autocorrelation Function')
grid()
dev.off()
bitmap(file='test7.png')
pacf(mysum$resid, lag.max=length(mysum$resid)/2, main='Residual Partial Autocorrelation Function')
grid()
dev.off()
bitmap(file='test8.png')
opar <- par(mfrow = c(2,2), oma = c(0, 0, 1.1, 0))
plot(mylm, las = 1, sub='Residual Diagnostics')
par(opar)
dev.off()
if (n > n25) {
bitmap(file='test9.png')
plot(kp3:nmkm3,gqarr[,2], main='Goldfeld-Quandt test',ylab='2-sided p-value',xlab='breakpoint')
grid()
dev.off()
}
load(file='createtable')
a<-table.start()
a<-table.row.start(a)
a<-table.element(a, 'Multiple Linear Regression - Estimated Regression Equation', 1, TRUE)
a<-table.row.end(a)
myeq <- colnames(x)[1]
myeq <- paste(myeq, '[t] = ', sep='')
for (i in 1:k){
if (mysum$coefficients[i,1] > 0) myeq <- paste(myeq, '+', '')
myeq <- paste(myeq, mysum$coefficients[i,1], sep=' ')
if (rownames(mysum$coefficients)[i] != '(Intercept)') {
myeq <- paste(myeq, rownames(mysum$coefficients)[i], sep='')
if (rownames(mysum$coefficients)[i] != 't') myeq <- paste(myeq, '[t]', sep='')
}
}
myeq <- paste(myeq, ' + e[t]')
a<-table.row.start(a)
a<-table.element(a, myeq)
a<-table.row.end(a)
a<-table.end(a)
table.save(a,file='mytable1.tab')
a<-table.start()
a<-table.row.start(a)
a<-table.element(a,hyperlink('ols1.htm','Multiple Linear Regression - Ordinary Least Squares',''), 6, TRUE)
a<-table.row.end(a)
a<-table.row.start(a)
a<-table.element(a,'Variable',header=TRUE)
a<-table.element(a,'Parameter',header=TRUE)
a<-table.element(a,'S.D.',header=TRUE)
a<-table.element(a,'T-STAT
H0: parameter = 0',header=TRUE)
a<-table.element(a,'2-tail p-value',header=TRUE)
a<-table.element(a,'1-tail p-value',header=TRUE)
a<-table.row.end(a)
for (i in 1:k){
a<-table.row.start(a)
a<-table.element(a,rownames(mysum$coefficients)[i],header=TRUE)
a<-table.element(a,mysum$coefficients[i,1])
a<-table.element(a, round(mysum$coefficients[i,2],6))
a<-table.element(a, round(mysum$coefficients[i,3],4))
a<-table.element(a, round(mysum$coefficients[i,4],6))
a<-table.element(a, round(mysum$coefficients[i,4]/2,6))
a<-table.row.end(a)
}
a<-table.end(a)
table.save(a,file='mytable2.tab')
a<-table.start()
a<-table.row.start(a)
a<-table.element(a, 'Multiple Linear Regression - Regression Statistics', 2, TRUE)
a<-table.row.end(a)
a<-table.row.start(a)
a<-table.element(a, 'Multiple R',1,TRUE)
a<-table.element(a, sqrt(mysum$r.squared))
a<-table.row.end(a)
a<-table.row.start(a)
a<-table.element(a, 'R-squared',1,TRUE)
a<-table.element(a, mysum$r.squared)
a<-table.row.end(a)
a<-table.row.start(a)
a<-table.element(a, 'Adjusted R-squared',1,TRUE)
a<-table.element(a, mysum$adj.r.squared)
a<-table.row.end(a)
a<-table.row.start(a)
a<-table.element(a, 'F-TEST (value)',1,TRUE)
a<-table.element(a, mysum$fstatistic[1])
a<-table.row.end(a)
a<-table.row.start(a)
a<-table.element(a, 'F-TEST (DF numerator)',1,TRUE)
a<-table.element(a, mysum$fstatistic[2])
a<-table.row.end(a)
a<-table.row.start(a)
a<-table.element(a, 'F-TEST (DF denominator)',1,TRUE)
a<-table.element(a, mysum$fstatistic[3])
a<-table.row.end(a)
a<-table.row.start(a)
a<-table.element(a, 'p-value',1,TRUE)
a<-table.element(a, 1-pf(mysum$fstatistic[1],mysum$fstatistic[2],mysum$fstatistic[3]))
a<-table.row.end(a)
a<-table.row.start(a)
a<-table.element(a, 'Multiple Linear Regression - Residual Statistics', 2, TRUE)
a<-table.row.end(a)
a<-table.row.start(a)
a<-table.element(a, 'Residual Standard Deviation',1,TRUE)
a<-table.element(a, mysum$sigma)
a<-table.row.end(a)
a<-table.row.start(a)
a<-table.element(a, 'Sum Squared Residuals',1,TRUE)
a<-table.element(a, sum(myerror*myerror))
a<-table.row.end(a)
a<-table.end(a)
table.save(a,file='mytable3.tab')
a<-table.start()
a<-table.row.start(a)
a<-table.element(a, 'Multiple Linear Regression - Actuals, Interpolation, and Residuals', 4, TRUE)
a<-table.row.end(a)
a<-table.row.start(a)
a<-table.element(a, 'Time or Index', 1, TRUE)
a<-table.element(a, 'Actuals', 1, TRUE)
a<-table.element(a, 'Interpolation
Forecast', 1, TRUE)
a<-table.element(a, 'Residuals
Prediction Error', 1, TRUE)
a<-table.row.end(a)
for (i in 1:n) {
a<-table.row.start(a)
a<-table.element(a,i, 1, TRUE)
a<-table.element(a,x[i])
a<-table.element(a,x[i]-mysum$resid[i])
a<-table.element(a,mysum$resid[i])
a<-table.row.end(a)
}
a<-table.end(a)
table.save(a,file='mytable4.tab')
if (n > n25) {
a<-table.start()
a<-table.row.start(a)
a<-table.element(a,'Goldfeld-Quandt test for Heteroskedasticity',4,TRUE)
a<-table.row.end(a)
a<-table.row.start(a)
a<-table.element(a,'p-values',header=TRUE)
a<-table.element(a,'Alternative Hypothesis',3,header=TRUE)
a<-table.row.end(a)
a<-table.row.start(a)
a<-table.element(a,'breakpoint index',header=TRUE)
a<-table.element(a,'greater',header=TRUE)
a<-table.element(a,'2-sided',header=TRUE)
a<-table.element(a,'less',header=TRUE)
a<-table.row.end(a)
for (mypoint in kp3:nmkm3) {
a<-table.row.start(a)
a<-table.element(a,mypoint,header=TRUE)
a<-table.element(a,gqarr[mypoint-kp3+1,1])
a<-table.element(a,gqarr[mypoint-kp3+1,2])
a<-table.element(a,gqarr[mypoint-kp3+1,3])
a<-table.row.end(a)
}
a<-table.end(a)
table.save(a,file='mytable5.tab')
a<-table.start()
a<-table.row.start(a)
a<-table.element(a,'Meta Analysis of Goldfeld-Quandt test for Heteroskedasticity',4,TRUE)
a<-table.row.end(a)
a<-table.row.start(a)
a<-table.element(a,'Description',header=TRUE)
a<-table.element(a,'# significant tests',header=TRUE)
a<-table.element(a,'% significant tests',header=TRUE)
a<-table.element(a,'OK/NOK',header=TRUE)
a<-table.row.end(a)
a<-table.row.start(a)
a<-table.element(a,'1% type I error level',header=TRUE)
a<-table.element(a,numsignificant1)
a<-table.element(a,numsignificant1/numgqtests)
if (numsignificant1/numgqtests < 0.01) dum <- 'OK' else dum <- 'NOK'
a<-table.element(a,dum)
a<-table.row.end(a)
a<-table.row.start(a)
a<-table.element(a,'5% type I error level',header=TRUE)
a<-table.element(a,numsignificant5)
a<-table.element(a,numsignificant5/numgqtests)
if (numsignificant5/numgqtests < 0.05) dum <- 'OK' else dum <- 'NOK'
a<-table.element(a,dum)
a<-table.row.end(a)
a<-table.row.start(a)
a<-table.element(a,'10% type I error level',header=TRUE)
a<-table.element(a,numsignificant10)
a<-table.element(a,numsignificant10/numgqtests)
if (numsignificant10/numgqtests < 0.1) dum <- 'OK' else dum <- 'NOK'
a<-table.element(a,dum)
a<-table.row.end(a)
a<-table.end(a)
table.save(a,file='mytable6.tab')
}