Free Statistics

of Irreproducible Research!

Author's title

Author*The author of this computation has been verified*
R Software Modulerwasp_exponentialsmoothing.wasp
Title produced by softwareExponential Smoothing
Date of computationMon, 28 Nov 2011 12:36:59 -0500
Cite this page as followsStatistical Computations at FreeStatistics.org, Office for Research Development and Education, URL https://freestatistics.org/blog/index.php?v=date/2011/Nov/28/t1322501834aykj4ixuwoynw3k.htm/, Retrieved Thu, 18 Apr 2024 08:02:09 +0000
Statistical Computations at FreeStatistics.org, Office for Research Development and Education, URL https://freestatistics.org/blog/index.php?pk=147911, Retrieved Thu, 18 Apr 2024 08:02:09 +0000
QR Codes:

Original text written by user:
IsPrivate?No (this computation is public)
User-defined keywords
Estimated Impact126
Family? (F = Feedback message, R = changed R code, M = changed R Module, P = changed Parameters, D = changed Data)
-     [Exponential Smoothing] [HPC Retail Sales] [2008-03-10 17:43:04] [74be16979710d4c4e7c6647856088456]
- RMPD    [Exponential Smoothing] [WS8 Exponential S...] [2011-11-28 17:36:59] [2a6d487209befbc7c5ce02a41ecac161] [Current]
Feedback Forum

Post a new message
Dataseries X:
2564
2820
3508
3088
3299
2939
3320
3418
3604
3495
4163
4882
2211
3260
2992
2425
2707
3244
3965
3315
3333
3583
4021
4904
2252
2952
3573
3048
3059
2731
3563
3092
3478
3478
4308
5029
2075
3264
3308
3688
3136
2824
3644
4694
2914
3686
4358
5587
2265
3685
3754
3708
3210
3517
3905
3670
4221
4404
5086
5725


Summary of computational transaction
Raw Inputview raw input (R code)
Raw Outputview raw output of R engine
Computing time2 seconds
R Server'AstonUniversity' @ aston.wessa.net

\begin{tabular}{lllllllll}
\hline
Summary of computational transaction \tabularnewline
Raw Input & view raw input (R code)  \tabularnewline
Raw Output & view raw output of R engine  \tabularnewline
Computing time & 2 seconds \tabularnewline
R Server & 'AstonUniversity' @ aston.wessa.net \tabularnewline
\hline
\end{tabular}
%Source: https://freestatistics.org/blog/index.php?pk=147911&T=0

[TABLE]
[ROW][C]Summary of computational transaction[/C][/ROW]
[ROW][C]Raw Input[/C][C]view raw input (R code) [/C][/ROW]
[ROW][C]Raw Output[/C][C]view raw output of R engine [/C][/ROW]
[ROW][C]Computing time[/C][C]2 seconds[/C][/ROW]
[ROW][C]R Server[/C][C]'AstonUniversity' @ aston.wessa.net[/C][/ROW]
[/TABLE]
Source: https://freestatistics.org/blog/index.php?pk=147911&T=0

Globally Unique Identifier (entire table): ba.freestatistics.org/blog/index.php?pk=147911&T=0

As an alternative you can also use a QR Code:  

The GUIDs for individual cells are displayed in the table below:

Summary of computational transaction
Raw Inputview raw input (R code)
Raw Outputview raw output of R engine
Computing time2 seconds
R Server'AstonUniversity' @ aston.wessa.net


Estimated Parameters of Exponential Smoothing
ParameterValue
alpha0.0156062249385643
beta1
gamma0.313491651460045

\begin{tabular}{lllllllll}
\hline
Estimated Parameters of Exponential Smoothing \tabularnewline
Parameter & Value \tabularnewline
alpha & 0.0156062249385643 \tabularnewline
beta & 1 \tabularnewline
gamma & 0.313491651460045 \tabularnewline
\hline
\end{tabular}
%Source: https://freestatistics.org/blog/index.php?pk=147911&T=1

[TABLE]
[ROW][C]Estimated Parameters of Exponential Smoothing[/C][/ROW]
[ROW][C]Parameter[/C][C]Value[/C][/ROW]
[ROW][C]alpha[/C][C]0.0156062249385643[/C][/ROW]
[ROW][C]beta[/C][C]1[/C][/ROW]
[ROW][C]gamma[/C][C]0.313491651460045[/C][/ROW]
[/TABLE]
Source: https://freestatistics.org/blog/index.php?pk=147911&T=1

Globally Unique Identifier (entire table): ba.freestatistics.org/blog/index.php?pk=147911&T=1

As an alternative you can also use a QR Code:  

The GUIDs for individual cells are displayed in the table below:

Estimated Parameters of Exponential Smoothing
ParameterValue
alpha0.0156062249385643
beta1
gamma0.313491651460045


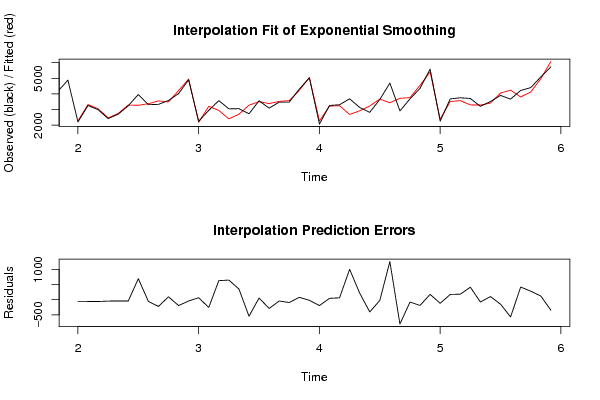
Interpolation Forecasts of Exponential Smoothing
tObservedFittedResiduals
1322112276.26681993523-65.2668199352343
1432603323.71049690156-63.7104969015568
1529923055.04593064689-63.045930646891
1624252473.07038613882-48.0703861388201
1727072752.03654662645-45.0365466264516
1832443289.65646864753-45.6564686475263
1939653272.71927701647692.280722983529
2033153374.47086448734-59.470864487339
2133333556.92822037387-223.928220373865
2235833489.440241487593.5597585125006
2340214217.26237589806-196.262375898061
2449044948.64173614133-44.6417361413278
2522522189.3511753414462.6488246585627
2629523210.91664934567-258.916649345669
2735732945.99230997926627.007690020735
2830482402.14743560913645.852564390869
2930592708.55197095952350.44802904048
3027313280.09895575317-549.098955753175
3135633508.6008481114354.3991518885664
3230923383.12933864106-291.129338641063
3334783524.16402651301-46.1640265130113
3434783572.81736273739-94.8173627373935
3543084231.8249850088376.1750149911659
3650295051.29014667762-22.2901466776157
3720752271.05705166955-196.057051669549
3832643222.1636074740841.8363925259214
3933083248.479252171259.5207478288025
4036882686.297194267011001.70280573299
4131362921.83514217467214.164857825328
4228243229.51986826372-405.519868263715
4336443671.9251322385-27.9251322385007
4446943435.841499170031258.15850082997
4529143721.06370512982-807.063705129816
4636863766.24011535297-80.2401153529672
4743584549.18454023505-191.184540235055
4855875413.44581144099173.554188559006
4922652386.11096635507-121.110966355073
5036853514.38288061765170.61711938235
5137543573.31408236988180.685917630124
5237083298.28856787069409.71143212931
5332103288.50797855588-78.5079785558796
5435173415.72129054443101.278709455568
5539054055.61560689415-150.615606894152
5636704242.58382502998-572.583825029978
5742213805.82354514974415.176454850255
5844044125.23900564378278.760994356218
5950864966.82886783347119.171132166525
6057256070.85593031182-345.855930311815

\begin{tabular}{lllllllll}
\hline
Interpolation Forecasts of Exponential Smoothing \tabularnewline
t & Observed & Fitted & Residuals \tabularnewline
13 & 2211 & 2276.26681993523 & -65.2668199352343 \tabularnewline
14 & 3260 & 3323.71049690156 & -63.7104969015568 \tabularnewline
15 & 2992 & 3055.04593064689 & -63.045930646891 \tabularnewline
16 & 2425 & 2473.07038613882 & -48.0703861388201 \tabularnewline
17 & 2707 & 2752.03654662645 & -45.0365466264516 \tabularnewline
18 & 3244 & 3289.65646864753 & -45.6564686475263 \tabularnewline
19 & 3965 & 3272.71927701647 & 692.280722983529 \tabularnewline
20 & 3315 & 3374.47086448734 & -59.470864487339 \tabularnewline
21 & 3333 & 3556.92822037387 & -223.928220373865 \tabularnewline
22 & 3583 & 3489.4402414875 & 93.5597585125006 \tabularnewline
23 & 4021 & 4217.26237589806 & -196.262375898061 \tabularnewline
24 & 4904 & 4948.64173614133 & -44.6417361413278 \tabularnewline
25 & 2252 & 2189.35117534144 & 62.6488246585627 \tabularnewline
26 & 2952 & 3210.91664934567 & -258.916649345669 \tabularnewline
27 & 3573 & 2945.99230997926 & 627.007690020735 \tabularnewline
28 & 3048 & 2402.14743560913 & 645.852564390869 \tabularnewline
29 & 3059 & 2708.55197095952 & 350.44802904048 \tabularnewline
30 & 2731 & 3280.09895575317 & -549.098955753175 \tabularnewline
31 & 3563 & 3508.60084811143 & 54.3991518885664 \tabularnewline
32 & 3092 & 3383.12933864106 & -291.129338641063 \tabularnewline
33 & 3478 & 3524.16402651301 & -46.1640265130113 \tabularnewline
34 & 3478 & 3572.81736273739 & -94.8173627373935 \tabularnewline
35 & 4308 & 4231.82498500883 & 76.1750149911659 \tabularnewline
36 & 5029 & 5051.29014667762 & -22.2901466776157 \tabularnewline
37 & 2075 & 2271.05705166955 & -196.057051669549 \tabularnewline
38 & 3264 & 3222.16360747408 & 41.8363925259214 \tabularnewline
39 & 3308 & 3248.4792521712 & 59.5207478288025 \tabularnewline
40 & 3688 & 2686.29719426701 & 1001.70280573299 \tabularnewline
41 & 3136 & 2921.83514217467 & 214.164857825328 \tabularnewline
42 & 2824 & 3229.51986826372 & -405.519868263715 \tabularnewline
43 & 3644 & 3671.9251322385 & -27.9251322385007 \tabularnewline
44 & 4694 & 3435.84149917003 & 1258.15850082997 \tabularnewline
45 & 2914 & 3721.06370512982 & -807.063705129816 \tabularnewline
46 & 3686 & 3766.24011535297 & -80.2401153529672 \tabularnewline
47 & 4358 & 4549.18454023505 & -191.184540235055 \tabularnewline
48 & 5587 & 5413.44581144099 & 173.554188559006 \tabularnewline
49 & 2265 & 2386.11096635507 & -121.110966355073 \tabularnewline
50 & 3685 & 3514.38288061765 & 170.61711938235 \tabularnewline
51 & 3754 & 3573.31408236988 & 180.685917630124 \tabularnewline
52 & 3708 & 3298.28856787069 & 409.71143212931 \tabularnewline
53 & 3210 & 3288.50797855588 & -78.5079785558796 \tabularnewline
54 & 3517 & 3415.72129054443 & 101.278709455568 \tabularnewline
55 & 3905 & 4055.61560689415 & -150.615606894152 \tabularnewline
56 & 3670 & 4242.58382502998 & -572.583825029978 \tabularnewline
57 & 4221 & 3805.82354514974 & 415.176454850255 \tabularnewline
58 & 4404 & 4125.23900564378 & 278.760994356218 \tabularnewline
59 & 5086 & 4966.82886783347 & 119.171132166525 \tabularnewline
60 & 5725 & 6070.85593031182 & -345.855930311815 \tabularnewline
\hline
\end{tabular}
%Source: https://freestatistics.org/blog/index.php?pk=147911&T=2

[TABLE]
[ROW][C]Interpolation Forecasts of Exponential Smoothing[/C][/ROW]
[ROW][C]t[/C][C]Observed[/C][C]Fitted[/C][C]Residuals[/C][/ROW]
[ROW][C]13[/C][C]2211[/C][C]2276.26681993523[/C][C]-65.2668199352343[/C][/ROW]
[ROW][C]14[/C][C]3260[/C][C]3323.71049690156[/C][C]-63.7104969015568[/C][/ROW]
[ROW][C]15[/C][C]2992[/C][C]3055.04593064689[/C][C]-63.045930646891[/C][/ROW]
[ROW][C]16[/C][C]2425[/C][C]2473.07038613882[/C][C]-48.0703861388201[/C][/ROW]
[ROW][C]17[/C][C]2707[/C][C]2752.03654662645[/C][C]-45.0365466264516[/C][/ROW]
[ROW][C]18[/C][C]3244[/C][C]3289.65646864753[/C][C]-45.6564686475263[/C][/ROW]
[ROW][C]19[/C][C]3965[/C][C]3272.71927701647[/C][C]692.280722983529[/C][/ROW]
[ROW][C]20[/C][C]3315[/C][C]3374.47086448734[/C][C]-59.470864487339[/C][/ROW]
[ROW][C]21[/C][C]3333[/C][C]3556.92822037387[/C][C]-223.928220373865[/C][/ROW]
[ROW][C]22[/C][C]3583[/C][C]3489.4402414875[/C][C]93.5597585125006[/C][/ROW]
[ROW][C]23[/C][C]4021[/C][C]4217.26237589806[/C][C]-196.262375898061[/C][/ROW]
[ROW][C]24[/C][C]4904[/C][C]4948.64173614133[/C][C]-44.6417361413278[/C][/ROW]
[ROW][C]25[/C][C]2252[/C][C]2189.35117534144[/C][C]62.6488246585627[/C][/ROW]
[ROW][C]26[/C][C]2952[/C][C]3210.91664934567[/C][C]-258.916649345669[/C][/ROW]
[ROW][C]27[/C][C]3573[/C][C]2945.99230997926[/C][C]627.007690020735[/C][/ROW]
[ROW][C]28[/C][C]3048[/C][C]2402.14743560913[/C][C]645.852564390869[/C][/ROW]
[ROW][C]29[/C][C]3059[/C][C]2708.55197095952[/C][C]350.44802904048[/C][/ROW]
[ROW][C]30[/C][C]2731[/C][C]3280.09895575317[/C][C]-549.098955753175[/C][/ROW]
[ROW][C]31[/C][C]3563[/C][C]3508.60084811143[/C][C]54.3991518885664[/C][/ROW]
[ROW][C]32[/C][C]3092[/C][C]3383.12933864106[/C][C]-291.129338641063[/C][/ROW]
[ROW][C]33[/C][C]3478[/C][C]3524.16402651301[/C][C]-46.1640265130113[/C][/ROW]
[ROW][C]34[/C][C]3478[/C][C]3572.81736273739[/C][C]-94.8173627373935[/C][/ROW]
[ROW][C]35[/C][C]4308[/C][C]4231.82498500883[/C][C]76.1750149911659[/C][/ROW]
[ROW][C]36[/C][C]5029[/C][C]5051.29014667762[/C][C]-22.2901466776157[/C][/ROW]
[ROW][C]37[/C][C]2075[/C][C]2271.05705166955[/C][C]-196.057051669549[/C][/ROW]
[ROW][C]38[/C][C]3264[/C][C]3222.16360747408[/C][C]41.8363925259214[/C][/ROW]
[ROW][C]39[/C][C]3308[/C][C]3248.4792521712[/C][C]59.5207478288025[/C][/ROW]
[ROW][C]40[/C][C]3688[/C][C]2686.29719426701[/C][C]1001.70280573299[/C][/ROW]
[ROW][C]41[/C][C]3136[/C][C]2921.83514217467[/C][C]214.164857825328[/C][/ROW]
[ROW][C]42[/C][C]2824[/C][C]3229.51986826372[/C][C]-405.519868263715[/C][/ROW]
[ROW][C]43[/C][C]3644[/C][C]3671.9251322385[/C][C]-27.9251322385007[/C][/ROW]
[ROW][C]44[/C][C]4694[/C][C]3435.84149917003[/C][C]1258.15850082997[/C][/ROW]
[ROW][C]45[/C][C]2914[/C][C]3721.06370512982[/C][C]-807.063705129816[/C][/ROW]
[ROW][C]46[/C][C]3686[/C][C]3766.24011535297[/C][C]-80.2401153529672[/C][/ROW]
[ROW][C]47[/C][C]4358[/C][C]4549.18454023505[/C][C]-191.184540235055[/C][/ROW]
[ROW][C]48[/C][C]5587[/C][C]5413.44581144099[/C][C]173.554188559006[/C][/ROW]
[ROW][C]49[/C][C]2265[/C][C]2386.11096635507[/C][C]-121.110966355073[/C][/ROW]
[ROW][C]50[/C][C]3685[/C][C]3514.38288061765[/C][C]170.61711938235[/C][/ROW]
[ROW][C]51[/C][C]3754[/C][C]3573.31408236988[/C][C]180.685917630124[/C][/ROW]
[ROW][C]52[/C][C]3708[/C][C]3298.28856787069[/C][C]409.71143212931[/C][/ROW]
[ROW][C]53[/C][C]3210[/C][C]3288.50797855588[/C][C]-78.5079785558796[/C][/ROW]
[ROW][C]54[/C][C]3517[/C][C]3415.72129054443[/C][C]101.278709455568[/C][/ROW]
[ROW][C]55[/C][C]3905[/C][C]4055.61560689415[/C][C]-150.615606894152[/C][/ROW]
[ROW][C]56[/C][C]3670[/C][C]4242.58382502998[/C][C]-572.583825029978[/C][/ROW]
[ROW][C]57[/C][C]4221[/C][C]3805.82354514974[/C][C]415.176454850255[/C][/ROW]
[ROW][C]58[/C][C]4404[/C][C]4125.23900564378[/C][C]278.760994356218[/C][/ROW]
[ROW][C]59[/C][C]5086[/C][C]4966.82886783347[/C][C]119.171132166525[/C][/ROW]
[ROW][C]60[/C][C]5725[/C][C]6070.85593031182[/C][C]-345.855930311815[/C][/ROW]
[/TABLE]
Source: https://freestatistics.org/blog/index.php?pk=147911&T=2

Globally Unique Identifier (entire table): ba.freestatistics.org/blog/index.php?pk=147911&T=2

As an alternative you can also use a QR Code:  

The GUIDs for individual cells are displayed in the table below:

Interpolation Forecasts of Exponential Smoothing
tObservedFittedResiduals
1322112276.26681993523-65.2668199352343
1432603323.71049690156-63.7104969015568
1529923055.04593064689-63.045930646891
1624252473.07038613882-48.0703861388201
1727072752.03654662645-45.0365466264516
1832443289.65646864753-45.6564686475263
1939653272.71927701647692.280722983529
2033153374.47086448734-59.470864487339
2133333556.92822037387-223.928220373865
2235833489.440241487593.5597585125006
2340214217.26237589806-196.262375898061
2449044948.64173614133-44.6417361413278
2522522189.3511753414462.6488246585627
2629523210.91664934567-258.916649345669
2735732945.99230997926627.007690020735
2830482402.14743560913645.852564390869
2930592708.55197095952350.44802904048
3027313280.09895575317-549.098955753175
3135633508.6008481114354.3991518885664
3230923383.12933864106-291.129338641063
3334783524.16402651301-46.1640265130113
3434783572.81736273739-94.8173627373935
3543084231.8249850088376.1750149911659
3650295051.29014667762-22.2901466776157
3720752271.05705166955-196.057051669549
3832643222.1636074740841.8363925259214
3933083248.479252171259.5207478288025
4036882686.297194267011001.70280573299
4131362921.83514217467214.164857825328
4228243229.51986826372-405.519868263715
4336443671.9251322385-27.9251322385007
4446943435.841499170031258.15850082997
4529143721.06370512982-807.063705129816
4636863766.24011535297-80.2401153529672
4743584549.18454023505-191.184540235055
4855875413.44581144099173.554188559006
4922652386.11096635507-121.110966355073
5036853514.38288061765170.61711938235
5137543573.31408236988180.685917630124
5237083298.28856787069409.71143212931
5332103288.50797855588-78.5079785558796
5435173415.72129054443101.278709455568
5539054055.61560689415-150.615606894152
5636704242.58382502998-572.583825029978
5742213805.82354514974415.176454850255
5844044125.23900564378278.760994356218
5950864966.82886783347119.171132166525
6057256070.85593031182-345.855930311815


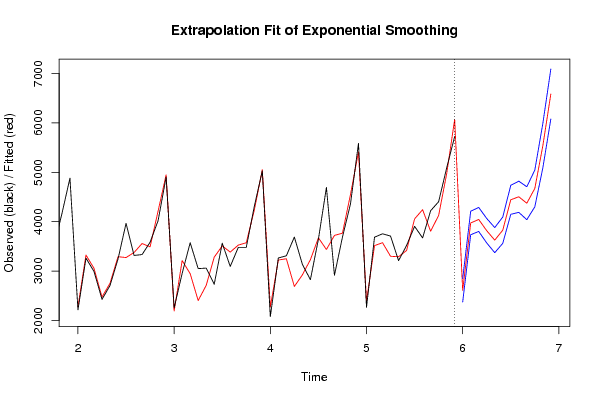
Extrapolation Forecasts of Exponential Smoothing
tForecast95% Lower Bound95% Upper Bound
612608.258324130412372.049759291842844.46688896897
623973.020702163713734.328935675924211.7124686515
634044.766581126663801.816976044994287.71618620832
643816.116597305823568.145357188894064.08783742275
653625.834342761973371.616426967093880.05225855686
663826.702753381013559.76938446594093.63612229613
674442.728454019754148.740701539474736.71620650003
684504.441900537614188.659583740294820.22421733494
694373.456434431924039.822738767014707.09013009683
704672.26665040414300.560732539275043.97256826894
715537.889534378825088.008512228365987.77055652928
726586.98072464296079.97875709627093.9826921896

\begin{tabular}{lllllllll}
\hline
Extrapolation Forecasts of Exponential Smoothing \tabularnewline
t & Forecast & 95% Lower Bound & 95% Upper Bound \tabularnewline
61 & 2608.25832413041 & 2372.04975929184 & 2844.46688896897 \tabularnewline
62 & 3973.02070216371 & 3734.32893567592 & 4211.7124686515 \tabularnewline
63 & 4044.76658112666 & 3801.81697604499 & 4287.71618620832 \tabularnewline
64 & 3816.11659730582 & 3568.14535718889 & 4064.08783742275 \tabularnewline
65 & 3625.83434276197 & 3371.61642696709 & 3880.05225855686 \tabularnewline
66 & 3826.70275338101 & 3559.7693844659 & 4093.63612229613 \tabularnewline
67 & 4442.72845401975 & 4148.74070153947 & 4736.71620650003 \tabularnewline
68 & 4504.44190053761 & 4188.65958374029 & 4820.22421733494 \tabularnewline
69 & 4373.45643443192 & 4039.82273876701 & 4707.09013009683 \tabularnewline
70 & 4672.2666504041 & 4300.56073253927 & 5043.97256826894 \tabularnewline
71 & 5537.88953437882 & 5088.00851222836 & 5987.77055652928 \tabularnewline
72 & 6586.9807246429 & 6079.9787570962 & 7093.9826921896 \tabularnewline
\hline
\end{tabular}
%Source: https://freestatistics.org/blog/index.php?pk=147911&T=3

[TABLE]
[ROW][C]Extrapolation Forecasts of Exponential Smoothing[/C][/ROW]
[ROW][C]t[/C][C]Forecast[/C][C]95% Lower Bound[/C][C]95% Upper Bound[/C][/ROW]
[ROW][C]61[/C][C]2608.25832413041[/C][C]2372.04975929184[/C][C]2844.46688896897[/C][/ROW]
[ROW][C]62[/C][C]3973.02070216371[/C][C]3734.32893567592[/C][C]4211.7124686515[/C][/ROW]
[ROW][C]63[/C][C]4044.76658112666[/C][C]3801.81697604499[/C][C]4287.71618620832[/C][/ROW]
[ROW][C]64[/C][C]3816.11659730582[/C][C]3568.14535718889[/C][C]4064.08783742275[/C][/ROW]
[ROW][C]65[/C][C]3625.83434276197[/C][C]3371.61642696709[/C][C]3880.05225855686[/C][/ROW]
[ROW][C]66[/C][C]3826.70275338101[/C][C]3559.7693844659[/C][C]4093.63612229613[/C][/ROW]
[ROW][C]67[/C][C]4442.72845401975[/C][C]4148.74070153947[/C][C]4736.71620650003[/C][/ROW]
[ROW][C]68[/C][C]4504.44190053761[/C][C]4188.65958374029[/C][C]4820.22421733494[/C][/ROW]
[ROW][C]69[/C][C]4373.45643443192[/C][C]4039.82273876701[/C][C]4707.09013009683[/C][/ROW]
[ROW][C]70[/C][C]4672.2666504041[/C][C]4300.56073253927[/C][C]5043.97256826894[/C][/ROW]
[ROW][C]71[/C][C]5537.88953437882[/C][C]5088.00851222836[/C][C]5987.77055652928[/C][/ROW]
[ROW][C]72[/C][C]6586.9807246429[/C][C]6079.9787570962[/C][C]7093.9826921896[/C][/ROW]
[/TABLE]
Source: https://freestatistics.org/blog/index.php?pk=147911&T=3

Globally Unique Identifier (entire table): ba.freestatistics.org/blog/index.php?pk=147911&T=3

As an alternative you can also use a QR Code:  

The GUIDs for individual cells are displayed in the table below:

Extrapolation Forecasts of Exponential Smoothing
tForecast95% Lower Bound95% Upper Bound
612608.258324130412372.049759291842844.46688896897
623973.020702163713734.328935675924211.7124686515
634044.766581126663801.816976044994287.71618620832
643816.116597305823568.145357188894064.08783742275
653625.834342761973371.616426967093880.05225855686
663826.702753381013559.76938446594093.63612229613
674442.728454019754148.740701539474736.71620650003
684504.441900537614188.659583740294820.22421733494
694373.456434431924039.822738767014707.09013009683
704672.26665040414300.560732539275043.97256826894
715537.889534378825088.008512228365987.77055652928
726586.98072464296079.97875709627093.9826921896


Parameters (Session):
par1 = 12 ; par2 = Triple ; par3 = multiplicative ;
Parameters (R input):
par1 = 12 ; par2 = Triple ; par3 = multiplicative ;
R code (references can be found in the software module):
par1 <- as.numeric(par1)
if (par2 == 'Single') K <- 1
if (par2 == 'Double') K <- 2
if (par2 == 'Triple') K <- par1
nx <- length(x)
nxmK <- nx - K
x <- ts(x, frequency = par1)
if (par2 == 'Single') fit <- HoltWinters(x, gamma=F, beta=F)
if (par2 == 'Double') fit <- HoltWinters(x, gamma=F)
if (par2 == 'Triple') fit <- HoltWinters(x, seasonal=par3)
fit
myresid <- x - fit$fitted[,'xhat']
bitmap(file='test1.png')
op <- par(mfrow=c(2,1))
plot(fit,ylab='Observed (black) / Fitted (red)',main='Interpolation Fit of Exponential Smoothing')
plot(myresid,ylab='Residuals',main='Interpolation Prediction Errors')
par(op)
dev.off()
bitmap(file='test2.png')
p <- predict(fit, par1, prediction.interval=TRUE)
np <- length(p[,1])
plot(fit,p,ylab='Observed (black) / Fitted (red)',main='Extrapolation Fit of Exponential Smoothing')
dev.off()
bitmap(file='test3.png')
op <- par(mfrow = c(2,2))
acf(as.numeric(myresid),lag.max = nx/2,main='Residual ACF')
spectrum(myresid,main='Residals Periodogram')
cpgram(myresid,main='Residal Cumulative Periodogram')
qqnorm(myresid,main='Residual Normal QQ Plot')
qqline(myresid)
par(op)
dev.off()
load(file='createtable')
a<-table.start()
a<-table.row.start(a)
a<-table.element(a,'Estimated Parameters of Exponential Smoothing',2,TRUE)
a<-table.row.end(a)
a<-table.row.start(a)
a<-table.element(a,'Parameter',header=TRUE)
a<-table.element(a,'Value',header=TRUE)
a<-table.row.end(a)
a<-table.row.start(a)
a<-table.element(a,'alpha',header=TRUE)
a<-table.element(a,fit$alpha)
a<-table.row.end(a)
a<-table.row.start(a)
a<-table.element(a,'beta',header=TRUE)
a<-table.element(a,fit$beta)
a<-table.row.end(a)
a<-table.row.start(a)
a<-table.element(a,'gamma',header=TRUE)
a<-table.element(a,fit$gamma)
a<-table.row.end(a)
a<-table.end(a)
table.save(a,file='mytable.tab')
a<-table.start()
a<-table.row.start(a)
a<-table.element(a,'Interpolation Forecasts of Exponential Smoothing',4,TRUE)
a<-table.row.end(a)
a<-table.row.start(a)
a<-table.element(a,'t',header=TRUE)
a<-table.element(a,'Observed',header=TRUE)
a<-table.element(a,'Fitted',header=TRUE)
a<-table.element(a,'Residuals',header=TRUE)
a<-table.row.end(a)
for (i in 1:nxmK) {
a<-table.row.start(a)
a<-table.element(a,i+K,header=TRUE)
a<-table.element(a,x[i+K])
a<-table.element(a,fit$fitted[i,'xhat'])
a<-table.element(a,myresid[i])
a<-table.row.end(a)
}
a<-table.end(a)
table.save(a,file='mytable1.tab')
a<-table.start()
a<-table.row.start(a)
a<-table.element(a,'Extrapolation Forecasts of Exponential Smoothing',4,TRUE)
a<-table.row.end(a)
a<-table.row.start(a)
a<-table.element(a,'t',header=TRUE)
a<-table.element(a,'Forecast',header=TRUE)
a<-table.element(a,'95% Lower Bound',header=TRUE)
a<-table.element(a,'95% Upper Bound',header=TRUE)
a<-table.row.end(a)
for (i in 1:np) {
a<-table.row.start(a)
a<-table.element(a,nx+i,header=TRUE)
a<-table.element(a,p[i,'fit'])
a<-table.element(a,p[i,'lwr'])
a<-table.element(a,p[i,'upr'])
a<-table.row.end(a)
}
a<-table.end(a)
table.save(a,file='mytable2.tab')