Free Statistics

of Irreproducible Research!

Author's title

Author*The author of this computation has been verified*
R Software Modulerwasp_exponentialsmoothing.wasp
Title produced by softwareExponential Smoothing
Date of computationMon, 28 Nov 2011 12:19:23 -0500
Cite this page as followsStatistical Computations at FreeStatistics.org, Office for Research Development and Education, URL https://freestatistics.org/blog/index.php?v=date/2011/Nov/28/t13225007836bemmtwfgzsla8i.htm/, Retrieved Fri, 19 Apr 2024 11:45:45 +0000
Statistical Computations at FreeStatistics.org, Office for Research Development and Education, URL https://freestatistics.org/blog/index.php?pk=147897, Retrieved Fri, 19 Apr 2024 11:45:45 +0000
QR Codes:

Original text written by user:
IsPrivate?No (this computation is public)
User-defined keywords
Estimated Impact124
Family? (F = Feedback message, R = changed R code, M = changed R Module, P = changed Parameters, D = changed Data)
-     [Exponential Smoothing] [HPC Retail Sales] [2008-03-10 17:43:04] [74be16979710d4c4e7c6647856088456]
- RM D    [Exponential Smoothing] [ws 8 triple smoot...] [2011-11-28 17:19:23] [cb05b01fd3da20a46af540a30bcf4c06] [Current]
- R  D      [Exponential Smoothing] [WS 8 smoothing tr...] [2011-11-28 20:36:47] [620e5553455d245695b6e856984b13e0]
Feedback Forum

Post a new message
Dataseries X:
20995
17382
9367
31124
26551
30651
25859
25100
25778
20418
18688
20424
24776
19814
12738
31566
30111
30019
31934
25826
26835
20205
17789
20520
22518
15572
11509
25447
24090
27786
26195
20516
22759
19028
16971
20036
22485
18730
14538
27561
25985
34670
32066
27186
29586
21359
21553
19573
24256
22380
16167
27297
28287
33474
28229
28785
25597
18130
20198
22849
23118


Summary of computational transaction
Raw Inputview raw input (R code)
Raw Outputview raw output of R engine
Computing time2 seconds
R Server'George Udny Yule' @ yule.wessa.net

\begin{tabular}{lllllllll}
\hline
Summary of computational transaction \tabularnewline
Raw Input & view raw input (R code)  \tabularnewline
Raw Output & view raw output of R engine  \tabularnewline
Computing time & 2 seconds \tabularnewline
R Server & 'George Udny Yule' @ yule.wessa.net \tabularnewline
\hline
\end{tabular}
%Source: https://freestatistics.org/blog/index.php?pk=147897&T=0

[TABLE]
[ROW][C]Summary of computational transaction[/C][/ROW]
[ROW][C]Raw Input[/C][C]view raw input (R code) [/C][/ROW]
[ROW][C]Raw Output[/C][C]view raw output of R engine [/C][/ROW]
[ROW][C]Computing time[/C][C]2 seconds[/C][/ROW]
[ROW][C]R Server[/C][C]'George Udny Yule' @ yule.wessa.net[/C][/ROW]
[/TABLE]
Source: https://freestatistics.org/blog/index.php?pk=147897&T=0

Globally Unique Identifier (entire table): ba.freestatistics.org/blog/index.php?pk=147897&T=0

As an alternative you can also use a QR Code:  

The GUIDs for individual cells are displayed in the table below:

Summary of computational transaction
Raw Inputview raw input (R code)
Raw Outputview raw output of R engine
Computing time2 seconds
R Server'George Udny Yule' @ yule.wessa.net


Estimated Parameters of Exponential Smoothing
ParameterValue
alpha0.387954379337132
beta0
gamma1

\begin{tabular}{lllllllll}
\hline
Estimated Parameters of Exponential Smoothing \tabularnewline
Parameter & Value \tabularnewline
alpha & 0.387954379337132 \tabularnewline
beta & 0 \tabularnewline
gamma & 1 \tabularnewline
\hline
\end{tabular}
%Source: https://freestatistics.org/blog/index.php?pk=147897&T=1

[TABLE]
[ROW][C]Estimated Parameters of Exponential Smoothing[/C][/ROW]
[ROW][C]Parameter[/C][C]Value[/C][/ROW]
[ROW][C]alpha[/C][C]0.387954379337132[/C][/ROW]
[ROW][C]beta[/C][C]0[/C][/ROW]
[ROW][C]gamma[/C][C]1[/C][/ROW]
[/TABLE]
Source: https://freestatistics.org/blog/index.php?pk=147897&T=1

Globally Unique Identifier (entire table): ba.freestatistics.org/blog/index.php?pk=147897&T=1

As an alternative you can also use a QR Code:  

The GUIDs for individual cells are displayed in the table below:

Estimated Parameters of Exponential Smoothing
ParameterValue
alpha0.387954379337132
beta0
gamma1


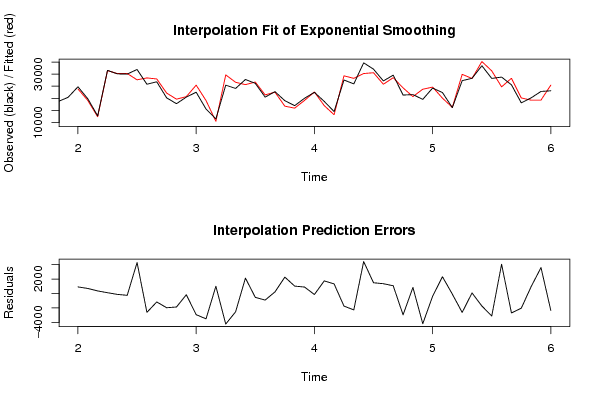
Interpolation Forecasts of Exponential Smoothing
tObservedFittedResiduals
132477623866.7510683761909.248931623933
141981419119.9058073398694.094192660181
151273812384.6736564208353.326343579225
163156631460.3641261135105.635873886524
173011130238.4619933688-127.461993368826
183001930276.2535222083-257.253522208321
193193427650.35852570034283.64147429966
202582628440.1236291977-2614.1236291977
212683528007.9538864877-1172.95388648774
222020522179.808923497-1974.80892349695
231778919662.7057873049-1873.70578730489
242052020695.5760555633-175.576055563266
252251825454.9533499595-2936.95334995955
261557219084.2725542189-3512.27255421889
271150910508.59653305731000.40346694268
282544729683.7255392724-4236.7255392724
292409026634.5187507887-2544.51875078868
302778625655.16418865542130.83581134462
312619526734.9738038502-539.973803850193
322051621431.6493119951-915.649311995105
332275922540.471748493218.528251507003
341902816761.38651089872266.61348910128
351697115951.64150603441019.35849396557
362003619146.2215975454889.778402454613
372248522628.8189394429-143.818939442917
381873016989.62527088921740.37472911075
391453813213.7003626311324.29963736902
402756129309.1244335131-1748.12443351307
412598528261.0890965793-2276.08909657934
423467030247.40327914044422.59672085964
433206630581.65424697091484.34575302909
442718625833.74284283451352.25715716545
452958628516.57793676581069.42206323416
462135924321.1222801958-2962.12228019582
472155320719.4893776133833.510622386682
481957323762.6600459204-4189.66004592039
492425624642.0582705603-386.058270560268
502238020062.09927597092317.9007240291
511616716255.5711688548-88.5711688548108
522729729922.4021256222-2625.40212562221
532828728210.884606245576.1153937544877
543347435209.648140688-1735.648140688
552822931356.4374081816-3127.43740818163
562878524738.52028346254046.47971653752
572559728293.4828376006-2696.48283760064
581813020169.5388226801-2039.53882268012
592019819248.9267084143949.073291585664
602284919262.52081094553586.47918905448
612311825486.6841154839-2368.68411548387

\begin{tabular}{lllllllll}
\hline
Interpolation Forecasts of Exponential Smoothing \tabularnewline
t & Observed & Fitted & Residuals \tabularnewline
13 & 24776 & 23866.7510683761 & 909.248931623933 \tabularnewline
14 & 19814 & 19119.9058073398 & 694.094192660181 \tabularnewline
15 & 12738 & 12384.6736564208 & 353.326343579225 \tabularnewline
16 & 31566 & 31460.3641261135 & 105.635873886524 \tabularnewline
17 & 30111 & 30238.4619933688 & -127.461993368826 \tabularnewline
18 & 30019 & 30276.2535222083 & -257.253522208321 \tabularnewline
19 & 31934 & 27650.3585257003 & 4283.64147429966 \tabularnewline
20 & 25826 & 28440.1236291977 & -2614.1236291977 \tabularnewline
21 & 26835 & 28007.9538864877 & -1172.95388648774 \tabularnewline
22 & 20205 & 22179.808923497 & -1974.80892349695 \tabularnewline
23 & 17789 & 19662.7057873049 & -1873.70578730489 \tabularnewline
24 & 20520 & 20695.5760555633 & -175.576055563266 \tabularnewline
25 & 22518 & 25454.9533499595 & -2936.95334995955 \tabularnewline
26 & 15572 & 19084.2725542189 & -3512.27255421889 \tabularnewline
27 & 11509 & 10508.5965330573 & 1000.40346694268 \tabularnewline
28 & 25447 & 29683.7255392724 & -4236.7255392724 \tabularnewline
29 & 24090 & 26634.5187507887 & -2544.51875078868 \tabularnewline
30 & 27786 & 25655.1641886554 & 2130.83581134462 \tabularnewline
31 & 26195 & 26734.9738038502 & -539.973803850193 \tabularnewline
32 & 20516 & 21431.6493119951 & -915.649311995105 \tabularnewline
33 & 22759 & 22540.471748493 & 218.528251507003 \tabularnewline
34 & 19028 & 16761.3865108987 & 2266.61348910128 \tabularnewline
35 & 16971 & 15951.6415060344 & 1019.35849396557 \tabularnewline
36 & 20036 & 19146.2215975454 & 889.778402454613 \tabularnewline
37 & 22485 & 22628.8189394429 & -143.818939442917 \tabularnewline
38 & 18730 & 16989.6252708892 & 1740.37472911075 \tabularnewline
39 & 14538 & 13213.700362631 & 1324.29963736902 \tabularnewline
40 & 27561 & 29309.1244335131 & -1748.12443351307 \tabularnewline
41 & 25985 & 28261.0890965793 & -2276.08909657934 \tabularnewline
42 & 34670 & 30247.4032791404 & 4422.59672085964 \tabularnewline
43 & 32066 & 30581.6542469709 & 1484.34575302909 \tabularnewline
44 & 27186 & 25833.7428428345 & 1352.25715716545 \tabularnewline
45 & 29586 & 28516.5779367658 & 1069.42206323416 \tabularnewline
46 & 21359 & 24321.1222801958 & -2962.12228019582 \tabularnewline
47 & 21553 & 20719.4893776133 & 833.510622386682 \tabularnewline
48 & 19573 & 23762.6600459204 & -4189.66004592039 \tabularnewline
49 & 24256 & 24642.0582705603 & -386.058270560268 \tabularnewline
50 & 22380 & 20062.0992759709 & 2317.9007240291 \tabularnewline
51 & 16167 & 16255.5711688548 & -88.5711688548108 \tabularnewline
52 & 27297 & 29922.4021256222 & -2625.40212562221 \tabularnewline
53 & 28287 & 28210.8846062455 & 76.1153937544877 \tabularnewline
54 & 33474 & 35209.648140688 & -1735.648140688 \tabularnewline
55 & 28229 & 31356.4374081816 & -3127.43740818163 \tabularnewline
56 & 28785 & 24738.5202834625 & 4046.47971653752 \tabularnewline
57 & 25597 & 28293.4828376006 & -2696.48283760064 \tabularnewline
58 & 18130 & 20169.5388226801 & -2039.53882268012 \tabularnewline
59 & 20198 & 19248.9267084143 & 949.073291585664 \tabularnewline
60 & 22849 & 19262.5208109455 & 3586.47918905448 \tabularnewline
61 & 23118 & 25486.6841154839 & -2368.68411548387 \tabularnewline
\hline
\end{tabular}
%Source: https://freestatistics.org/blog/index.php?pk=147897&T=2

[TABLE]
[ROW][C]Interpolation Forecasts of Exponential Smoothing[/C][/ROW]
[ROW][C]t[/C][C]Observed[/C][C]Fitted[/C][C]Residuals[/C][/ROW]
[ROW][C]13[/C][C]24776[/C][C]23866.7510683761[/C][C]909.248931623933[/C][/ROW]
[ROW][C]14[/C][C]19814[/C][C]19119.9058073398[/C][C]694.094192660181[/C][/ROW]
[ROW][C]15[/C][C]12738[/C][C]12384.6736564208[/C][C]353.326343579225[/C][/ROW]
[ROW][C]16[/C][C]31566[/C][C]31460.3641261135[/C][C]105.635873886524[/C][/ROW]
[ROW][C]17[/C][C]30111[/C][C]30238.4619933688[/C][C]-127.461993368826[/C][/ROW]
[ROW][C]18[/C][C]30019[/C][C]30276.2535222083[/C][C]-257.253522208321[/C][/ROW]
[ROW][C]19[/C][C]31934[/C][C]27650.3585257003[/C][C]4283.64147429966[/C][/ROW]
[ROW][C]20[/C][C]25826[/C][C]28440.1236291977[/C][C]-2614.1236291977[/C][/ROW]
[ROW][C]21[/C][C]26835[/C][C]28007.9538864877[/C][C]-1172.95388648774[/C][/ROW]
[ROW][C]22[/C][C]20205[/C][C]22179.808923497[/C][C]-1974.80892349695[/C][/ROW]
[ROW][C]23[/C][C]17789[/C][C]19662.7057873049[/C][C]-1873.70578730489[/C][/ROW]
[ROW][C]24[/C][C]20520[/C][C]20695.5760555633[/C][C]-175.576055563266[/C][/ROW]
[ROW][C]25[/C][C]22518[/C][C]25454.9533499595[/C][C]-2936.95334995955[/C][/ROW]
[ROW][C]26[/C][C]15572[/C][C]19084.2725542189[/C][C]-3512.27255421889[/C][/ROW]
[ROW][C]27[/C][C]11509[/C][C]10508.5965330573[/C][C]1000.40346694268[/C][/ROW]
[ROW][C]28[/C][C]25447[/C][C]29683.7255392724[/C][C]-4236.7255392724[/C][/ROW]
[ROW][C]29[/C][C]24090[/C][C]26634.5187507887[/C][C]-2544.51875078868[/C][/ROW]
[ROW][C]30[/C][C]27786[/C][C]25655.1641886554[/C][C]2130.83581134462[/C][/ROW]
[ROW][C]31[/C][C]26195[/C][C]26734.9738038502[/C][C]-539.973803850193[/C][/ROW]
[ROW][C]32[/C][C]20516[/C][C]21431.6493119951[/C][C]-915.649311995105[/C][/ROW]
[ROW][C]33[/C][C]22759[/C][C]22540.471748493[/C][C]218.528251507003[/C][/ROW]
[ROW][C]34[/C][C]19028[/C][C]16761.3865108987[/C][C]2266.61348910128[/C][/ROW]
[ROW][C]35[/C][C]16971[/C][C]15951.6415060344[/C][C]1019.35849396557[/C][/ROW]
[ROW][C]36[/C][C]20036[/C][C]19146.2215975454[/C][C]889.778402454613[/C][/ROW]
[ROW][C]37[/C][C]22485[/C][C]22628.8189394429[/C][C]-143.818939442917[/C][/ROW]
[ROW][C]38[/C][C]18730[/C][C]16989.6252708892[/C][C]1740.37472911075[/C][/ROW]
[ROW][C]39[/C][C]14538[/C][C]13213.700362631[/C][C]1324.29963736902[/C][/ROW]
[ROW][C]40[/C][C]27561[/C][C]29309.1244335131[/C][C]-1748.12443351307[/C][/ROW]
[ROW][C]41[/C][C]25985[/C][C]28261.0890965793[/C][C]-2276.08909657934[/C][/ROW]
[ROW][C]42[/C][C]34670[/C][C]30247.4032791404[/C][C]4422.59672085964[/C][/ROW]
[ROW][C]43[/C][C]32066[/C][C]30581.6542469709[/C][C]1484.34575302909[/C][/ROW]
[ROW][C]44[/C][C]27186[/C][C]25833.7428428345[/C][C]1352.25715716545[/C][/ROW]
[ROW][C]45[/C][C]29586[/C][C]28516.5779367658[/C][C]1069.42206323416[/C][/ROW]
[ROW][C]46[/C][C]21359[/C][C]24321.1222801958[/C][C]-2962.12228019582[/C][/ROW]
[ROW][C]47[/C][C]21553[/C][C]20719.4893776133[/C][C]833.510622386682[/C][/ROW]
[ROW][C]48[/C][C]19573[/C][C]23762.6600459204[/C][C]-4189.66004592039[/C][/ROW]
[ROW][C]49[/C][C]24256[/C][C]24642.0582705603[/C][C]-386.058270560268[/C][/ROW]
[ROW][C]50[/C][C]22380[/C][C]20062.0992759709[/C][C]2317.9007240291[/C][/ROW]
[ROW][C]51[/C][C]16167[/C][C]16255.5711688548[/C][C]-88.5711688548108[/C][/ROW]
[ROW][C]52[/C][C]27297[/C][C]29922.4021256222[/C][C]-2625.40212562221[/C][/ROW]
[ROW][C]53[/C][C]28287[/C][C]28210.8846062455[/C][C]76.1153937544877[/C][/ROW]
[ROW][C]54[/C][C]33474[/C][C]35209.648140688[/C][C]-1735.648140688[/C][/ROW]
[ROW][C]55[/C][C]28229[/C][C]31356.4374081816[/C][C]-3127.43740818163[/C][/ROW]
[ROW][C]56[/C][C]28785[/C][C]24738.5202834625[/C][C]4046.47971653752[/C][/ROW]
[ROW][C]57[/C][C]25597[/C][C]28293.4828376006[/C][C]-2696.48283760064[/C][/ROW]
[ROW][C]58[/C][C]18130[/C][C]20169.5388226801[/C][C]-2039.53882268012[/C][/ROW]
[ROW][C]59[/C][C]20198[/C][C]19248.9267084143[/C][C]949.073291585664[/C][/ROW]
[ROW][C]60[/C][C]22849[/C][C]19262.5208109455[/C][C]3586.47918905448[/C][/ROW]
[ROW][C]61[/C][C]23118[/C][C]25486.6841154839[/C][C]-2368.68411548387[/C][/ROW]
[/TABLE]
Source: https://freestatistics.org/blog/index.php?pk=147897&T=2

Globally Unique Identifier (entire table): ba.freestatistics.org/blog/index.php?pk=147897&T=2

As an alternative you can also use a QR Code:  

The GUIDs for individual cells are displayed in the table below:

Interpolation Forecasts of Exponential Smoothing
tObservedFittedResiduals
132477623866.7510683761909.248931623933
141981419119.9058073398694.094192660181
151273812384.6736564208353.326343579225
163156631460.3641261135105.635873886524
173011130238.4619933688-127.461993368826
183001930276.2535222083-257.253522208321
193193427650.35852570034283.64147429966
202582628440.1236291977-2614.1236291977
212683528007.9538864877-1172.95388648774
222020522179.808923497-1974.80892349695
231778919662.7057873049-1873.70578730489
242052020695.5760555633-175.576055563266
252251825454.9533499595-2936.95334995955
261557219084.2725542189-3512.27255421889
271150910508.59653305731000.40346694268
282544729683.7255392724-4236.7255392724
292409026634.5187507887-2544.51875078868
302778625655.16418865542130.83581134462
312619526734.9738038502-539.973803850193
322051621431.6493119951-915.649311995105
332275922540.471748493218.528251507003
341902816761.38651089872266.61348910128
351697115951.64150603441019.35849396557
362003619146.2215975454889.778402454613
372248522628.8189394429-143.818939442917
381873016989.62527088921740.37472911075
391453813213.7003626311324.29963736902
402756129309.1244335131-1748.12443351307
412598528261.0890965793-2276.08909657934
423467030247.40327914044422.59672085964
433206630581.65424697091484.34575302909
442718625833.74284283451352.25715716545
452958628516.57793676581069.42206323416
462135924321.1222801958-2962.12228019582
472155320719.4893776133833.510622386682
481957323762.6600459204-4189.66004592039
492425624642.0582705603-386.058270560268
502238020062.09927597092317.9007240291
511616716255.5711688548-88.5711688548108
522729729922.4021256222-2625.40212562221
532828728210.884606245576.1153937544877
543347435209.648140688-1735.648140688
552822931356.4374081816-3127.43740818163
562878524738.52028346254046.47971653752
572559728293.4828376006-2696.48283760064
581813020169.5388226801-2039.53882268012
592019819248.9267084143949.073291585664
602284919262.52081094553586.47918905448
612311825486.6841154839-2368.68411548387


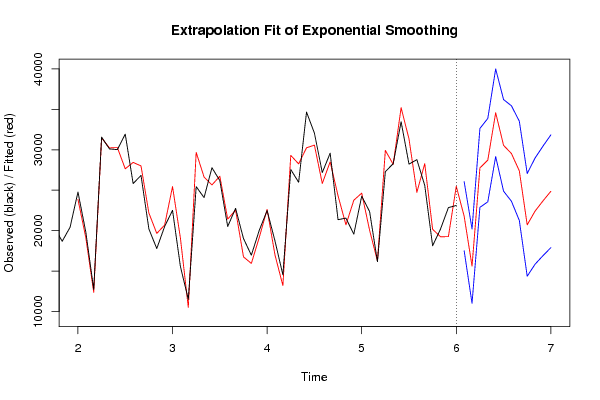
Extrapolation Forecasts of Exponential Smoothing
tForecast95% Lower Bound95% Upper Bound
6221792.503002859817513.718185328126071.2878203916
6315613.864575711024.364505029420203.3646463706
6427762.400827856222881.927256302832642.8743994096
6528722.871527514223567.82219054633877.9208644824
6634583.223824682429167.501799825439998.9458495395
6730551.526863289324887.115469819836215.9382567587
6829537.677336359723635.045057586735440.3096151326
6927395.789662014221264.184716948333527.3946070802
7020720.037680101114367.708139979427072.3672202228
7122419.840540318515854.202569013128985.478511624
7223679.450232523316907.219185505430451.6812795413
7324867.391608391617894.685911308331840.097305475

\begin{tabular}{lllllllll}
\hline
Extrapolation Forecasts of Exponential Smoothing \tabularnewline
t & Forecast & 95% Lower Bound & 95% Upper Bound \tabularnewline
62 & 21792.5030028598 & 17513.7181853281 & 26071.2878203916 \tabularnewline
63 & 15613.8645757 & 11024.3645050294 & 20203.3646463706 \tabularnewline
64 & 27762.4008278562 & 22881.9272563028 & 32642.8743994096 \tabularnewline
65 & 28722.8715275142 & 23567.822190546 & 33877.9208644824 \tabularnewline
66 & 34583.2238246824 & 29167.5017998254 & 39998.9458495395 \tabularnewline
67 & 30551.5268632893 & 24887.1154698198 & 36215.9382567587 \tabularnewline
68 & 29537.6773363597 & 23635.0450575867 & 35440.3096151326 \tabularnewline
69 & 27395.7896620142 & 21264.1847169483 & 33527.3946070802 \tabularnewline
70 & 20720.0376801011 & 14367.7081399794 & 27072.3672202228 \tabularnewline
71 & 22419.8405403185 & 15854.2025690131 & 28985.478511624 \tabularnewline
72 & 23679.4502325233 & 16907.2191855054 & 30451.6812795413 \tabularnewline
73 & 24867.3916083916 & 17894.6859113083 & 31840.097305475 \tabularnewline
\hline
\end{tabular}
%Source: https://freestatistics.org/blog/index.php?pk=147897&T=3

[TABLE]
[ROW][C]Extrapolation Forecasts of Exponential Smoothing[/C][/ROW]
[ROW][C]t[/C][C]Forecast[/C][C]95% Lower Bound[/C][C]95% Upper Bound[/C][/ROW]
[ROW][C]62[/C][C]21792.5030028598[/C][C]17513.7181853281[/C][C]26071.2878203916[/C][/ROW]
[ROW][C]63[/C][C]15613.8645757[/C][C]11024.3645050294[/C][C]20203.3646463706[/C][/ROW]
[ROW][C]64[/C][C]27762.4008278562[/C][C]22881.9272563028[/C][C]32642.8743994096[/C][/ROW]
[ROW][C]65[/C][C]28722.8715275142[/C][C]23567.822190546[/C][C]33877.9208644824[/C][/ROW]
[ROW][C]66[/C][C]34583.2238246824[/C][C]29167.5017998254[/C][C]39998.9458495395[/C][/ROW]
[ROW][C]67[/C][C]30551.5268632893[/C][C]24887.1154698198[/C][C]36215.9382567587[/C][/ROW]
[ROW][C]68[/C][C]29537.6773363597[/C][C]23635.0450575867[/C][C]35440.3096151326[/C][/ROW]
[ROW][C]69[/C][C]27395.7896620142[/C][C]21264.1847169483[/C][C]33527.3946070802[/C][/ROW]
[ROW][C]70[/C][C]20720.0376801011[/C][C]14367.7081399794[/C][C]27072.3672202228[/C][/ROW]
[ROW][C]71[/C][C]22419.8405403185[/C][C]15854.2025690131[/C][C]28985.478511624[/C][/ROW]
[ROW][C]72[/C][C]23679.4502325233[/C][C]16907.2191855054[/C][C]30451.6812795413[/C][/ROW]
[ROW][C]73[/C][C]24867.3916083916[/C][C]17894.6859113083[/C][C]31840.097305475[/C][/ROW]
[/TABLE]
Source: https://freestatistics.org/blog/index.php?pk=147897&T=3

Globally Unique Identifier (entire table): ba.freestatistics.org/blog/index.php?pk=147897&T=3

As an alternative you can also use a QR Code:  

The GUIDs for individual cells are displayed in the table below:

Extrapolation Forecasts of Exponential Smoothing
tForecast95% Lower Bound95% Upper Bound
6221792.503002859817513.718185328126071.2878203916
6315613.864575711024.364505029420203.3646463706
6427762.400827856222881.927256302832642.8743994096
6528722.871527514223567.82219054633877.9208644824
6634583.223824682429167.501799825439998.9458495395
6730551.526863289324887.115469819836215.9382567587
6829537.677336359723635.045057586735440.3096151326
6927395.789662014221264.184716948333527.3946070802
7020720.037680101114367.708139979427072.3672202228
7122419.840540318515854.202569013128985.478511624
7223679.450232523316907.219185505430451.6812795413
7324867.391608391617894.685911308331840.097305475


Parameters (Session):
par1 = 12 ; par2 = Single ; par3 = additive ;
Parameters (R input):
par1 = 12 ; par2 = Triple ; par3 = additive ;
R code (references can be found in the software module):
par1 <- as.numeric(par1)
if (par2 == 'Single') K <- 1
if (par2 == 'Double') K <- 2
if (par2 == 'Triple') K <- par1
nx <- length(x)
nxmK <- nx - K
x <- ts(x, frequency = par1)
if (par2 == 'Single') fit <- HoltWinters(x, gamma=F, beta=F)
if (par2 == 'Double') fit <- HoltWinters(x, gamma=F)
if (par2 == 'Triple') fit <- HoltWinters(x, seasonal=par3)
fit
myresid <- x - fit$fitted[,'xhat']
bitmap(file='test1.png')
op <- par(mfrow=c(2,1))
plot(fit,ylab='Observed (black) / Fitted (red)',main='Interpolation Fit of Exponential Smoothing')
plot(myresid,ylab='Residuals',main='Interpolation Prediction Errors')
par(op)
dev.off()
bitmap(file='test2.png')
p <- predict(fit, par1, prediction.interval=TRUE)
np <- length(p[,1])
plot(fit,p,ylab='Observed (black) / Fitted (red)',main='Extrapolation Fit of Exponential Smoothing')
dev.off()
bitmap(file='test3.png')
op <- par(mfrow = c(2,2))
acf(as.numeric(myresid),lag.max = nx/2,main='Residual ACF')
spectrum(myresid,main='Residals Periodogram')
cpgram(myresid,main='Residal Cumulative Periodogram')
qqnorm(myresid,main='Residual Normal QQ Plot')
qqline(myresid)
par(op)
dev.off()
load(file='createtable')
a<-table.start()
a<-table.row.start(a)
a<-table.element(a,'Estimated Parameters of Exponential Smoothing',2,TRUE)
a<-table.row.end(a)
a<-table.row.start(a)
a<-table.element(a,'Parameter',header=TRUE)
a<-table.element(a,'Value',header=TRUE)
a<-table.row.end(a)
a<-table.row.start(a)
a<-table.element(a,'alpha',header=TRUE)
a<-table.element(a,fit$alpha)
a<-table.row.end(a)
a<-table.row.start(a)
a<-table.element(a,'beta',header=TRUE)
a<-table.element(a,fit$beta)
a<-table.row.end(a)
a<-table.row.start(a)
a<-table.element(a,'gamma',header=TRUE)
a<-table.element(a,fit$gamma)
a<-table.row.end(a)
a<-table.end(a)
table.save(a,file='mytable.tab')
a<-table.start()
a<-table.row.start(a)
a<-table.element(a,'Interpolation Forecasts of Exponential Smoothing',4,TRUE)
a<-table.row.end(a)
a<-table.row.start(a)
a<-table.element(a,'t',header=TRUE)
a<-table.element(a,'Observed',header=TRUE)
a<-table.element(a,'Fitted',header=TRUE)
a<-table.element(a,'Residuals',header=TRUE)
a<-table.row.end(a)
for (i in 1:nxmK) {
a<-table.row.start(a)
a<-table.element(a,i+K,header=TRUE)
a<-table.element(a,x[i+K])
a<-table.element(a,fit$fitted[i,'xhat'])
a<-table.element(a,myresid[i])
a<-table.row.end(a)
}
a<-table.end(a)
table.save(a,file='mytable1.tab')
a<-table.start()
a<-table.row.start(a)
a<-table.element(a,'Extrapolation Forecasts of Exponential Smoothing',4,TRUE)
a<-table.row.end(a)
a<-table.row.start(a)
a<-table.element(a,'t',header=TRUE)
a<-table.element(a,'Forecast',header=TRUE)
a<-table.element(a,'95% Lower Bound',header=TRUE)
a<-table.element(a,'95% Upper Bound',header=TRUE)
a<-table.row.end(a)
for (i in 1:np) {
a<-table.row.start(a)
a<-table.element(a,nx+i,header=TRUE)
a<-table.element(a,p[i,'fit'])
a<-table.element(a,p[i,'lwr'])
a<-table.element(a,p[i,'upr'])
a<-table.row.end(a)
}
a<-table.end(a)
table.save(a,file='mytable2.tab')