Free Statistics

of Irreproducible Research!

Author's title

Author*The author of this computation has been verified*
R Software Modulerwasp_exponentialsmoothing.wasp
Title produced by softwareExponential Smoothing
Date of computationMon, 28 Nov 2011 12:18:20 -0500
Cite this page as followsStatistical Computations at FreeStatistics.org, Office for Research Development and Education, URL https://freestatistics.org/blog/index.php?v=date/2011/Nov/28/t132250073166q7bxicrhg920k.htm/, Retrieved Fri, 19 Apr 2024 00:30:59 +0000
Statistical Computations at FreeStatistics.org, Office for Research Development and Education, URL https://freestatistics.org/blog/index.php?pk=147895, Retrieved Fri, 19 Apr 2024 00:30:59 +0000
QR Codes:

Original text written by user:
IsPrivate?No (this computation is public)
User-defined keywords
Estimated Impact108
Family? (F = Feedback message, R = changed R code, M = changed R Module, P = changed Parameters, D = changed Data)
-     [Exponential Smoothing] [HPC Retail Sales] [2008-03-10 17:43:04] [74be16979710d4c4e7c6647856088456]
- RM D    [Exponential Smoothing] [ws 8 double smoot...] [2011-11-28 17:18:20] [cb05b01fd3da20a46af540a30bcf4c06] [Current]
- R  D      [Exponential Smoothing] [ws 8 smoothing do...] [2011-11-28 20:35:48] [620e5553455d245695b6e856984b13e0]
Feedback Forum

Post a new message
Dataseries X:
20995
17382
9367
31124
26551
30651
25859
25100
25778
20418
18688
20424
24776
19814
12738
31566
30111
30019
31934
25826
26835
20205
17789
20520
22518
15572
11509
25447
24090
27786
26195
20516
22759
19028
16971
20036
22485
18730
14538
27561
25985
34670
32066
27186
29586
21359
21553
19573
24256
22380
16167
27297
28287
33474
28229
28785
25597
18130
20198
22849
23118


Summary of computational transaction
Raw Inputview raw input (R code)
Raw Outputview raw output of R engine
Computing time1 seconds
R Server'Gertrude Mary Cox' @ cox.wessa.net

\begin{tabular}{lllllllll}
\hline
Summary of computational transaction \tabularnewline
Raw Input & view raw input (R code)  \tabularnewline
Raw Output & view raw output of R engine  \tabularnewline
Computing time & 1 seconds \tabularnewline
R Server & 'Gertrude Mary Cox' @ cox.wessa.net \tabularnewline
\hline
\end{tabular}
%Source: https://freestatistics.org/blog/index.php?pk=147895&T=0

[TABLE]
[ROW][C]Summary of computational transaction[/C][/ROW]
[ROW][C]Raw Input[/C][C]view raw input (R code) [/C][/ROW]
[ROW][C]Raw Output[/C][C]view raw output of R engine [/C][/ROW]
[ROW][C]Computing time[/C][C]1 seconds[/C][/ROW]
[ROW][C]R Server[/C][C]'Gertrude Mary Cox' @ cox.wessa.net[/C][/ROW]
[/TABLE]
Source: https://freestatistics.org/blog/index.php?pk=147895&T=0

Globally Unique Identifier (entire table): ba.freestatistics.org/blog/index.php?pk=147895&T=0

As an alternative you can also use a QR Code:  

The GUIDs for individual cells are displayed in the table below:

Summary of computational transaction
Raw Inputview raw input (R code)
Raw Outputview raw output of R engine
Computing time1 seconds
R Server'Gertrude Mary Cox' @ cox.wessa.net


Estimated Parameters of Exponential Smoothing
ParameterValue
alpha0.733486306258628
beta0.0808324569416258
gammaFALSE

\begin{tabular}{lllllllll}
\hline
Estimated Parameters of Exponential Smoothing \tabularnewline
Parameter & Value \tabularnewline
alpha & 0.733486306258628 \tabularnewline
beta & 0.0808324569416258 \tabularnewline
gamma & FALSE \tabularnewline
\hline
\end{tabular}
%Source: https://freestatistics.org/blog/index.php?pk=147895&T=1

[TABLE]
[ROW][C]Estimated Parameters of Exponential Smoothing[/C][/ROW]
[ROW][C]Parameter[/C][C]Value[/C][/ROW]
[ROW][C]alpha[/C][C]0.733486306258628[/C][/ROW]
[ROW][C]beta[/C][C]0.0808324569416258[/C][/ROW]
[ROW][C]gamma[/C][C]FALSE[/C][/ROW]
[/TABLE]
Source: https://freestatistics.org/blog/index.php?pk=147895&T=1

Globally Unique Identifier (entire table): ba.freestatistics.org/blog/index.php?pk=147895&T=1

As an alternative you can also use a QR Code:  

The GUIDs for individual cells are displayed in the table below:

Estimated Parameters of Exponential Smoothing
ParameterValue
alpha0.733486306258628
beta0.0808324569416258
gammaFALSE


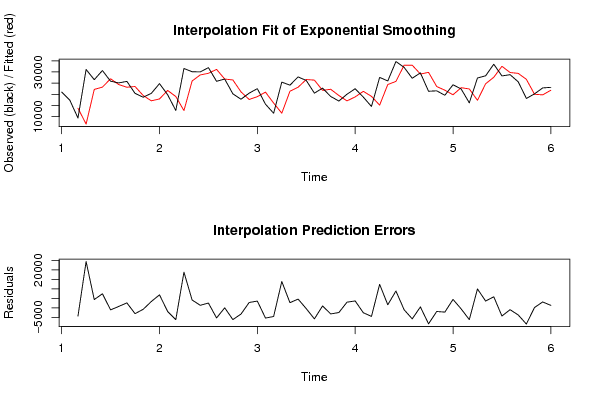
Interpolation Forecasts of Exponential Smoothing
tObservedFittedResiduals
3936713769-4402
4311246666.2008996701224457.7991003299
52655122181.75992711914369.2400728809
63065123221.68605593787429.31394406221
72585926946.6147764848-1087.61477648476
82510024360.0087725479739.991227452079
92577823157.80045581312620.19954418691
102041823490.0495138939-3072.04951389392
111868819464.9715555818-776.9715555818
122042417077.23559623483346.7644037652
132477617912.63148270886863.36851729118
141981421734.3340205317-1920.3340205317
151273818999.4553841875-6261.45538418752
163156612709.185113116618856.8148868834
173011125960.83325406754150.16674593251
183001928671.41768506191347.58231493813
193193429406.24229581082527.75770418919
202582631156.5788846386-5330.57888463863
212683526826.88583738118.11416261886916
222020526413.5321182519-6208.53211825192
231778921072.2527145619-3283.25271456185
242052017681.96328275922838.03671724082
252251818949.82160453673568.17839546334
261557220964.7843628529-5392.78436285286
271150916087.2681571244-4578.26815712437
282544711535.74520339513911.254796605
292409021370.82549047122719.17450952882
302778623157.88664624114628.11335375892
312619526619.5268316666-424.526831666597
322051626349.9546469306-5833.9546469306
332275921766.7489794017992.251020598309
341902822249.3017598619-3221.30175986189
351697119450.2819036022-2479.28190360217
362003617048.52806579312987.47193420693
372248518833.68902574733651.31097425268
381873021322.2512341212-2592.25123412123
391453819077.552780139-4539.55278013904
402756115135.387492222212425.6125077778
412598524373.64698251561611.35301748439
423467025775.33153951328894.66846048676
433206633046.5886861862-980.588686186216
442718633016.3413318196-5830.34133181955
452958629083.1887991843502.811200815715
462135929825.1283495096-8466.12834950962
472155323486.5210389634-1933.52103896338
481957321824.8542387102-2251.85423871016
492425619796.18308312594459.81691687414
502238022954.8511285616-574.851128561557
511616722386.5764699714-6219.57646997141
522729717309.21749008339987.78250991666
532828724711.90501635863575.09498364136
543347427622.93965078595851.06034921405
552822932550.2701585221-4321.27015852209
562878529760.1295878754-975.129587875435
572559729366.5223586529-3769.52235865293
581813026699.7732008637-8569.77320086373
592019820004.0082132178193.991786782179
602284919747.84651137343101.15348862661
612311821807.91394850621310.08605149382

\begin{tabular}{lllllllll}
\hline
Interpolation Forecasts of Exponential Smoothing \tabularnewline
t & Observed & Fitted & Residuals \tabularnewline
3 & 9367 & 13769 & -4402 \tabularnewline
4 & 31124 & 6666.20089967012 & 24457.7991003299 \tabularnewline
5 & 26551 & 22181.7599271191 & 4369.2400728809 \tabularnewline
6 & 30651 & 23221.6860559378 & 7429.31394406221 \tabularnewline
7 & 25859 & 26946.6147764848 & -1087.61477648476 \tabularnewline
8 & 25100 & 24360.0087725479 & 739.991227452079 \tabularnewline
9 & 25778 & 23157.8004558131 & 2620.19954418691 \tabularnewline
10 & 20418 & 23490.0495138939 & -3072.04951389392 \tabularnewline
11 & 18688 & 19464.9715555818 & -776.9715555818 \tabularnewline
12 & 20424 & 17077.2355962348 & 3346.7644037652 \tabularnewline
13 & 24776 & 17912.6314827088 & 6863.36851729118 \tabularnewline
14 & 19814 & 21734.3340205317 & -1920.3340205317 \tabularnewline
15 & 12738 & 18999.4553841875 & -6261.45538418752 \tabularnewline
16 & 31566 & 12709.1851131166 & 18856.8148868834 \tabularnewline
17 & 30111 & 25960.8332540675 & 4150.16674593251 \tabularnewline
18 & 30019 & 28671.4176850619 & 1347.58231493813 \tabularnewline
19 & 31934 & 29406.2422958108 & 2527.75770418919 \tabularnewline
20 & 25826 & 31156.5788846386 & -5330.57888463863 \tabularnewline
21 & 26835 & 26826.8858373811 & 8.11416261886916 \tabularnewline
22 & 20205 & 26413.5321182519 & -6208.53211825192 \tabularnewline
23 & 17789 & 21072.2527145619 & -3283.25271456185 \tabularnewline
24 & 20520 & 17681.9632827592 & 2838.03671724082 \tabularnewline
25 & 22518 & 18949.8216045367 & 3568.17839546334 \tabularnewline
26 & 15572 & 20964.7843628529 & -5392.78436285286 \tabularnewline
27 & 11509 & 16087.2681571244 & -4578.26815712437 \tabularnewline
28 & 25447 & 11535.745203395 & 13911.254796605 \tabularnewline
29 & 24090 & 21370.8254904712 & 2719.17450952882 \tabularnewline
30 & 27786 & 23157.8866462411 & 4628.11335375892 \tabularnewline
31 & 26195 & 26619.5268316666 & -424.526831666597 \tabularnewline
32 & 20516 & 26349.9546469306 & -5833.9546469306 \tabularnewline
33 & 22759 & 21766.7489794017 & 992.251020598309 \tabularnewline
34 & 19028 & 22249.3017598619 & -3221.30175986189 \tabularnewline
35 & 16971 & 19450.2819036022 & -2479.28190360217 \tabularnewline
36 & 20036 & 17048.5280657931 & 2987.47193420693 \tabularnewline
37 & 22485 & 18833.6890257473 & 3651.31097425268 \tabularnewline
38 & 18730 & 21322.2512341212 & -2592.25123412123 \tabularnewline
39 & 14538 & 19077.552780139 & -4539.55278013904 \tabularnewline
40 & 27561 & 15135.3874922222 & 12425.6125077778 \tabularnewline
41 & 25985 & 24373.6469825156 & 1611.35301748439 \tabularnewline
42 & 34670 & 25775.3315395132 & 8894.66846048676 \tabularnewline
43 & 32066 & 33046.5886861862 & -980.588686186216 \tabularnewline
44 & 27186 & 33016.3413318196 & -5830.34133181955 \tabularnewline
45 & 29586 & 29083.1887991843 & 502.811200815715 \tabularnewline
46 & 21359 & 29825.1283495096 & -8466.12834950962 \tabularnewline
47 & 21553 & 23486.5210389634 & -1933.52103896338 \tabularnewline
48 & 19573 & 21824.8542387102 & -2251.85423871016 \tabularnewline
49 & 24256 & 19796.1830831259 & 4459.81691687414 \tabularnewline
50 & 22380 & 22954.8511285616 & -574.851128561557 \tabularnewline
51 & 16167 & 22386.5764699714 & -6219.57646997141 \tabularnewline
52 & 27297 & 17309.2174900833 & 9987.78250991666 \tabularnewline
53 & 28287 & 24711.9050163586 & 3575.09498364136 \tabularnewline
54 & 33474 & 27622.9396507859 & 5851.06034921405 \tabularnewline
55 & 28229 & 32550.2701585221 & -4321.27015852209 \tabularnewline
56 & 28785 & 29760.1295878754 & -975.129587875435 \tabularnewline
57 & 25597 & 29366.5223586529 & -3769.52235865293 \tabularnewline
58 & 18130 & 26699.7732008637 & -8569.77320086373 \tabularnewline
59 & 20198 & 20004.0082132178 & 193.991786782179 \tabularnewline
60 & 22849 & 19747.8465113734 & 3101.15348862661 \tabularnewline
61 & 23118 & 21807.9139485062 & 1310.08605149382 \tabularnewline
\hline
\end{tabular}
%Source: https://freestatistics.org/blog/index.php?pk=147895&T=2

[TABLE]
[ROW][C]Interpolation Forecasts of Exponential Smoothing[/C][/ROW]
[ROW][C]t[/C][C]Observed[/C][C]Fitted[/C][C]Residuals[/C][/ROW]
[ROW][C]3[/C][C]9367[/C][C]13769[/C][C]-4402[/C][/ROW]
[ROW][C]4[/C][C]31124[/C][C]6666.20089967012[/C][C]24457.7991003299[/C][/ROW]
[ROW][C]5[/C][C]26551[/C][C]22181.7599271191[/C][C]4369.2400728809[/C][/ROW]
[ROW][C]6[/C][C]30651[/C][C]23221.6860559378[/C][C]7429.31394406221[/C][/ROW]
[ROW][C]7[/C][C]25859[/C][C]26946.6147764848[/C][C]-1087.61477648476[/C][/ROW]
[ROW][C]8[/C][C]25100[/C][C]24360.0087725479[/C][C]739.991227452079[/C][/ROW]
[ROW][C]9[/C][C]25778[/C][C]23157.8004558131[/C][C]2620.19954418691[/C][/ROW]
[ROW][C]10[/C][C]20418[/C][C]23490.0495138939[/C][C]-3072.04951389392[/C][/ROW]
[ROW][C]11[/C][C]18688[/C][C]19464.9715555818[/C][C]-776.9715555818[/C][/ROW]
[ROW][C]12[/C][C]20424[/C][C]17077.2355962348[/C][C]3346.7644037652[/C][/ROW]
[ROW][C]13[/C][C]24776[/C][C]17912.6314827088[/C][C]6863.36851729118[/C][/ROW]
[ROW][C]14[/C][C]19814[/C][C]21734.3340205317[/C][C]-1920.3340205317[/C][/ROW]
[ROW][C]15[/C][C]12738[/C][C]18999.4553841875[/C][C]-6261.45538418752[/C][/ROW]
[ROW][C]16[/C][C]31566[/C][C]12709.1851131166[/C][C]18856.8148868834[/C][/ROW]
[ROW][C]17[/C][C]30111[/C][C]25960.8332540675[/C][C]4150.16674593251[/C][/ROW]
[ROW][C]18[/C][C]30019[/C][C]28671.4176850619[/C][C]1347.58231493813[/C][/ROW]
[ROW][C]19[/C][C]31934[/C][C]29406.2422958108[/C][C]2527.75770418919[/C][/ROW]
[ROW][C]20[/C][C]25826[/C][C]31156.5788846386[/C][C]-5330.57888463863[/C][/ROW]
[ROW][C]21[/C][C]26835[/C][C]26826.8858373811[/C][C]8.11416261886916[/C][/ROW]
[ROW][C]22[/C][C]20205[/C][C]26413.5321182519[/C][C]-6208.53211825192[/C][/ROW]
[ROW][C]23[/C][C]17789[/C][C]21072.2527145619[/C][C]-3283.25271456185[/C][/ROW]
[ROW][C]24[/C][C]20520[/C][C]17681.9632827592[/C][C]2838.03671724082[/C][/ROW]
[ROW][C]25[/C][C]22518[/C][C]18949.8216045367[/C][C]3568.17839546334[/C][/ROW]
[ROW][C]26[/C][C]15572[/C][C]20964.7843628529[/C][C]-5392.78436285286[/C][/ROW]
[ROW][C]27[/C][C]11509[/C][C]16087.2681571244[/C][C]-4578.26815712437[/C][/ROW]
[ROW][C]28[/C][C]25447[/C][C]11535.745203395[/C][C]13911.254796605[/C][/ROW]
[ROW][C]29[/C][C]24090[/C][C]21370.8254904712[/C][C]2719.17450952882[/C][/ROW]
[ROW][C]30[/C][C]27786[/C][C]23157.8866462411[/C][C]4628.11335375892[/C][/ROW]
[ROW][C]31[/C][C]26195[/C][C]26619.5268316666[/C][C]-424.526831666597[/C][/ROW]
[ROW][C]32[/C][C]20516[/C][C]26349.9546469306[/C][C]-5833.9546469306[/C][/ROW]
[ROW][C]33[/C][C]22759[/C][C]21766.7489794017[/C][C]992.251020598309[/C][/ROW]
[ROW][C]34[/C][C]19028[/C][C]22249.3017598619[/C][C]-3221.30175986189[/C][/ROW]
[ROW][C]35[/C][C]16971[/C][C]19450.2819036022[/C][C]-2479.28190360217[/C][/ROW]
[ROW][C]36[/C][C]20036[/C][C]17048.5280657931[/C][C]2987.47193420693[/C][/ROW]
[ROW][C]37[/C][C]22485[/C][C]18833.6890257473[/C][C]3651.31097425268[/C][/ROW]
[ROW][C]38[/C][C]18730[/C][C]21322.2512341212[/C][C]-2592.25123412123[/C][/ROW]
[ROW][C]39[/C][C]14538[/C][C]19077.552780139[/C][C]-4539.55278013904[/C][/ROW]
[ROW][C]40[/C][C]27561[/C][C]15135.3874922222[/C][C]12425.6125077778[/C][/ROW]
[ROW][C]41[/C][C]25985[/C][C]24373.6469825156[/C][C]1611.35301748439[/C][/ROW]
[ROW][C]42[/C][C]34670[/C][C]25775.3315395132[/C][C]8894.66846048676[/C][/ROW]
[ROW][C]43[/C][C]32066[/C][C]33046.5886861862[/C][C]-980.588686186216[/C][/ROW]
[ROW][C]44[/C][C]27186[/C][C]33016.3413318196[/C][C]-5830.34133181955[/C][/ROW]
[ROW][C]45[/C][C]29586[/C][C]29083.1887991843[/C][C]502.811200815715[/C][/ROW]
[ROW][C]46[/C][C]21359[/C][C]29825.1283495096[/C][C]-8466.12834950962[/C][/ROW]
[ROW][C]47[/C][C]21553[/C][C]23486.5210389634[/C][C]-1933.52103896338[/C][/ROW]
[ROW][C]48[/C][C]19573[/C][C]21824.8542387102[/C][C]-2251.85423871016[/C][/ROW]
[ROW][C]49[/C][C]24256[/C][C]19796.1830831259[/C][C]4459.81691687414[/C][/ROW]
[ROW][C]50[/C][C]22380[/C][C]22954.8511285616[/C][C]-574.851128561557[/C][/ROW]
[ROW][C]51[/C][C]16167[/C][C]22386.5764699714[/C][C]-6219.57646997141[/C][/ROW]
[ROW][C]52[/C][C]27297[/C][C]17309.2174900833[/C][C]9987.78250991666[/C][/ROW]
[ROW][C]53[/C][C]28287[/C][C]24711.9050163586[/C][C]3575.09498364136[/C][/ROW]
[ROW][C]54[/C][C]33474[/C][C]27622.9396507859[/C][C]5851.06034921405[/C][/ROW]
[ROW][C]55[/C][C]28229[/C][C]32550.2701585221[/C][C]-4321.27015852209[/C][/ROW]
[ROW][C]56[/C][C]28785[/C][C]29760.1295878754[/C][C]-975.129587875435[/C][/ROW]
[ROW][C]57[/C][C]25597[/C][C]29366.5223586529[/C][C]-3769.52235865293[/C][/ROW]
[ROW][C]58[/C][C]18130[/C][C]26699.7732008637[/C][C]-8569.77320086373[/C][/ROW]
[ROW][C]59[/C][C]20198[/C][C]20004.0082132178[/C][C]193.991786782179[/C][/ROW]
[ROW][C]60[/C][C]22849[/C][C]19747.8465113734[/C][C]3101.15348862661[/C][/ROW]
[ROW][C]61[/C][C]23118[/C][C]21807.9139485062[/C][C]1310.08605149382[/C][/ROW]
[/TABLE]
Source: https://freestatistics.org/blog/index.php?pk=147895&T=2

Globally Unique Identifier (entire table): ba.freestatistics.org/blog/index.php?pk=147895&T=2

As an alternative you can also use a QR Code:  

The GUIDs for individual cells are displayed in the table below:

Interpolation Forecasts of Exponential Smoothing
tObservedFittedResiduals
3936713769-4402
4311246666.2008996701224457.7991003299
52655122181.75992711914369.2400728809
63065123221.68605593787429.31394406221
72585926946.6147764848-1087.61477648476
82510024360.0087725479739.991227452079
92577823157.80045581312620.19954418691
102041823490.0495138939-3072.04951389392
111868819464.9715555818-776.9715555818
122042417077.23559623483346.7644037652
132477617912.63148270886863.36851729118
141981421734.3340205317-1920.3340205317
151273818999.4553841875-6261.45538418752
163156612709.185113116618856.8148868834
173011125960.83325406754150.16674593251
183001928671.41768506191347.58231493813
193193429406.24229581082527.75770418919
202582631156.5788846386-5330.57888463863
212683526826.88583738118.11416261886916
222020526413.5321182519-6208.53211825192
231778921072.2527145619-3283.25271456185
242052017681.96328275922838.03671724082
252251818949.82160453673568.17839546334
261557220964.7843628529-5392.78436285286
271150916087.2681571244-4578.26815712437
282544711535.74520339513911.254796605
292409021370.82549047122719.17450952882
302778623157.88664624114628.11335375892
312619526619.5268316666-424.526831666597
322051626349.9546469306-5833.9546469306
332275921766.7489794017992.251020598309
341902822249.3017598619-3221.30175986189
351697119450.2819036022-2479.28190360217
362003617048.52806579312987.47193420693
372248518833.68902574733651.31097425268
381873021322.2512341212-2592.25123412123
391453819077.552780139-4539.55278013904
402756115135.387492222212425.6125077778
412598524373.64698251561611.35301748439
423467025775.33153951328894.66846048676
433206633046.5886861862-980.588686186216
442718633016.3413318196-5830.34133181955
452958629083.1887991843502.811200815715
462135929825.1283495096-8466.12834950962
472155323486.5210389634-1933.52103896338
481957321824.8542387102-2251.85423871016
492425619796.18308312594459.81691687414
502238022954.8511285616-574.851128561557
511616722386.5764699714-6219.57646997141
522729717309.21749008339987.78250991666
532828724711.90501635863575.09498364136
543347427622.93965078595851.06034921405
552822932550.2701585221-4321.27015852209
562878529760.1295878754-975.129587875435
572559729366.5223586529-3769.52235865293
581813026699.7732008637-8569.77320086373
592019820004.0082132178193.991786782179
602284919747.84651137343101.15348862661
612311821807.91394850621310.08605149382


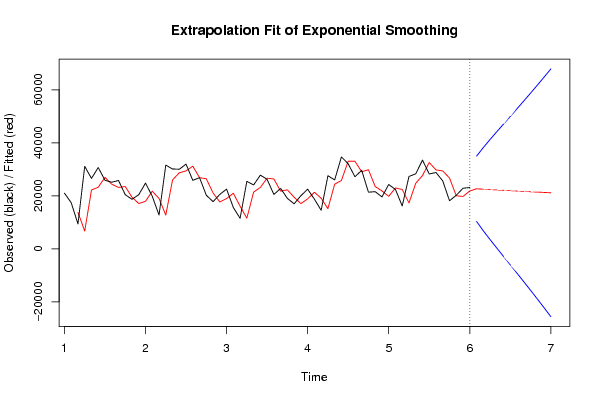
Extrapolation Forecasts of Exponential Smoothing
tForecast95% Lower Bound95% Upper Bound
6222631.932294217410335.903783102334927.9608053325
6322495.02046113746803.758478429338186.2824438455
6422358.10862805753490.5800103103341225.6372458046
6522221.1967949775276.74251224958144165.6510777054
6622084.2849618976-2895.80654137147064.3764651661
6721947.3731288176-6059.4882698166949954.2345274519
6821810.4612957376-9234.0224568497352854.945048325
6921673.5494626577-12432.095022159255779.1939474746
7021536.6376295777-15662.183376046958735.4586352023
7121399.7257964978-18930.099679717661729.5512727131
7221262.8139634178-22239.893514981764765.5214418173
7321125.9021303379-25594.408712614967846.2129732906

\begin{tabular}{lllllllll}
\hline
Extrapolation Forecasts of Exponential Smoothing \tabularnewline
t & Forecast & 95% Lower Bound & 95% Upper Bound \tabularnewline
62 & 22631.9322942174 & 10335.9037831023 & 34927.9608053325 \tabularnewline
63 & 22495.0204611374 & 6803.7584784293 & 38186.2824438455 \tabularnewline
64 & 22358.1086280575 & 3490.58001031033 & 41225.6372458046 \tabularnewline
65 & 22221.1967949775 & 276.742512249581 & 44165.6510777054 \tabularnewline
66 & 22084.2849618976 & -2895.806541371 & 47064.3764651661 \tabularnewline
67 & 21947.3731288176 & -6059.48826981669 & 49954.2345274519 \tabularnewline
68 & 21810.4612957376 & -9234.02245684973 & 52854.945048325 \tabularnewline
69 & 21673.5494626577 & -12432.0950221592 & 55779.1939474746 \tabularnewline
70 & 21536.6376295777 & -15662.1833760469 & 58735.4586352023 \tabularnewline
71 & 21399.7257964978 & -18930.0996797176 & 61729.5512727131 \tabularnewline
72 & 21262.8139634178 & -22239.8935149817 & 64765.5214418173 \tabularnewline
73 & 21125.9021303379 & -25594.4087126149 & 67846.2129732906 \tabularnewline
\hline
\end{tabular}
%Source: https://freestatistics.org/blog/index.php?pk=147895&T=3

[TABLE]
[ROW][C]Extrapolation Forecasts of Exponential Smoothing[/C][/ROW]
[ROW][C]t[/C][C]Forecast[/C][C]95% Lower Bound[/C][C]95% Upper Bound[/C][/ROW]
[ROW][C]62[/C][C]22631.9322942174[/C][C]10335.9037831023[/C][C]34927.9608053325[/C][/ROW]
[ROW][C]63[/C][C]22495.0204611374[/C][C]6803.7584784293[/C][C]38186.2824438455[/C][/ROW]
[ROW][C]64[/C][C]22358.1086280575[/C][C]3490.58001031033[/C][C]41225.6372458046[/C][/ROW]
[ROW][C]65[/C][C]22221.1967949775[/C][C]276.742512249581[/C][C]44165.6510777054[/C][/ROW]
[ROW][C]66[/C][C]22084.2849618976[/C][C]-2895.806541371[/C][C]47064.3764651661[/C][/ROW]
[ROW][C]67[/C][C]21947.3731288176[/C][C]-6059.48826981669[/C][C]49954.2345274519[/C][/ROW]
[ROW][C]68[/C][C]21810.4612957376[/C][C]-9234.02245684973[/C][C]52854.945048325[/C][/ROW]
[ROW][C]69[/C][C]21673.5494626577[/C][C]-12432.0950221592[/C][C]55779.1939474746[/C][/ROW]
[ROW][C]70[/C][C]21536.6376295777[/C][C]-15662.1833760469[/C][C]58735.4586352023[/C][/ROW]
[ROW][C]71[/C][C]21399.7257964978[/C][C]-18930.0996797176[/C][C]61729.5512727131[/C][/ROW]
[ROW][C]72[/C][C]21262.8139634178[/C][C]-22239.8935149817[/C][C]64765.5214418173[/C][/ROW]
[ROW][C]73[/C][C]21125.9021303379[/C][C]-25594.4087126149[/C][C]67846.2129732906[/C][/ROW]
[/TABLE]
Source: https://freestatistics.org/blog/index.php?pk=147895&T=3

Globally Unique Identifier (entire table): ba.freestatistics.org/blog/index.php?pk=147895&T=3

As an alternative you can also use a QR Code:  

The GUIDs for individual cells are displayed in the table below:

Extrapolation Forecasts of Exponential Smoothing
tForecast95% Lower Bound95% Upper Bound
6222631.932294217410335.903783102334927.9608053325
6322495.02046113746803.758478429338186.2824438455
6422358.10862805753490.5800103103341225.6372458046
6522221.1967949775276.74251224958144165.6510777054
6622084.2849618976-2895.80654137147064.3764651661
6721947.3731288176-6059.4882698166949954.2345274519
6821810.4612957376-9234.0224568497352854.945048325
6921673.5494626577-12432.095022159255779.1939474746
7021536.6376295777-15662.183376046958735.4586352023
7121399.7257964978-18930.099679717661729.5512727131
7221262.8139634178-22239.893514981764765.5214418173
7321125.9021303379-25594.408712614967846.2129732906


Parameters (Session):
par1 = 12 ; par2 = Single ; par3 = additive ;
Parameters (R input):
par1 = 12 ; par2 = Double ; par3 = additive ;
R code (references can be found in the software module):
par1 <- as.numeric(par1)
if (par2 == 'Single') K <- 1
if (par2 == 'Double') K <- 2
if (par2 == 'Triple') K <- par1
nx <- length(x)
nxmK <- nx - K
x <- ts(x, frequency = par1)
if (par2 == 'Single') fit <- HoltWinters(x, gamma=F, beta=F)
if (par2 == 'Double') fit <- HoltWinters(x, gamma=F)
if (par2 == 'Triple') fit <- HoltWinters(x, seasonal=par3)
fit
myresid <- x - fit$fitted[,'xhat']
bitmap(file='test1.png')
op <- par(mfrow=c(2,1))
plot(fit,ylab='Observed (black) / Fitted (red)',main='Interpolation Fit of Exponential Smoothing')
plot(myresid,ylab='Residuals',main='Interpolation Prediction Errors')
par(op)
dev.off()
bitmap(file='test2.png')
p <- predict(fit, par1, prediction.interval=TRUE)
np <- length(p[,1])
plot(fit,p,ylab='Observed (black) / Fitted (red)',main='Extrapolation Fit of Exponential Smoothing')
dev.off()
bitmap(file='test3.png')
op <- par(mfrow = c(2,2))
acf(as.numeric(myresid),lag.max = nx/2,main='Residual ACF')
spectrum(myresid,main='Residals Periodogram')
cpgram(myresid,main='Residal Cumulative Periodogram')
qqnorm(myresid,main='Residual Normal QQ Plot')
qqline(myresid)
par(op)
dev.off()
load(file='createtable')
a<-table.start()
a<-table.row.start(a)
a<-table.element(a,'Estimated Parameters of Exponential Smoothing',2,TRUE)
a<-table.row.end(a)
a<-table.row.start(a)
a<-table.element(a,'Parameter',header=TRUE)
a<-table.element(a,'Value',header=TRUE)
a<-table.row.end(a)
a<-table.row.start(a)
a<-table.element(a,'alpha',header=TRUE)
a<-table.element(a,fit$alpha)
a<-table.row.end(a)
a<-table.row.start(a)
a<-table.element(a,'beta',header=TRUE)
a<-table.element(a,fit$beta)
a<-table.row.end(a)
a<-table.row.start(a)
a<-table.element(a,'gamma',header=TRUE)
a<-table.element(a,fit$gamma)
a<-table.row.end(a)
a<-table.end(a)
table.save(a,file='mytable.tab')
a<-table.start()
a<-table.row.start(a)
a<-table.element(a,'Interpolation Forecasts of Exponential Smoothing',4,TRUE)
a<-table.row.end(a)
a<-table.row.start(a)
a<-table.element(a,'t',header=TRUE)
a<-table.element(a,'Observed',header=TRUE)
a<-table.element(a,'Fitted',header=TRUE)
a<-table.element(a,'Residuals',header=TRUE)
a<-table.row.end(a)
for (i in 1:nxmK) {
a<-table.row.start(a)
a<-table.element(a,i+K,header=TRUE)
a<-table.element(a,x[i+K])
a<-table.element(a,fit$fitted[i,'xhat'])
a<-table.element(a,myresid[i])
a<-table.row.end(a)
}
a<-table.end(a)
table.save(a,file='mytable1.tab')
a<-table.start()
a<-table.row.start(a)
a<-table.element(a,'Extrapolation Forecasts of Exponential Smoothing',4,TRUE)
a<-table.row.end(a)
a<-table.row.start(a)
a<-table.element(a,'t',header=TRUE)
a<-table.element(a,'Forecast',header=TRUE)
a<-table.element(a,'95% Lower Bound',header=TRUE)
a<-table.element(a,'95% Upper Bound',header=TRUE)
a<-table.row.end(a)
for (i in 1:np) {
a<-table.row.start(a)
a<-table.element(a,nx+i,header=TRUE)
a<-table.element(a,p[i,'fit'])
a<-table.element(a,p[i,'lwr'])
a<-table.element(a,p[i,'upr'])
a<-table.row.end(a)
}
a<-table.end(a)
table.save(a,file='mytable2.tab')