Free Statistics

of Irreproducible Research!

Author's title

Author*The author of this computation has been verified*
R Software Modulerwasp_multipleregression.wasp
Title produced by softwareMultiple Regression
Date of computationMon, 28 Nov 2011 12:09:23 -0500
Cite this page as followsStatistical Computations at FreeStatistics.org, Office for Research Development and Education, URL https://freestatistics.org/blog/index.php?v=date/2011/Nov/28/t1322500207yqtz7km75480jh4.htm/, Retrieved Wed, 24 Apr 2024 09:55:59 +0000
Statistical Computations at FreeStatistics.org, Office for Research Development and Education, URL https://freestatistics.org/blog/index.php?pk=147886, Retrieved Wed, 24 Apr 2024 09:55:59 +0000
QR Codes:

Original text written by user:
IsPrivate?No (this computation is public)
User-defined keywords
Estimated Impact102
Family? (F = Feedback message, R = changed R code, M = changed R Module, P = changed Parameters, D = changed Data)
-     [Multiple Regression] [HPC Retail Sales] [2008-03-08 13:40:54] [1c0f2c85e8a48e42648374b3bcceca26]
- RMPD    [Multiple Regression] [ws8 multiple regr...] [2011-11-28 17:09:23] [cb05b01fd3da20a46af540a30bcf4c06] [Current]
-   PD      [Multiple Regression] [ws8 multiple regr...] [2011-11-28 20:33:16] [620e5553455d245695b6e856984b13e0]
Feedback Forum

Post a new message
Dataseries X:
20995
17382
9367
31124
26551
30651
25859
25100
25778
20418
18688
20424
24776
19814
12738
31566
30111
30019
31934
25826
26835
20205
17789
20520
22518
15572
11509
25447
24090
27786
26195
20516
22759
19028
16971
20036
22485
18730
14538
27561
25985
34670
32066
27186
29586
21359
21553
19573
24256
22380
16167
27297
28287
33474
28229
28785
25597
18130
20198
22849
23118


Summary of computational transaction
Raw Inputview raw input (R code)
Raw Outputview raw output of R engine
Computing time4 seconds
R Server'Herman Ole Andreas Wold' @ wold.wessa.net

\begin{tabular}{lllllllll}
\hline
Summary of computational transaction \tabularnewline
Raw Input & view raw input (R code)  \tabularnewline
Raw Output & view raw output of R engine  \tabularnewline
Computing time & 4 seconds \tabularnewline
R Server & 'Herman Ole Andreas Wold' @ wold.wessa.net \tabularnewline
\hline
\end{tabular}
%Source: https://freestatistics.org/blog/index.php?pk=147886&T=0

[TABLE]
[ROW][C]Summary of computational transaction[/C][/ROW]
[ROW][C]Raw Input[/C][C]view raw input (R code) [/C][/ROW]
[ROW][C]Raw Output[/C][C]view raw output of R engine [/C][/ROW]
[ROW][C]Computing time[/C][C]4 seconds[/C][/ROW]
[ROW][C]R Server[/C][C]'Herman Ole Andreas Wold' @ wold.wessa.net[/C][/ROW]
[/TABLE]
Source: https://freestatistics.org/blog/index.php?pk=147886&T=0

Globally Unique Identifier (entire table): ba.freestatistics.org/blog/index.php?pk=147886&T=0

As an alternative you can also use a QR Code:  

The GUIDs for individual cells are displayed in the table below:

Summary of computational transaction
Raw Inputview raw input (R code)
Raw Outputview raw output of R engine
Computing time4 seconds
R Server'Herman Ole Andreas Wold' @ wold.wessa.net


Multiple Linear Regression - Estimated Regression Equation
Inschrijvingen[t] = + 19502.4470588235 + 2507.87124183007M1[t] -1577.5908496732M2[t] -7522.11176470588M3[t] + 8180.36732026143M4[t] + 6553.44640522876M5[t] + 10835.9254901961M6[t] + 8339.8045751634M7[t] + 4933.08366013072M8[t] + 5528.76274509804M9[t] -786.958169934641M10[t] -1607.87908496732M11[t] + 32.7209150326797t + e[t]

\begin{tabular}{lllllllll}
\hline
Multiple Linear Regression - Estimated Regression Equation \tabularnewline
Inschrijvingen[t] =  +  19502.4470588235 +  2507.87124183007M1[t] -1577.5908496732M2[t] -7522.11176470588M3[t] +  8180.36732026143M4[t] +  6553.44640522876M5[t] +  10835.9254901961M6[t] +  8339.8045751634M7[t] +  4933.08366013072M8[t] +  5528.76274509804M9[t] -786.958169934641M10[t] -1607.87908496732M11[t] +  32.7209150326797t  + e[t] \tabularnewline
\hline
\end{tabular}
%Source: https://freestatistics.org/blog/index.php?pk=147886&T=1

[TABLE]
[ROW][C]Multiple Linear Regression - Estimated Regression Equation[/C][/ROW]
[ROW][C]Inschrijvingen[t] =  +  19502.4470588235 +  2507.87124183007M1[t] -1577.5908496732M2[t] -7522.11176470588M3[t] +  8180.36732026143M4[t] +  6553.44640522876M5[t] +  10835.9254901961M6[t] +  8339.8045751634M7[t] +  4933.08366013072M8[t] +  5528.76274509804M9[t] -786.958169934641M10[t] -1607.87908496732M11[t] +  32.7209150326797t  + e[t][/C][/ROW]
[/TABLE]
Source: https://freestatistics.org/blog/index.php?pk=147886&T=1

Globally Unique Identifier (entire table): ba.freestatistics.org/blog/index.php?pk=147886&T=1

As an alternative you can also use a QR Code:  

The GUIDs for individual cells are displayed in the table below:

Multiple Linear Regression - Estimated Regression Equation
Inschrijvingen[t] = + 19502.4470588235 + 2507.87124183007M1[t] -1577.5908496732M2[t] -7522.11176470588M3[t] + 8180.36732026143M4[t] + 6553.44640522876M5[t] + 10835.9254901961M6[t] + 8339.8045751634M7[t] + 4933.08366013072M8[t] + 5528.76274509804M9[t] -786.958169934641M10[t] -1607.87908496732M11[t] + 32.7209150326797t + e[t]


Multiple Linear Regression - Ordinary Least Squares
VariableParameterS.D.T-STATH0: parameter = 02-tail p-value1-tail p-value
(Intercept)19502.44705882351184.02589116.471300
M12507.871241830071380.8527371.81620.0755910.037796
M2-1577.59084967321449.351045-1.08850.2818180.140909
M3-7522.111764705881447.500208-5.19664e-062e-06
M48180.367320261431445.8421875.65791e-060
M56553.446405228761444.3776474.53723.8e-051.9e-05
M610835.92549019611443.1071777.508700
M78339.80457516341442.031295.78341e-060
M84933.083660130721441.1504213.4230.0012760.000638
M95528.762745098041440.4649283.83820.0003620.000181
M10-786.9581699346411439.975091-0.54650.5872480.293624
M11-1607.879084967321439.681108-1.11680.2696260.134813
t32.720915032679716.7984961.94780.0572940.028647

\begin{tabular}{lllllllll}
\hline
Multiple Linear Regression - Ordinary Least Squares \tabularnewline
Variable & Parameter & S.D. & T-STATH0: parameter = 0 & 2-tail p-value & 1-tail p-value \tabularnewline
(Intercept) & 19502.4470588235 & 1184.025891 & 16.4713 & 0 & 0 \tabularnewline
M1 & 2507.87124183007 & 1380.852737 & 1.8162 & 0.075591 & 0.037796 \tabularnewline
M2 & -1577.5908496732 & 1449.351045 & -1.0885 & 0.281818 & 0.140909 \tabularnewline
M3 & -7522.11176470588 & 1447.500208 & -5.1966 & 4e-06 & 2e-06 \tabularnewline
M4 & 8180.36732026143 & 1445.842187 & 5.6579 & 1e-06 & 0 \tabularnewline
M5 & 6553.44640522876 & 1444.377647 & 4.5372 & 3.8e-05 & 1.9e-05 \tabularnewline
M6 & 10835.9254901961 & 1443.107177 & 7.5087 & 0 & 0 \tabularnewline
M7 & 8339.8045751634 & 1442.03129 & 5.7834 & 1e-06 & 0 \tabularnewline
M8 & 4933.08366013072 & 1441.150421 & 3.423 & 0.001276 & 0.000638 \tabularnewline
M9 & 5528.76274509804 & 1440.464928 & 3.8382 & 0.000362 & 0.000181 \tabularnewline
M10 & -786.958169934641 & 1439.975091 & -0.5465 & 0.587248 & 0.293624 \tabularnewline
M11 & -1607.87908496732 & 1439.681108 & -1.1168 & 0.269626 & 0.134813 \tabularnewline
t & 32.7209150326797 & 16.798496 & 1.9478 & 0.057294 & 0.028647 \tabularnewline
\hline
\end{tabular}
%Source: https://freestatistics.org/blog/index.php?pk=147886&T=2

[TABLE]
[ROW][C]Multiple Linear Regression - Ordinary Least Squares[/C][/ROW]
[ROW][C]Variable[/C][C]Parameter[/C][C]S.D.[/C][C]T-STATH0: parameter = 0[/C][C]2-tail p-value[/C][C]1-tail p-value[/C][/ROW]
[ROW][C](Intercept)[/C][C]19502.4470588235[/C][C]1184.025891[/C][C]16.4713[/C][C]0[/C][C]0[/C][/ROW]
[ROW][C]M1[/C][C]2507.87124183007[/C][C]1380.852737[/C][C]1.8162[/C][C]0.075591[/C][C]0.037796[/C][/ROW]
[ROW][C]M2[/C][C]-1577.5908496732[/C][C]1449.351045[/C][C]-1.0885[/C][C]0.281818[/C][C]0.140909[/C][/ROW]
[ROW][C]M3[/C][C]-7522.11176470588[/C][C]1447.500208[/C][C]-5.1966[/C][C]4e-06[/C][C]2e-06[/C][/ROW]
[ROW][C]M4[/C][C]8180.36732026143[/C][C]1445.842187[/C][C]5.6579[/C][C]1e-06[/C][C]0[/C][/ROW]
[ROW][C]M5[/C][C]6553.44640522876[/C][C]1444.377647[/C][C]4.5372[/C][C]3.8e-05[/C][C]1.9e-05[/C][/ROW]
[ROW][C]M6[/C][C]10835.9254901961[/C][C]1443.107177[/C][C]7.5087[/C][C]0[/C][C]0[/C][/ROW]
[ROW][C]M7[/C][C]8339.8045751634[/C][C]1442.03129[/C][C]5.7834[/C][C]1e-06[/C][C]0[/C][/ROW]
[ROW][C]M8[/C][C]4933.08366013072[/C][C]1441.150421[/C][C]3.423[/C][C]0.001276[/C][C]0.000638[/C][/ROW]
[ROW][C]M9[/C][C]5528.76274509804[/C][C]1440.464928[/C][C]3.8382[/C][C]0.000362[/C][C]0.000181[/C][/ROW]
[ROW][C]M10[/C][C]-786.958169934641[/C][C]1439.975091[/C][C]-0.5465[/C][C]0.587248[/C][C]0.293624[/C][/ROW]
[ROW][C]M11[/C][C]-1607.87908496732[/C][C]1439.681108[/C][C]-1.1168[/C][C]0.269626[/C][C]0.134813[/C][/ROW]
[ROW][C]t[/C][C]32.7209150326797[/C][C]16.798496[/C][C]1.9478[/C][C]0.057294[/C][C]0.028647[/C][/ROW]
[/TABLE]
Source: https://freestatistics.org/blog/index.php?pk=147886&T=2

Globally Unique Identifier (entire table): ba.freestatistics.org/blog/index.php?pk=147886&T=2

As an alternative you can also use a QR Code:  

The GUIDs for individual cells are displayed in the table below:

Multiple Linear Regression - Ordinary Least Squares
VariableParameterS.D.T-STATH0: parameter = 02-tail p-value1-tail p-value
(Intercept)19502.44705882351184.02589116.471300
M12507.871241830071380.8527371.81620.0755910.037796
M2-1577.59084967321449.351045-1.08850.2818180.140909
M3-7522.111764705881447.500208-5.19664e-062e-06
M48180.367320261431445.8421875.65791e-060
M56553.446405228761444.3776474.53723.8e-051.9e-05
M610835.92549019611443.1071777.508700
M78339.80457516341442.031295.78341e-060
M84933.083660130721441.1504213.4230.0012760.000638
M95528.762745098041440.4649283.83820.0003620.000181
M10-786.9581699346411439.975091-0.54650.5872480.293624
M11-1607.879084967321439.681108-1.11680.2696260.134813
t32.720915032679716.7984961.94780.0572940.028647


Multiple Linear Regression - Regression Statistics
Multiple R0.930278630238748
R-squared0.865418329878881
Adjusted R-squared0.831772912348601
F-TEST (value)25.721729537166
F-TEST (DF numerator)12
F-TEST (DF denominator)48
p-value1.11022302462516e-16
Multiple Linear Regression - Residual Statistics
Residual Standard Deviation2276.18073984856
Sum Squared Residuals248687940.501961

\begin{tabular}{lllllllll}
\hline
Multiple Linear Regression - Regression Statistics \tabularnewline
Multiple R & 0.930278630238748 \tabularnewline
R-squared & 0.865418329878881 \tabularnewline
Adjusted R-squared & 0.831772912348601 \tabularnewline
F-TEST (value) & 25.721729537166 \tabularnewline
F-TEST (DF numerator) & 12 \tabularnewline
F-TEST (DF denominator) & 48 \tabularnewline
p-value & 1.11022302462516e-16 \tabularnewline
Multiple Linear Regression - Residual Statistics \tabularnewline
Residual Standard Deviation & 2276.18073984856 \tabularnewline
Sum Squared Residuals & 248687940.501961 \tabularnewline
\hline
\end{tabular}
%Source: https://freestatistics.org/blog/index.php?pk=147886&T=3

[TABLE]
[ROW][C]Multiple Linear Regression - Regression Statistics[/C][/ROW]
[ROW][C]Multiple R[/C][C]0.930278630238748[/C][/ROW]
[ROW][C]R-squared[/C][C]0.865418329878881[/C][/ROW]
[ROW][C]Adjusted R-squared[/C][C]0.831772912348601[/C][/ROW]
[ROW][C]F-TEST (value)[/C][C]25.721729537166[/C][/ROW]
[ROW][C]F-TEST (DF numerator)[/C][C]12[/C][/ROW]
[ROW][C]F-TEST (DF denominator)[/C][C]48[/C][/ROW]
[ROW][C]p-value[/C][C]1.11022302462516e-16[/C][/ROW]
[ROW][C]Multiple Linear Regression - Residual Statistics[/C][/ROW]
[ROW][C]Residual Standard Deviation[/C][C]2276.18073984856[/C][/ROW]
[ROW][C]Sum Squared Residuals[/C][C]248687940.501961[/C][/ROW]
[/TABLE]
Source: https://freestatistics.org/blog/index.php?pk=147886&T=3

Globally Unique Identifier (entire table): ba.freestatistics.org/blog/index.php?pk=147886&T=3

As an alternative you can also use a QR Code:  

The GUIDs for individual cells are displayed in the table below:

Multiple Linear Regression - Regression Statistics
Multiple R0.930278630238748
R-squared0.865418329878881
Adjusted R-squared0.831772912348601
F-TEST (value)25.721729537166
F-TEST (DF numerator)12
F-TEST (DF denominator)48
p-value1.11022302462516e-16
Multiple Linear Regression - Residual Statistics
Residual Standard Deviation2276.18073984856
Sum Squared Residuals248687940.501961


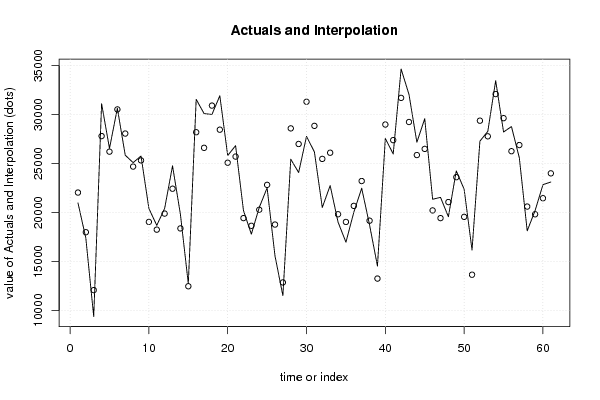
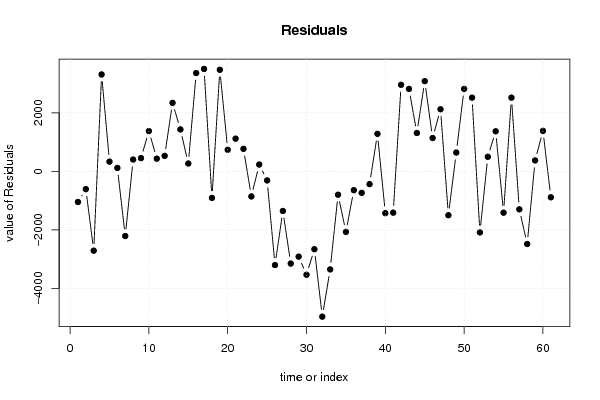
Multiple Linear Regression - Actuals, Interpolation, and Residuals
Time or IndexActualsInterpolationForecastResidualsPrediction Error
12099522043.0392156863-1048.03921568627
21738217990.2980392157-608.298039215688
3936712078.4980392157-2711.49803921569
43112427813.69803921573310.30196078431
52655126219.4980392157331.501960784314
63065130534.6980392157116.301960784313
72585928071.2980392157-2212.29803921569
82510024697.2980392157402.701960784312
92577825325.6980392157452.301960784313
102041819042.69803921571375.30196078431
111868818254.4980392157433.501960784313
122042419895.0980392157528.901960784312
132477622435.69019607842340.30980392157
141981418382.94901960781431.05098039216
151273812471.1490196078266.850980392157
163156628206.34901960783359.65098039216
173011126612.14901960783498.85098039216
183001930927.3490196078-908.349019607844
193193428463.94901960783470.05098039216
202582625089.9490196078736.050980392156
212683525718.34901960781116.65098039216
222020519435.3490196078769.650980392157
231778918647.1490196078-858.149019607844
242052020287.7490196078232.250980392156
252251822828.3411764706-310.34117647059
261557218775.6-3203.6
271150912863.8-1354.8
282544728599-3152
292409027004.8-2914.8
302778631320-3534
312619528856.6-2661.6
322051625482.6-4966.6
332275926111-3352
341902819828-800.000000000001
351697119039.8-2068.8
362003620680.4-644.400000000001
372248523220.9921568627-735.992156862747
381873019168.2509803922-438.250980392156
391453813256.45098039221281.54901960784
402756128991.6509803922-1430.65098039216
412598527397.4509803922-1412.45098039216
423467031712.65098039222957.34901960784
433206629249.25098039222816.74901960784
442718625875.25098039221310.74901960784
452958626503.65098039223082.34901960784
462135920220.65098039221138.34901960784
472155319432.45098039222120.54901960784
481957321073.0509803922-1500.05098039216
492425623613.6431372549642.356862745097
502238019560.90196078432819.09803921569
511616713649.10196078432517.89803921569
522729729384.3019607843-2087.30196078431
532828727790.1019607843496.898039215686
543347432105.30196078431368.69803921569
552822929641.9019607843-1412.90196078431
562878526267.90196078432517.09803921569
572559726896.3019607843-1299.30196078431
581813020613.3019607843-2483.30196078431
592019819825.1019607843372.898039215688
602284921465.70196078431383.29803921569
612311824006.2941176471-888.294117647059

\begin{tabular}{lllllllll}
\hline
Multiple Linear Regression - Actuals, Interpolation, and Residuals \tabularnewline
Time or Index & Actuals & InterpolationForecast & ResidualsPrediction Error \tabularnewline
1 & 20995 & 22043.0392156863 & -1048.03921568627 \tabularnewline
2 & 17382 & 17990.2980392157 & -608.298039215688 \tabularnewline
3 & 9367 & 12078.4980392157 & -2711.49803921569 \tabularnewline
4 & 31124 & 27813.6980392157 & 3310.30196078431 \tabularnewline
5 & 26551 & 26219.4980392157 & 331.501960784314 \tabularnewline
6 & 30651 & 30534.6980392157 & 116.301960784313 \tabularnewline
7 & 25859 & 28071.2980392157 & -2212.29803921569 \tabularnewline
8 & 25100 & 24697.2980392157 & 402.701960784312 \tabularnewline
9 & 25778 & 25325.6980392157 & 452.301960784313 \tabularnewline
10 & 20418 & 19042.6980392157 & 1375.30196078431 \tabularnewline
11 & 18688 & 18254.4980392157 & 433.501960784313 \tabularnewline
12 & 20424 & 19895.0980392157 & 528.901960784312 \tabularnewline
13 & 24776 & 22435.6901960784 & 2340.30980392157 \tabularnewline
14 & 19814 & 18382.9490196078 & 1431.05098039216 \tabularnewline
15 & 12738 & 12471.1490196078 & 266.850980392157 \tabularnewline
16 & 31566 & 28206.3490196078 & 3359.65098039216 \tabularnewline
17 & 30111 & 26612.1490196078 & 3498.85098039216 \tabularnewline
18 & 30019 & 30927.3490196078 & -908.349019607844 \tabularnewline
19 & 31934 & 28463.9490196078 & 3470.05098039216 \tabularnewline
20 & 25826 & 25089.9490196078 & 736.050980392156 \tabularnewline
21 & 26835 & 25718.3490196078 & 1116.65098039216 \tabularnewline
22 & 20205 & 19435.3490196078 & 769.650980392157 \tabularnewline
23 & 17789 & 18647.1490196078 & -858.149019607844 \tabularnewline
24 & 20520 & 20287.7490196078 & 232.250980392156 \tabularnewline
25 & 22518 & 22828.3411764706 & -310.34117647059 \tabularnewline
26 & 15572 & 18775.6 & -3203.6 \tabularnewline
27 & 11509 & 12863.8 & -1354.8 \tabularnewline
28 & 25447 & 28599 & -3152 \tabularnewline
29 & 24090 & 27004.8 & -2914.8 \tabularnewline
30 & 27786 & 31320 & -3534 \tabularnewline
31 & 26195 & 28856.6 & -2661.6 \tabularnewline
32 & 20516 & 25482.6 & -4966.6 \tabularnewline
33 & 22759 & 26111 & -3352 \tabularnewline
34 & 19028 & 19828 & -800.000000000001 \tabularnewline
35 & 16971 & 19039.8 & -2068.8 \tabularnewline
36 & 20036 & 20680.4 & -644.400000000001 \tabularnewline
37 & 22485 & 23220.9921568627 & -735.992156862747 \tabularnewline
38 & 18730 & 19168.2509803922 & -438.250980392156 \tabularnewline
39 & 14538 & 13256.4509803922 & 1281.54901960784 \tabularnewline
40 & 27561 & 28991.6509803922 & -1430.65098039216 \tabularnewline
41 & 25985 & 27397.4509803922 & -1412.45098039216 \tabularnewline
42 & 34670 & 31712.6509803922 & 2957.34901960784 \tabularnewline
43 & 32066 & 29249.2509803922 & 2816.74901960784 \tabularnewline
44 & 27186 & 25875.2509803922 & 1310.74901960784 \tabularnewline
45 & 29586 & 26503.6509803922 & 3082.34901960784 \tabularnewline
46 & 21359 & 20220.6509803922 & 1138.34901960784 \tabularnewline
47 & 21553 & 19432.4509803922 & 2120.54901960784 \tabularnewline
48 & 19573 & 21073.0509803922 & -1500.05098039216 \tabularnewline
49 & 24256 & 23613.6431372549 & 642.356862745097 \tabularnewline
50 & 22380 & 19560.9019607843 & 2819.09803921569 \tabularnewline
51 & 16167 & 13649.1019607843 & 2517.89803921569 \tabularnewline
52 & 27297 & 29384.3019607843 & -2087.30196078431 \tabularnewline
53 & 28287 & 27790.1019607843 & 496.898039215686 \tabularnewline
54 & 33474 & 32105.3019607843 & 1368.69803921569 \tabularnewline
55 & 28229 & 29641.9019607843 & -1412.90196078431 \tabularnewline
56 & 28785 & 26267.9019607843 & 2517.09803921569 \tabularnewline
57 & 25597 & 26896.3019607843 & -1299.30196078431 \tabularnewline
58 & 18130 & 20613.3019607843 & -2483.30196078431 \tabularnewline
59 & 20198 & 19825.1019607843 & 372.898039215688 \tabularnewline
60 & 22849 & 21465.7019607843 & 1383.29803921569 \tabularnewline
61 & 23118 & 24006.2941176471 & -888.294117647059 \tabularnewline
\hline
\end{tabular}
%Source: https://freestatistics.org/blog/index.php?pk=147886&T=4

[TABLE]
[ROW][C]Multiple Linear Regression - Actuals, Interpolation, and Residuals[/C][/ROW]
[ROW][C]Time or Index[/C][C]Actuals[/C][C]InterpolationForecast[/C][C]ResidualsPrediction Error[/C][/ROW]
[ROW][C]1[/C][C]20995[/C][C]22043.0392156863[/C][C]-1048.03921568627[/C][/ROW]
[ROW][C]2[/C][C]17382[/C][C]17990.2980392157[/C][C]-608.298039215688[/C][/ROW]
[ROW][C]3[/C][C]9367[/C][C]12078.4980392157[/C][C]-2711.49803921569[/C][/ROW]
[ROW][C]4[/C][C]31124[/C][C]27813.6980392157[/C][C]3310.30196078431[/C][/ROW]
[ROW][C]5[/C][C]26551[/C][C]26219.4980392157[/C][C]331.501960784314[/C][/ROW]
[ROW][C]6[/C][C]30651[/C][C]30534.6980392157[/C][C]116.301960784313[/C][/ROW]
[ROW][C]7[/C][C]25859[/C][C]28071.2980392157[/C][C]-2212.29803921569[/C][/ROW]
[ROW][C]8[/C][C]25100[/C][C]24697.2980392157[/C][C]402.701960784312[/C][/ROW]
[ROW][C]9[/C][C]25778[/C][C]25325.6980392157[/C][C]452.301960784313[/C][/ROW]
[ROW][C]10[/C][C]20418[/C][C]19042.6980392157[/C][C]1375.30196078431[/C][/ROW]
[ROW][C]11[/C][C]18688[/C][C]18254.4980392157[/C][C]433.501960784313[/C][/ROW]
[ROW][C]12[/C][C]20424[/C][C]19895.0980392157[/C][C]528.901960784312[/C][/ROW]
[ROW][C]13[/C][C]24776[/C][C]22435.6901960784[/C][C]2340.30980392157[/C][/ROW]
[ROW][C]14[/C][C]19814[/C][C]18382.9490196078[/C][C]1431.05098039216[/C][/ROW]
[ROW][C]15[/C][C]12738[/C][C]12471.1490196078[/C][C]266.850980392157[/C][/ROW]
[ROW][C]16[/C][C]31566[/C][C]28206.3490196078[/C][C]3359.65098039216[/C][/ROW]
[ROW][C]17[/C][C]30111[/C][C]26612.1490196078[/C][C]3498.85098039216[/C][/ROW]
[ROW][C]18[/C][C]30019[/C][C]30927.3490196078[/C][C]-908.349019607844[/C][/ROW]
[ROW][C]19[/C][C]31934[/C][C]28463.9490196078[/C][C]3470.05098039216[/C][/ROW]
[ROW][C]20[/C][C]25826[/C][C]25089.9490196078[/C][C]736.050980392156[/C][/ROW]
[ROW][C]21[/C][C]26835[/C][C]25718.3490196078[/C][C]1116.65098039216[/C][/ROW]
[ROW][C]22[/C][C]20205[/C][C]19435.3490196078[/C][C]769.650980392157[/C][/ROW]
[ROW][C]23[/C][C]17789[/C][C]18647.1490196078[/C][C]-858.149019607844[/C][/ROW]
[ROW][C]24[/C][C]20520[/C][C]20287.7490196078[/C][C]232.250980392156[/C][/ROW]
[ROW][C]25[/C][C]22518[/C][C]22828.3411764706[/C][C]-310.34117647059[/C][/ROW]
[ROW][C]26[/C][C]15572[/C][C]18775.6[/C][C]-3203.6[/C][/ROW]
[ROW][C]27[/C][C]11509[/C][C]12863.8[/C][C]-1354.8[/C][/ROW]
[ROW][C]28[/C][C]25447[/C][C]28599[/C][C]-3152[/C][/ROW]
[ROW][C]29[/C][C]24090[/C][C]27004.8[/C][C]-2914.8[/C][/ROW]
[ROW][C]30[/C][C]27786[/C][C]31320[/C][C]-3534[/C][/ROW]
[ROW][C]31[/C][C]26195[/C][C]28856.6[/C][C]-2661.6[/C][/ROW]
[ROW][C]32[/C][C]20516[/C][C]25482.6[/C][C]-4966.6[/C][/ROW]
[ROW][C]33[/C][C]22759[/C][C]26111[/C][C]-3352[/C][/ROW]
[ROW][C]34[/C][C]19028[/C][C]19828[/C][C]-800.000000000001[/C][/ROW]
[ROW][C]35[/C][C]16971[/C][C]19039.8[/C][C]-2068.8[/C][/ROW]
[ROW][C]36[/C][C]20036[/C][C]20680.4[/C][C]-644.400000000001[/C][/ROW]
[ROW][C]37[/C][C]22485[/C][C]23220.9921568627[/C][C]-735.992156862747[/C][/ROW]
[ROW][C]38[/C][C]18730[/C][C]19168.2509803922[/C][C]-438.250980392156[/C][/ROW]
[ROW][C]39[/C][C]14538[/C][C]13256.4509803922[/C][C]1281.54901960784[/C][/ROW]
[ROW][C]40[/C][C]27561[/C][C]28991.6509803922[/C][C]-1430.65098039216[/C][/ROW]
[ROW][C]41[/C][C]25985[/C][C]27397.4509803922[/C][C]-1412.45098039216[/C][/ROW]
[ROW][C]42[/C][C]34670[/C][C]31712.6509803922[/C][C]2957.34901960784[/C][/ROW]
[ROW][C]43[/C][C]32066[/C][C]29249.2509803922[/C][C]2816.74901960784[/C][/ROW]
[ROW][C]44[/C][C]27186[/C][C]25875.2509803922[/C][C]1310.74901960784[/C][/ROW]
[ROW][C]45[/C][C]29586[/C][C]26503.6509803922[/C][C]3082.34901960784[/C][/ROW]
[ROW][C]46[/C][C]21359[/C][C]20220.6509803922[/C][C]1138.34901960784[/C][/ROW]
[ROW][C]47[/C][C]21553[/C][C]19432.4509803922[/C][C]2120.54901960784[/C][/ROW]
[ROW][C]48[/C][C]19573[/C][C]21073.0509803922[/C][C]-1500.05098039216[/C][/ROW]
[ROW][C]49[/C][C]24256[/C][C]23613.6431372549[/C][C]642.356862745097[/C][/ROW]
[ROW][C]50[/C][C]22380[/C][C]19560.9019607843[/C][C]2819.09803921569[/C][/ROW]
[ROW][C]51[/C][C]16167[/C][C]13649.1019607843[/C][C]2517.89803921569[/C][/ROW]
[ROW][C]52[/C][C]27297[/C][C]29384.3019607843[/C][C]-2087.30196078431[/C][/ROW]
[ROW][C]53[/C][C]28287[/C][C]27790.1019607843[/C][C]496.898039215686[/C][/ROW]
[ROW][C]54[/C][C]33474[/C][C]32105.3019607843[/C][C]1368.69803921569[/C][/ROW]
[ROW][C]55[/C][C]28229[/C][C]29641.9019607843[/C][C]-1412.90196078431[/C][/ROW]
[ROW][C]56[/C][C]28785[/C][C]26267.9019607843[/C][C]2517.09803921569[/C][/ROW]
[ROW][C]57[/C][C]25597[/C][C]26896.3019607843[/C][C]-1299.30196078431[/C][/ROW]
[ROW][C]58[/C][C]18130[/C][C]20613.3019607843[/C][C]-2483.30196078431[/C][/ROW]
[ROW][C]59[/C][C]20198[/C][C]19825.1019607843[/C][C]372.898039215688[/C][/ROW]
[ROW][C]60[/C][C]22849[/C][C]21465.7019607843[/C][C]1383.29803921569[/C][/ROW]
[ROW][C]61[/C][C]23118[/C][C]24006.2941176471[/C][C]-888.294117647059[/C][/ROW]
[/TABLE]
Source: https://freestatistics.org/blog/index.php?pk=147886&T=4

Globally Unique Identifier (entire table): ba.freestatistics.org/blog/index.php?pk=147886&T=4

As an alternative you can also use a QR Code:  

The GUIDs for individual cells are displayed in the table below:

Multiple Linear Regression - Actuals, Interpolation, and Residuals
Time or IndexActualsInterpolationForecastResidualsPrediction Error
12099522043.0392156863-1048.03921568627
21738217990.2980392157-608.298039215688
3936712078.4980392157-2711.49803921569
43112427813.69803921573310.30196078431
52655126219.4980392157331.501960784314
63065130534.6980392157116.301960784313
72585928071.2980392157-2212.29803921569
82510024697.2980392157402.701960784312
92577825325.6980392157452.301960784313
102041819042.69803921571375.30196078431
111868818254.4980392157433.501960784313
122042419895.0980392157528.901960784312
132477622435.69019607842340.30980392157
141981418382.94901960781431.05098039216
151273812471.1490196078266.850980392157
163156628206.34901960783359.65098039216
173011126612.14901960783498.85098039216
183001930927.3490196078-908.349019607844
193193428463.94901960783470.05098039216
202582625089.9490196078736.050980392156
212683525718.34901960781116.65098039216
222020519435.3490196078769.650980392157
231778918647.1490196078-858.149019607844
242052020287.7490196078232.250980392156
252251822828.3411764706-310.34117647059
261557218775.6-3203.6
271150912863.8-1354.8
282544728599-3152
292409027004.8-2914.8
302778631320-3534
312619528856.6-2661.6
322051625482.6-4966.6
332275926111-3352
341902819828-800.000000000001
351697119039.8-2068.8
362003620680.4-644.400000000001
372248523220.9921568627-735.992156862747
381873019168.2509803922-438.250980392156
391453813256.45098039221281.54901960784
402756128991.6509803922-1430.65098039216
412598527397.4509803922-1412.45098039216
423467031712.65098039222957.34901960784
433206629249.25098039222816.74901960784
442718625875.25098039221310.74901960784
452958626503.65098039223082.34901960784
462135920220.65098039221138.34901960784
472155319432.45098039222120.54901960784
481957321073.0509803922-1500.05098039216
492425623613.6431372549642.356862745097
502238019560.90196078432819.09803921569
511616713649.10196078432517.89803921569
522729729384.3019607843-2087.30196078431
532828727790.1019607843496.898039215686
543347432105.30196078431368.69803921569
552822929641.9019607843-1412.90196078431
562878526267.90196078432517.09803921569
572559726896.3019607843-1299.30196078431
581813020613.3019607843-2483.30196078431
592019819825.1019607843372.898039215688
602284921465.70196078431383.29803921569
612311824006.2941176471-888.294117647059


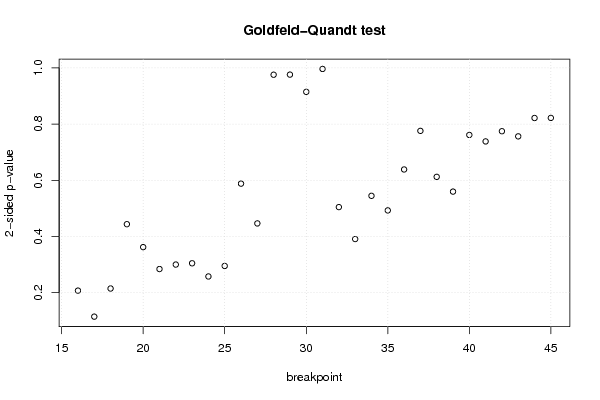
Goldfeld-Quandt test for Heteroskedasticity
p-valuesAlternative Hypothesis
breakpoint indexgreater2-sidedless
160.103690819942910.2073816398858190.89630918005709
170.05738180524648860.1147636104929770.942618194753511
180.1074450867556820.2148901735113640.892554913244318
190.2218639533632960.4437279067265920.778136046636704
200.181086212568260.362172425136520.81891378743174
210.1421129979648680.2842259959297350.857887002035132
220.150067593322430.3001351866448590.849932406677571
230.1523419150205630.3046838300411260.847658084979437
240.128881809592340.2577636191846810.87111819040766
250.1476050052752710.2952100105505420.852394994724729
260.2940512908190920.5881025816381840.705948709180908
270.2232572204942020.4465144409884040.776742779505798
280.4878237867941610.9756475735883220.512176213205839
290.5119827076794170.9760345846411660.488017292320583
300.5426624248169030.9146751503661930.457337575183097
310.498084369648970.9961687392979410.50191563035103
320.7477049221776270.5045901556447470.252295077822373
330.8045245218871060.3909509562257890.195475478112894
340.727645187926490.544709624147020.27235481207351
350.7535845519065120.4928308961869760.246415448093488
360.6807583547788390.6384832904423220.319241645221161
370.6120585381097120.7758829237805750.387941461890287
380.6938930171319850.6122139657360310.306106982868015
390.7201143373089210.5597713253821580.279885662691079
400.6193401360110880.7613197279778250.380659863988912
410.6308546367669640.7382907264660710.369145363233036
420.6127194480756480.7745611038487030.387280551924352
430.6218208463677020.7563583072645950.378179153632298
440.5892090178748980.8215819642502040.410790982125102
450.5890476354901860.8219047290196280.410952364509814

\begin{tabular}{lllllllll}
\hline
Goldfeld-Quandt test for Heteroskedasticity \tabularnewline
p-values & Alternative Hypothesis \tabularnewline
breakpoint index & greater & 2-sided & less \tabularnewline
16 & 0.10369081994291 & 0.207381639885819 & 0.89630918005709 \tabularnewline
17 & 0.0573818052464886 & 0.114763610492977 & 0.942618194753511 \tabularnewline
18 & 0.107445086755682 & 0.214890173511364 & 0.892554913244318 \tabularnewline
19 & 0.221863953363296 & 0.443727906726592 & 0.778136046636704 \tabularnewline
20 & 0.18108621256826 & 0.36217242513652 & 0.81891378743174 \tabularnewline
21 & 0.142112997964868 & 0.284225995929735 & 0.857887002035132 \tabularnewline
22 & 0.15006759332243 & 0.300135186644859 & 0.849932406677571 \tabularnewline
23 & 0.152341915020563 & 0.304683830041126 & 0.847658084979437 \tabularnewline
24 & 0.12888180959234 & 0.257763619184681 & 0.87111819040766 \tabularnewline
25 & 0.147605005275271 & 0.295210010550542 & 0.852394994724729 \tabularnewline
26 & 0.294051290819092 & 0.588102581638184 & 0.705948709180908 \tabularnewline
27 & 0.223257220494202 & 0.446514440988404 & 0.776742779505798 \tabularnewline
28 & 0.487823786794161 & 0.975647573588322 & 0.512176213205839 \tabularnewline
29 & 0.511982707679417 & 0.976034584641166 & 0.488017292320583 \tabularnewline
30 & 0.542662424816903 & 0.914675150366193 & 0.457337575183097 \tabularnewline
31 & 0.49808436964897 & 0.996168739297941 & 0.50191563035103 \tabularnewline
32 & 0.747704922177627 & 0.504590155644747 & 0.252295077822373 \tabularnewline
33 & 0.804524521887106 & 0.390950956225789 & 0.195475478112894 \tabularnewline
34 & 0.72764518792649 & 0.54470962414702 & 0.27235481207351 \tabularnewline
35 & 0.753584551906512 & 0.492830896186976 & 0.246415448093488 \tabularnewline
36 & 0.680758354778839 & 0.638483290442322 & 0.319241645221161 \tabularnewline
37 & 0.612058538109712 & 0.775882923780575 & 0.387941461890287 \tabularnewline
38 & 0.693893017131985 & 0.612213965736031 & 0.306106982868015 \tabularnewline
39 & 0.720114337308921 & 0.559771325382158 & 0.279885662691079 \tabularnewline
40 & 0.619340136011088 & 0.761319727977825 & 0.380659863988912 \tabularnewline
41 & 0.630854636766964 & 0.738290726466071 & 0.369145363233036 \tabularnewline
42 & 0.612719448075648 & 0.774561103848703 & 0.387280551924352 \tabularnewline
43 & 0.621820846367702 & 0.756358307264595 & 0.378179153632298 \tabularnewline
44 & 0.589209017874898 & 0.821581964250204 & 0.410790982125102 \tabularnewline
45 & 0.589047635490186 & 0.821904729019628 & 0.410952364509814 \tabularnewline
\hline
\end{tabular}
%Source: https://freestatistics.org/blog/index.php?pk=147886&T=5

[TABLE]
[ROW][C]Goldfeld-Quandt test for Heteroskedasticity[/C][/ROW]
[ROW][C]p-values[/C][C]Alternative Hypothesis[/C][/ROW]
[ROW][C]breakpoint index[/C][C]greater[/C][C]2-sided[/C][C]less[/C][/ROW]
[ROW][C]16[/C][C]0.10369081994291[/C][C]0.207381639885819[/C][C]0.89630918005709[/C][/ROW]
[ROW][C]17[/C][C]0.0573818052464886[/C][C]0.114763610492977[/C][C]0.942618194753511[/C][/ROW]
[ROW][C]18[/C][C]0.107445086755682[/C][C]0.214890173511364[/C][C]0.892554913244318[/C][/ROW]
[ROW][C]19[/C][C]0.221863953363296[/C][C]0.443727906726592[/C][C]0.778136046636704[/C][/ROW]
[ROW][C]20[/C][C]0.18108621256826[/C][C]0.36217242513652[/C][C]0.81891378743174[/C][/ROW]
[ROW][C]21[/C][C]0.142112997964868[/C][C]0.284225995929735[/C][C]0.857887002035132[/C][/ROW]
[ROW][C]22[/C][C]0.15006759332243[/C][C]0.300135186644859[/C][C]0.849932406677571[/C][/ROW]
[ROW][C]23[/C][C]0.152341915020563[/C][C]0.304683830041126[/C][C]0.847658084979437[/C][/ROW]
[ROW][C]24[/C][C]0.12888180959234[/C][C]0.257763619184681[/C][C]0.87111819040766[/C][/ROW]
[ROW][C]25[/C][C]0.147605005275271[/C][C]0.295210010550542[/C][C]0.852394994724729[/C][/ROW]
[ROW][C]26[/C][C]0.294051290819092[/C][C]0.588102581638184[/C][C]0.705948709180908[/C][/ROW]
[ROW][C]27[/C][C]0.223257220494202[/C][C]0.446514440988404[/C][C]0.776742779505798[/C][/ROW]
[ROW][C]28[/C][C]0.487823786794161[/C][C]0.975647573588322[/C][C]0.512176213205839[/C][/ROW]
[ROW][C]29[/C][C]0.511982707679417[/C][C]0.976034584641166[/C][C]0.488017292320583[/C][/ROW]
[ROW][C]30[/C][C]0.542662424816903[/C][C]0.914675150366193[/C][C]0.457337575183097[/C][/ROW]
[ROW][C]31[/C][C]0.49808436964897[/C][C]0.996168739297941[/C][C]0.50191563035103[/C][/ROW]
[ROW][C]32[/C][C]0.747704922177627[/C][C]0.504590155644747[/C][C]0.252295077822373[/C][/ROW]
[ROW][C]33[/C][C]0.804524521887106[/C][C]0.390950956225789[/C][C]0.195475478112894[/C][/ROW]
[ROW][C]34[/C][C]0.72764518792649[/C][C]0.54470962414702[/C][C]0.27235481207351[/C][/ROW]
[ROW][C]35[/C][C]0.753584551906512[/C][C]0.492830896186976[/C][C]0.246415448093488[/C][/ROW]
[ROW][C]36[/C][C]0.680758354778839[/C][C]0.638483290442322[/C][C]0.319241645221161[/C][/ROW]
[ROW][C]37[/C][C]0.612058538109712[/C][C]0.775882923780575[/C][C]0.387941461890287[/C][/ROW]
[ROW][C]38[/C][C]0.693893017131985[/C][C]0.612213965736031[/C][C]0.306106982868015[/C][/ROW]
[ROW][C]39[/C][C]0.720114337308921[/C][C]0.559771325382158[/C][C]0.279885662691079[/C][/ROW]
[ROW][C]40[/C][C]0.619340136011088[/C][C]0.761319727977825[/C][C]0.380659863988912[/C][/ROW]
[ROW][C]41[/C][C]0.630854636766964[/C][C]0.738290726466071[/C][C]0.369145363233036[/C][/ROW]
[ROW][C]42[/C][C]0.612719448075648[/C][C]0.774561103848703[/C][C]0.387280551924352[/C][/ROW]
[ROW][C]43[/C][C]0.621820846367702[/C][C]0.756358307264595[/C][C]0.378179153632298[/C][/ROW]
[ROW][C]44[/C][C]0.589209017874898[/C][C]0.821581964250204[/C][C]0.410790982125102[/C][/ROW]
[ROW][C]45[/C][C]0.589047635490186[/C][C]0.821904729019628[/C][C]0.410952364509814[/C][/ROW]
[/TABLE]
Source: https://freestatistics.org/blog/index.php?pk=147886&T=5

Globally Unique Identifier (entire table): ba.freestatistics.org/blog/index.php?pk=147886&T=5

As an alternative you can also use a QR Code:  

The GUIDs for individual cells are displayed in the table below:

Goldfeld-Quandt test for Heteroskedasticity
p-valuesAlternative Hypothesis
breakpoint indexgreater2-sidedless
160.103690819942910.2073816398858190.89630918005709
170.05738180524648860.1147636104929770.942618194753511
180.1074450867556820.2148901735113640.892554913244318
190.2218639533632960.4437279067265920.778136046636704
200.181086212568260.362172425136520.81891378743174
210.1421129979648680.2842259959297350.857887002035132
220.150067593322430.3001351866448590.849932406677571
230.1523419150205630.3046838300411260.847658084979437
240.128881809592340.2577636191846810.87111819040766
250.1476050052752710.2952100105505420.852394994724729
260.2940512908190920.5881025816381840.705948709180908
270.2232572204942020.4465144409884040.776742779505798
280.4878237867941610.9756475735883220.512176213205839
290.5119827076794170.9760345846411660.488017292320583
300.5426624248169030.9146751503661930.457337575183097
310.498084369648970.9961687392979410.50191563035103
320.7477049221776270.5045901556447470.252295077822373
330.8045245218871060.3909509562257890.195475478112894
340.727645187926490.544709624147020.27235481207351
350.7535845519065120.4928308961869760.246415448093488
360.6807583547788390.6384832904423220.319241645221161
370.6120585381097120.7758829237805750.387941461890287
380.6938930171319850.6122139657360310.306106982868015
390.7201143373089210.5597713253821580.279885662691079
400.6193401360110880.7613197279778250.380659863988912
410.6308546367669640.7382907264660710.369145363233036
420.6127194480756480.7745611038487030.387280551924352
430.6218208463677020.7563583072645950.378179153632298
440.5892090178748980.8215819642502040.410790982125102
450.5890476354901860.8219047290196280.410952364509814


Meta Analysis of Goldfeld-Quandt test for Heteroskedasticity
Description# significant tests% significant testsOK/NOK
1% type I error level00OK
5% type I error level00OK
10% type I error level00OK

\begin{tabular}{lllllllll}
\hline
Meta Analysis of Goldfeld-Quandt test for Heteroskedasticity \tabularnewline
Description & # significant tests & % significant tests & OK/NOK \tabularnewline
1% type I error level & 0 & 0 & OK \tabularnewline
5% type I error level & 0 & 0 & OK \tabularnewline
10% type I error level & 0 & 0 & OK \tabularnewline
\hline
\end{tabular}
%Source: https://freestatistics.org/blog/index.php?pk=147886&T=6

[TABLE]
[ROW][C]Meta Analysis of Goldfeld-Quandt test for Heteroskedasticity[/C][/ROW]
[ROW][C]Description[/C][C]# significant tests[/C][C]% significant tests[/C][C]OK/NOK[/C][/ROW]
[ROW][C]1% type I error level[/C][C]0[/C][C]0[/C][C]OK[/C][/ROW]
[ROW][C]5% type I error level[/C][C]0[/C][C]0[/C][C]OK[/C][/ROW]
[ROW][C]10% type I error level[/C][C]0[/C][C]0[/C][C]OK[/C][/ROW]
[/TABLE]
Source: https://freestatistics.org/blog/index.php?pk=147886&T=6

Globally Unique Identifier (entire table): ba.freestatistics.org/blog/index.php?pk=147886&T=6

As an alternative you can also use a QR Code:  

The GUIDs for individual cells are displayed in the table below:

Meta Analysis of Goldfeld-Quandt test for Heteroskedasticity
Description# significant tests% significant testsOK/NOK
1% type I error level00OK
5% type I error level00OK
10% type I error level00OK


Parameters (Session):
par1 = 1 ; par2 = Include Monthly Dummies ; par3 = Linear Trend ;
Parameters (R input):
par1 = 1 ; par2 = Include Monthly Dummies ; par3 = Linear Trend ;
R code (references can be found in the software module):
library(lattice)
library(lmtest)
n25 <- 25 #minimum number of obs. for Goldfeld-Quandt test
par1 <- as.numeric(par1)
x <- t(y)
k <- length(x[1,])
n <- length(x[,1])
x1 <- cbind(x[,par1], x[,1:k!=par1])
mycolnames <- c(colnames(x)[par1], colnames(x)[1:k!=par1])
colnames(x1) <- mycolnames #colnames(x)[par1]
x <- x1
if (par3 == 'First Differences'){
x2 <- array(0, dim=c(n-1,k), dimnames=list(1:(n-1), paste('(1-B)',colnames(x),sep='')))
for (i in 1:n-1) {
for (j in 1:k) {
x2[i,j] <- x[i+1,j] - x[i,j]
}
}
x <- x2
}
if (par2 == 'Include Monthly Dummies'){
x2 <- array(0, dim=c(n,11), dimnames=list(1:n, paste('M', seq(1:11), sep ='')))
for (i in 1:11){
x2[seq(i,n,12),i] <- 1
}
x <- cbind(x, x2)
}
if (par2 == 'Include Quarterly Dummies'){
x2 <- array(0, dim=c(n,3), dimnames=list(1:n, paste('Q', seq(1:3), sep ='')))
for (i in 1:3){
x2[seq(i,n,4),i] <- 1
}
x <- cbind(x, x2)
}
k <- length(x[1,])
if (par3 == 'Linear Trend'){
x <- cbind(x, c(1:n))
colnames(x)[k+1] <- 't'
}
x
k <- length(x[1,])
df <- as.data.frame(x)
(mylm <- lm(df))
(mysum <- summary(mylm))
if (n > n25) {
kp3 <- k + 3
nmkm3 <- n - k - 3
gqarr <- array(NA, dim=c(nmkm3-kp3+1,3))
numgqtests <- 0
numsignificant1 <- 0
numsignificant5 <- 0
numsignificant10 <- 0
for (mypoint in kp3:nmkm3) {
j <- 0
numgqtests <- numgqtests + 1
for (myalt in c('greater', 'two.sided', 'less')) {
j <- j + 1
gqarr[mypoint-kp3+1,j] <- gqtest(mylm, point=mypoint, alternative=myalt)$p.value
}
if (gqarr[mypoint-kp3+1,2] < 0.01) numsignificant1 <- numsignificant1 + 1
if (gqarr[mypoint-kp3+1,2] < 0.05) numsignificant5 <- numsignificant5 + 1
if (gqarr[mypoint-kp3+1,2] < 0.10) numsignificant10 <- numsignificant10 + 1
}
gqarr
}
bitmap(file='test0.png')
plot(x[,1], type='l', main='Actuals and Interpolation', ylab='value of Actuals and Interpolation (dots)', xlab='time or index')
points(x[,1]-mysum$resid)
grid()
dev.off()
bitmap(file='test1.png')
plot(mysum$resid, type='b', pch=19, main='Residuals', ylab='value of Residuals', xlab='time or index')
grid()
dev.off()
bitmap(file='test2.png')
hist(mysum$resid, main='Residual Histogram', xlab='values of Residuals')
grid()
dev.off()
bitmap(file='test3.png')
densityplot(~mysum$resid,col='black',main='Residual Density Plot', xlab='values of Residuals')
dev.off()
bitmap(file='test4.png')
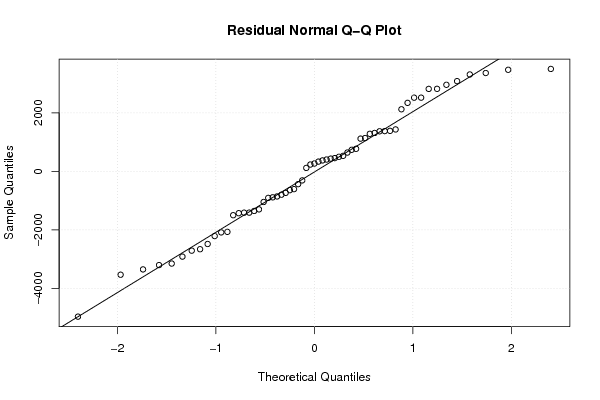
qqnorm(mysum$resid, main='Residual Normal Q-Q Plot')
qqline(mysum$resid)
grid()
dev.off()
(myerror <- as.ts(mysum$resid))
bitmap(file='test5.png')
dum <- cbind(lag(myerror,k=1),myerror)
dum
dum1 <- dum[2:length(myerror),]
dum1
z <- as.data.frame(dum1)
z
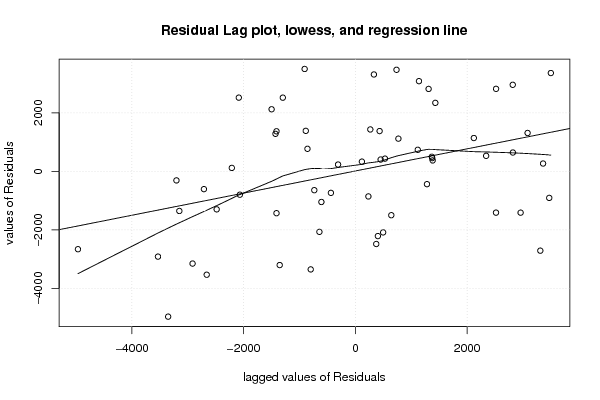
plot(z,main=paste('Residual Lag plot, lowess, and regression line'), ylab='values of Residuals', xlab='lagged values of Residuals')
lines(lowess(z))
abline(lm(z))
grid()
dev.off()
bitmap(file='test6.png')
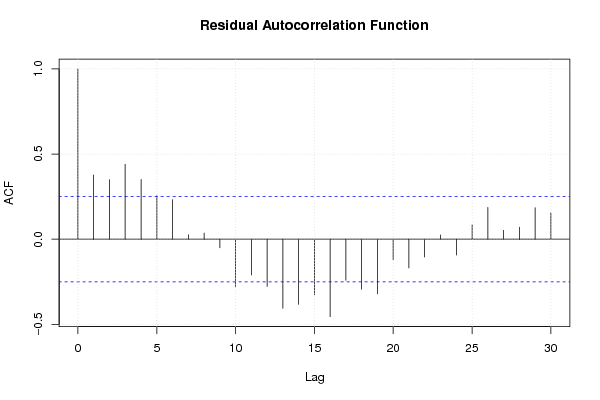
acf(mysum$resid, lag.max=length(mysum$resid)/2, main='Residual Autocorrelation Function')
grid()
dev.off()
bitmap(file='test7.png')
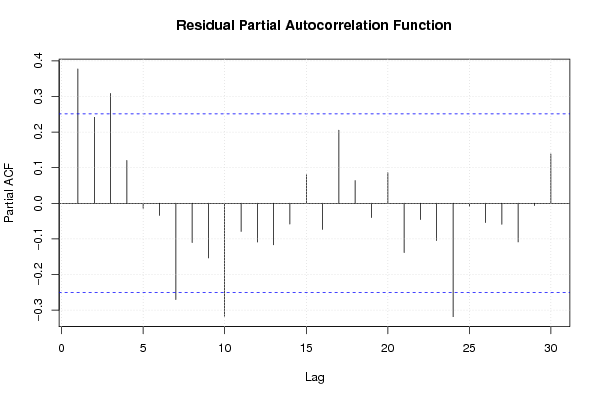
pacf(mysum$resid, lag.max=length(mysum$resid)/2, main='Residual Partial Autocorrelation Function')
grid()
dev.off()
bitmap(file='test8.png')
opar <- par(mfrow = c(2,2), oma = c(0, 0, 1.1, 0))
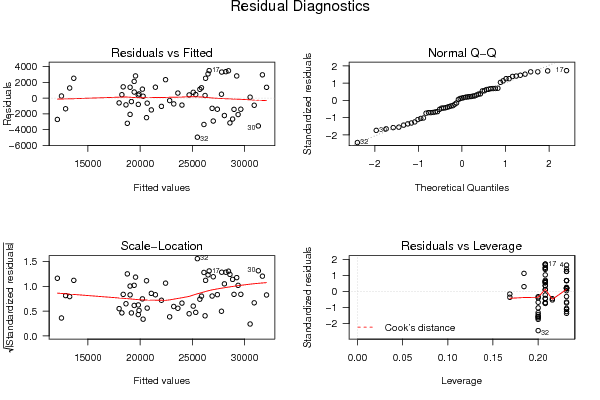
plot(mylm, las = 1, sub='Residual Diagnostics')
par(opar)
dev.off()
if (n > n25) {
bitmap(file='test9.png')
plot(kp3:nmkm3,gqarr[,2], main='Goldfeld-Quandt test',ylab='2-sided p-value',xlab='breakpoint')
grid()
dev.off()
}
load(file='createtable')
a<-table.start()
a<-table.row.start(a)
a<-table.element(a, 'Multiple Linear Regression - Estimated Regression Equation', 1, TRUE)
a<-table.row.end(a)
myeq <- colnames(x)[1]
myeq <- paste(myeq, '[t] = ', sep='')
for (i in 1:k){
if (mysum$coefficients[i,1] > 0) myeq <- paste(myeq, '+', '')
myeq <- paste(myeq, mysum$coefficients[i,1], sep=' ')
if (rownames(mysum$coefficients)[i] != '(Intercept)') {
myeq <- paste(myeq, rownames(mysum$coefficients)[i], sep='')
if (rownames(mysum$coefficients)[i] != 't') myeq <- paste(myeq, '[t]', sep='')
}
}
myeq <- paste(myeq, ' + e[t]')
a<-table.row.start(a)
a<-table.element(a, myeq)
a<-table.row.end(a)
a<-table.end(a)
table.save(a,file='mytable1.tab')
a<-table.start()
a<-table.row.start(a)
a<-table.element(a,hyperlink('ols1.htm','Multiple Linear Regression - Ordinary Least Squares',''), 6, TRUE)
a<-table.row.end(a)
a<-table.row.start(a)
a<-table.element(a,'Variable',header=TRUE)
a<-table.element(a,'Parameter',header=TRUE)
a<-table.element(a,'S.D.',header=TRUE)
a<-table.element(a,'T-STAT
H0: parameter = 0',header=TRUE)
a<-table.element(a,'2-tail p-value',header=TRUE)
a<-table.element(a,'1-tail p-value',header=TRUE)
a<-table.row.end(a)
for (i in 1:k){
a<-table.row.start(a)
a<-table.element(a,rownames(mysum$coefficients)[i],header=TRUE)
a<-table.element(a,mysum$coefficients[i,1])
a<-table.element(a, round(mysum$coefficients[i,2],6))
a<-table.element(a, round(mysum$coefficients[i,3],4))
a<-table.element(a, round(mysum$coefficients[i,4],6))
a<-table.element(a, round(mysum$coefficients[i,4]/2,6))
a<-table.row.end(a)
}
a<-table.end(a)
table.save(a,file='mytable2.tab')
a<-table.start()
a<-table.row.start(a)
a<-table.element(a, 'Multiple Linear Regression - Regression Statistics', 2, TRUE)
a<-table.row.end(a)
a<-table.row.start(a)
a<-table.element(a, 'Multiple R',1,TRUE)
a<-table.element(a, sqrt(mysum$r.squared))
a<-table.row.end(a)
a<-table.row.start(a)
a<-table.element(a, 'R-squared',1,TRUE)
a<-table.element(a, mysum$r.squared)
a<-table.row.end(a)
a<-table.row.start(a)
a<-table.element(a, 'Adjusted R-squared',1,TRUE)
a<-table.element(a, mysum$adj.r.squared)
a<-table.row.end(a)
a<-table.row.start(a)
a<-table.element(a, 'F-TEST (value)',1,TRUE)
a<-table.element(a, mysum$fstatistic[1])
a<-table.row.end(a)
a<-table.row.start(a)
a<-table.element(a, 'F-TEST (DF numerator)',1,TRUE)
a<-table.element(a, mysum$fstatistic[2])
a<-table.row.end(a)
a<-table.row.start(a)
a<-table.element(a, 'F-TEST (DF denominator)',1,TRUE)
a<-table.element(a, mysum$fstatistic[3])
a<-table.row.end(a)
a<-table.row.start(a)
a<-table.element(a, 'p-value',1,TRUE)
a<-table.element(a, 1-pf(mysum$fstatistic[1],mysum$fstatistic[2],mysum$fstatistic[3]))
a<-table.row.end(a)
a<-table.row.start(a)
a<-table.element(a, 'Multiple Linear Regression - Residual Statistics', 2, TRUE)
a<-table.row.end(a)
a<-table.row.start(a)
a<-table.element(a, 'Residual Standard Deviation',1,TRUE)
a<-table.element(a, mysum$sigma)
a<-table.row.end(a)
a<-table.row.start(a)
a<-table.element(a, 'Sum Squared Residuals',1,TRUE)
a<-table.element(a, sum(myerror*myerror))
a<-table.row.end(a)
a<-table.end(a)
table.save(a,file='mytable3.tab')
a<-table.start()
a<-table.row.start(a)
a<-table.element(a, 'Multiple Linear Regression - Actuals, Interpolation, and Residuals', 4, TRUE)
a<-table.row.end(a)
a<-table.row.start(a)
a<-table.element(a, 'Time or Index', 1, TRUE)
a<-table.element(a, 'Actuals', 1, TRUE)
a<-table.element(a, 'Interpolation
Forecast', 1, TRUE)
a<-table.element(a, 'Residuals
Prediction Error', 1, TRUE)
a<-table.row.end(a)
for (i in 1:n) {
a<-table.row.start(a)
a<-table.element(a,i, 1, TRUE)
a<-table.element(a,x[i])
a<-table.element(a,x[i]-mysum$resid[i])
a<-table.element(a,mysum$resid[i])
a<-table.row.end(a)
}
a<-table.end(a)
table.save(a,file='mytable4.tab')
if (n > n25) {
a<-table.start()
a<-table.row.start(a)
a<-table.element(a,'Goldfeld-Quandt test for Heteroskedasticity',4,TRUE)
a<-table.row.end(a)
a<-table.row.start(a)
a<-table.element(a,'p-values',header=TRUE)
a<-table.element(a,'Alternative Hypothesis',3,header=TRUE)
a<-table.row.end(a)
a<-table.row.start(a)
a<-table.element(a,'breakpoint index',header=TRUE)
a<-table.element(a,'greater',header=TRUE)
a<-table.element(a,'2-sided',header=TRUE)
a<-table.element(a,'less',header=TRUE)
a<-table.row.end(a)
for (mypoint in kp3:nmkm3) {
a<-table.row.start(a)
a<-table.element(a,mypoint,header=TRUE)
a<-table.element(a,gqarr[mypoint-kp3+1,1])
a<-table.element(a,gqarr[mypoint-kp3+1,2])
a<-table.element(a,gqarr[mypoint-kp3+1,3])
a<-table.row.end(a)
}
a<-table.end(a)
table.save(a,file='mytable5.tab')
a<-table.start()
a<-table.row.start(a)
a<-table.element(a,'Meta Analysis of Goldfeld-Quandt test for Heteroskedasticity',4,TRUE)
a<-table.row.end(a)
a<-table.row.start(a)
a<-table.element(a,'Description',header=TRUE)
a<-table.element(a,'# significant tests',header=TRUE)
a<-table.element(a,'% significant tests',header=TRUE)
a<-table.element(a,'OK/NOK',header=TRUE)
a<-table.row.end(a)
a<-table.row.start(a)
a<-table.element(a,'1% type I error level',header=TRUE)
a<-table.element(a,numsignificant1)
a<-table.element(a,numsignificant1/numgqtests)
if (numsignificant1/numgqtests < 0.01) dum <- 'OK' else dum <- 'NOK'
a<-table.element(a,dum)
a<-table.row.end(a)
a<-table.row.start(a)
a<-table.element(a,'5% type I error level',header=TRUE)
a<-table.element(a,numsignificant5)
a<-table.element(a,numsignificant5/numgqtests)
if (numsignificant5/numgqtests < 0.05) dum <- 'OK' else dum <- 'NOK'
a<-table.element(a,dum)
a<-table.row.end(a)
a<-table.row.start(a)
a<-table.element(a,'10% type I error level',header=TRUE)
a<-table.element(a,numsignificant10)
a<-table.element(a,numsignificant10/numgqtests)
if (numsignificant10/numgqtests < 0.1) dum <- 'OK' else dum <- 'NOK'
a<-table.element(a,dum)
a<-table.row.end(a)
a<-table.end(a)
table.save(a,file='mytable6.tab')
}