| Multiple Linear Regression - Estimated Regression Equation |
| X[t] = + 24.1698363156221 + 3.12409265557002Y[t] + 0.354106572914146`y(t)`[t] + 0.386685471568013`y(t-1)`[t] + 0.316297204680136`y(t-2)`[t] -0.0792357995923459`y(t-3)`[t] + 4.29883047671237M1[t] -22.2968495935552M2[t] -39.5691693349632M3[t] -35.9297143015368M4[t] -20.3378644943873M5[t] -6.96633419726574M6[t] -15.9323504617263M7[t] -22.9939682907714M8[t] -6.55872286116879M9[t] -44.2832772039972M10[t] -31.4045454857823M11[t] -0.0983757038209558t + e[t] |
| Multiple Linear Regression - Ordinary Least Squares | |||||
| Variable | Parameter | S.D. | T-STAT H0: parameter = 0 | 2-tail p-value | 1-tail p-value |
| (Intercept) | 24.1698363156221 | 18.638984 | 1.2967 | 0.201801 | 0.100901 |
| Y | 3.12409265557002 | 3.773085 | 0.828 | 0.412354 | 0.206177 |
| `y(t)` | 0.354106572914146 | 0.153497 | 2.3069 | 0.02606 | 0.01303 |
| `y(t-1)` | 0.386685471568013 | 0.161454 | 2.395 | 0.021157 | 0.010578 |
| `y(t-2)` | 0.316297204680136 | 0.156269 | 2.0241 | 0.049356 | 0.024678 |
| `y(t-3)` | -0.0792357995923459 | 0.157901 | -0.5018 | 0.618423 | 0.309212 |
| M1 | 4.29883047671237 | 9.799488 | 0.4387 | 0.663142 | 0.331571 |
| M2 | -22.2968495935552 | 10.749129 | -2.0743 | 0.044218 | 0.022109 |
| M3 | -39.5691693349632 | 7.999304 | -4.9466 | 1.3e-05 | 6e-06 |
| M4 | -35.9297143015368 | 5.974976 | -6.0134 | 0 | 0 |
| M5 | -20.3378644943873 | 6.115281 | -3.3257 | 0.001838 | 0.000919 |
| M6 | -6.96633419726574 | 6.522986 | -1.068 | 0.291636 | 0.145818 |
| M7 | -15.9323504617263 | 7.900121 | -2.0167 | 0.050148 | 0.025074 |
| M8 | -22.9939682907714 | 7.837306 | -2.9339 | 0.005404 | 0.002702 |
| M9 | -6.55872286116879 | 6.469515 | -1.0138 | 0.316488 | 0.158244 |
| M10 | -44.2832772039972 | 7.364443 | -6.0131 | 0 | 0 |
| M11 | -31.4045454857823 | 8.394784 | -3.741 | 0.00055 | 0.000275 |
| t | -0.0983757038209558 | 0.065916 | -1.4924 | 0.143057 | 0.071528 |
| Multiple Linear Regression - Regression Statistics | |
| Multiple R | 0.938958363418636 |
| R-squared | 0.881642808233803 |
| Adjusted R-squared | 0.833736325852247 |
| F-TEST (value) | 18.4034135758888 |
| F-TEST (DF numerator) | 17 |
| F-TEST (DF denominator) | 42 |
| p-value | 3.19744231092045e-14 |
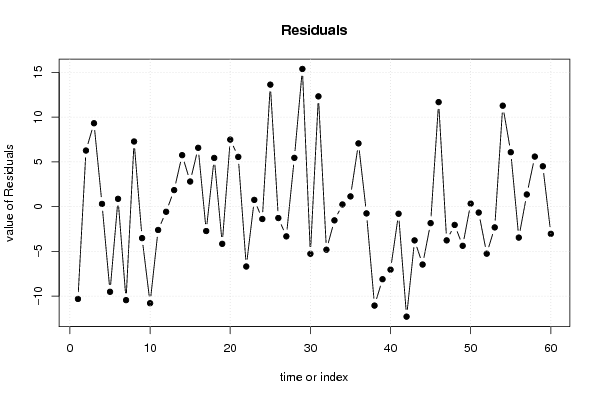
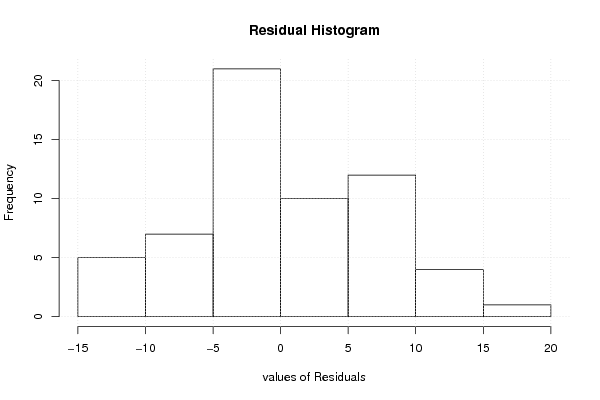
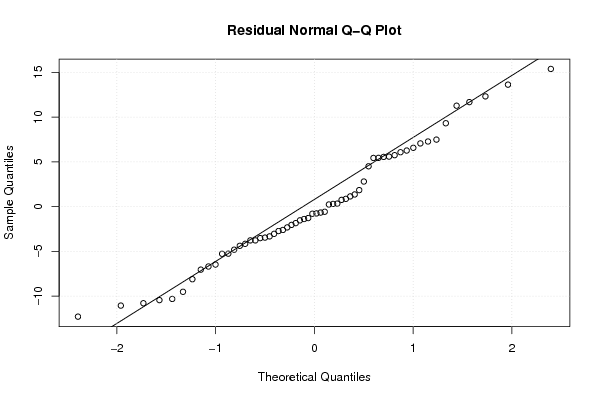
| Multiple Linear Regression - Residual Statistics | |
| Residual Standard Deviation | 7.73467319800471 |
| Sum Squared Residuals | 2512.65711815716 |
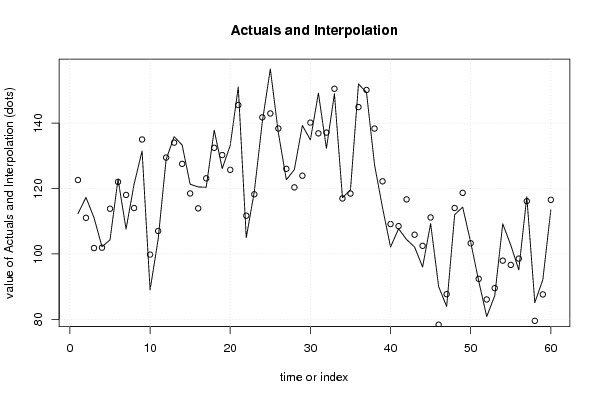
| Multiple Linear Regression - Actuals, Interpolation, and Residuals | |||
| Time or Index | Actuals | Interpolation Forecast | Residuals Prediction Error |
| 1 | 112.3 | 122.614877127651 | -10.3148771276511 |
| 2 | 117.3 | 111.040646166104 | 6.25935383389574 |
| 3 | 111.1 | 101.791118972656 | 9.30888102734388 |
| 4 | 102.2 | 101.903898293417 | 0.296101706582642 |
| 5 | 104.3 | 113.818115415492 | -9.51811541549151 |
| 6 | 122.9 | 122.036171447978 | 0.863828552022047 |
| 7 | 107.6 | 118.046418062012 | -10.4464180620117 |
| 8 | 121.3 | 114.030366480924 | 7.26963351907558 |
| 9 | 131.5 | 135.018941368546 | -3.51894136854591 |
| 10 | 89 | 99.7923562220788 | -10.7923562220788 |
| 11 | 104.4 | 107.012954135496 | -2.61295413549615 |
| 12 | 128.9 | 129.478933632017 | -0.578933632017005 |
| 13 | 135.9 | 134.059119348705 | 1.84088065129534 |
| 14 | 133.3 | 127.55610207318 | 5.74389792681968 |
| 15 | 121.3 | 118.500578040292 | 2.79942195970813 |
| 16 | 120.5 | 113.935706956029 | 6.56429304397084 |
| 17 | 120.4 | 123.128646812895 | -2.72864681289545 |
| 18 | 137.9 | 132.467488994429 | 5.43251100557129 |
| 19 | 126.1 | 130.259085336352 | -4.15908533635199 |
| 20 | 133.2 | 125.719388914745 | 7.48061108525489 |
| 21 | 151.1 | 145.550651405576 | 5.54934859442373 |
| 22 | 105 | 111.692762354131 | -6.6927623541313 |
| 23 | 119 | 118.251167886669 | 0.748832113330722 |
| 24 | 140.4 | 141.787775236812 | -1.38777523681202 |
| 25 | 156.6 | 142.980085323561 | 13.6199146764389 |
| 26 | 137.1 | 138.378556348966 | -1.27855634896627 |
| 27 | 122.7 | 126.026546357175 | -3.32654635717531 |
| 28 | 125.8 | 120.356492945783 | 5.44350705421722 |
| 29 | 139.3 | 123.928011189907 | 15.3719888100929 |
| 30 | 134.9 | 140.170747824066 | -5.27074782406636 |
| 31 | 149.2 | 136.890057649769 | 12.309942350231 |
| 32 | 132.3 | 137.116753319121 | -4.81675331912149 |
| 33 | 149 | 150.537433210987 | -1.53743321098743 |
| 34 | 117.2 | 116.964786007637 | 0.235213992362893 |
| 35 | 119.6 | 118.463705685282 | 1.13629431471773 |
| 36 | 152 | 144.944381577644 | 7.05561842235638 |
| 37 | 149.4 | 150.164445482696 | -0.764445482696071 |
| 38 | 127.3 | 138.357133616103 | -11.0571336161034 |
| 39 | 114.1 | 122.21316419601 | -8.1131641960097 |
| 40 | 102.1 | 109.144675202535 | -7.04467520253495 |
| 41 | 107.7 | 108.500467061705 | -0.800467061705034 |
| 42 | 104.4 | 116.692380873722 | -12.2923808737218 |
| 43 | 102.1 | 105.875221954062 | -3.77522195406176 |
| 44 | 96 | 102.470907844206 | -6.47090784420566 |
| 45 | 109.3 | 111.146756981873 | -1.84675698187302 |
| 46 | 90 | 78.3327502018773 | 11.6672497981227 |
| 47 | 83.9 | 87.6745955213965 | -3.77459552139645 |
| 48 | 112 | 114.047776807078 | -2.04777680707795 |
| 49 | 114.3 | 118.681472717387 | -4.38147271738715 |
| 50 | 103.6 | 103.267561795646 | 0.332438204354196 |
| 51 | 91.7 | 92.368592433867 | -0.668592433867004 |
| 52 | 80.8 | 86.0592266022357 | -5.25922660223575 |
| 53 | 87.2 | 89.5247595200009 | -2.32475952000089 |
| 54 | 109.2 | 97.9332108598052 | 11.2667891401948 |
| 55 | 102.7 | 96.6292169978056 | 6.07078300219442 |
| 56 | 95.1 | 98.5625834410033 | -3.46258344100332 |
| 57 | 117.5 | 116.146217033017 | 1.35378296698262 |
| 58 | 85.1 | 79.5173452142754 | 5.58265478572455 |
| 59 | 92.1 | 87.5975767711558 | 4.50242322884416 |
| 60 | 113.5 | 116.541132746449 | -3.04113274644944 |
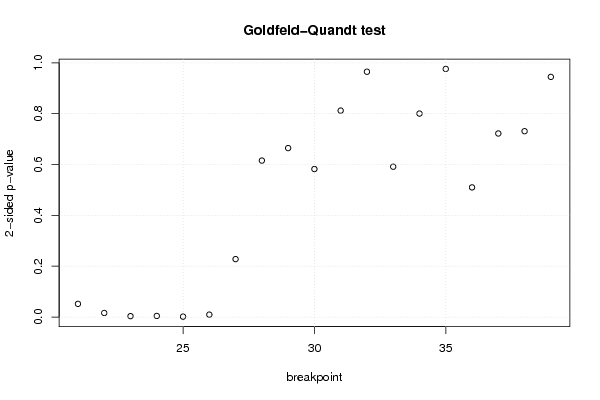
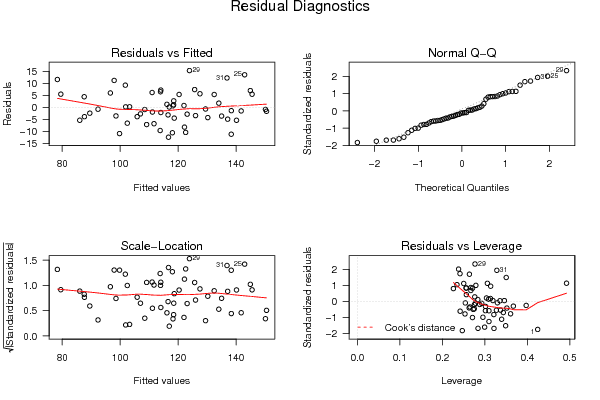
| Goldfeld-Quandt test for Heteroskedasticity | |||
| p-values | Alternative Hypothesis | ||
| breakpoint index | greater | 2-sided | less |
| 21 | 0.0259973488116895 | 0.051994697623379 | 0.974002651188311 |
| 22 | 0.0080862779847631 | 0.0161725559695262 | 0.991913722015237 |
| 23 | 0.00180360388777853 | 0.00360720777555707 | 0.998196396112221 |
| 24 | 0.00227512219887377 | 0.00455024439774753 | 0.997724877801126 |
| 25 | 0.000865485037479972 | 0.00173097007495994 | 0.99913451496252 |
| 26 | 0.00487259117129006 | 0.00974518234258013 | 0.99512740882871 |
| 27 | 0.114008741893157 | 0.228017483786314 | 0.885991258106843 |
| 28 | 0.307805443432943 | 0.615610886865887 | 0.692194556567057 |
| 29 | 0.332383312830079 | 0.664766625660158 | 0.667616687169921 |
| 30 | 0.291140181072003 | 0.582280362144007 | 0.708859818927997 |
| 31 | 0.593927548001024 | 0.812144903997952 | 0.406072451998976 |
| 32 | 0.517518877047327 | 0.964962245905347 | 0.482481122952673 |
| 33 | 0.704306281037771 | 0.591387437924457 | 0.295693718962229 |
| 34 | 0.599772058335015 | 0.80045588332997 | 0.400227941664985 |
| 35 | 0.512029590314381 | 0.975940819371238 | 0.487970409685619 |
| 36 | 0.744961238732765 | 0.510077522534471 | 0.255038761267235 |
| 37 | 0.638956286608275 | 0.72208742678345 | 0.361043713391725 |
| 38 | 0.634458320713501 | 0.731083358572998 | 0.365541679286499 |
| 39 | 0.527649135689452 | 0.944701728621095 | 0.472350864310548 |
| Meta Analysis of Goldfeld-Quandt test for Heteroskedasticity | |||
| Description | # significant tests | % significant tests | OK/NOK |
| 1% type I error level | 4 | 0.210526315789474 | NOK |
| 5% type I error level | 5 | 0.263157894736842 | NOK |
| 10% type I error level | 6 | 0.315789473684211 | NOK |