Free Statistics

of Irreproducible Research!

Author's title

Author*The author of this computation has been verified*
R Software Modulerwasp_exponentialsmoothing.wasp
Title produced by softwareExponential Smoothing
Date of computationFri, 25 Nov 2011 15:57:51 -0500
Cite this page as followsStatistical Computations at FreeStatistics.org, Office for Research Development and Education, URL https://freestatistics.org/blog/index.php?v=date/2011/Nov/25/t1322254716bis2n891v2tz0x7.htm/, Retrieved Sat, 20 Apr 2024 03:22:09 +0000
Statistical Computations at FreeStatistics.org, Office for Research Development and Education, URL https://freestatistics.org/blog/index.php?pk=147358, Retrieved Sat, 20 Apr 2024 03:22:09 +0000
QR Codes:

Original text written by user:
IsPrivate?No (this computation is public)
User-defined keywords
Estimated Impact172
Family? (F = Feedback message, R = changed R code, M = changed R Module, P = changed Parameters, D = changed Data)
-     [Univariate Explorative Data Analysis] [Run Sequence gebo...] [2008-12-12 13:32:37] [76963dc1903f0f612b6153510a3818cf]
- R  D  [Univariate Explorative Data Analysis] [Run Sequence gebo...] [2008-12-17 12:14:40] [76963dc1903f0f612b6153510a3818cf]
-         [Univariate Explorative Data Analysis] [Run Sequence Plot...] [2008-12-22 18:19:51] [1ce0d16c8f4225c977b42c8fa93bc163]
- RMP       [Univariate Data Series] [Identifying Integ...] [2009-11-22 12:08:06] [b98453cac15ba1066b407e146608df68]
- R P         [Univariate Data Series] [WS8 Time Series A...] [2010-11-30 09:10:08] [afe9379cca749d06b3d6872e02cc47ed]
- R PD          [Univariate Data Series] [] [2011-11-25 19:20:16] [f1de53e71fac758e9834be8effee591f]
- RMPD              [Exponential Smoothing] [] [2011-11-25 20:57:51] [13d85cac30d4a10947636c080219d4f4] [Current]
Feedback Forum

Post a new message
Dataseries X:
9.829
9.125
9.782
9.441
9.162
9.915
10.444
10.209
9.985
9.842
9.429
10.132
9.849
9.172
10.313
9.819
9.955
10.048
10.082
10.541
10.208
10.233
9.439
9.963
10.158
9.225
10.474
9.757
10.490
10.281
10.444
10.640
10.695
10.786
9.832
9.747
10.411
9.511
10.402
9.701
10.540
10.112
10.915
11.183
10.384
10.834
9.886
10.216
10.943
9.867
10.203
10.837
10.573
10.647
11.502
10.656
10.866
10.835
9.945
10.331


Summary of computational transaction
Raw Inputview raw input (R code)
Raw Outputview raw output of R engine
Computing time2 seconds
R Server'AstonUniversity' @ aston.wessa.net

\begin{tabular}{lllllllll}
\hline
Summary of computational transaction \tabularnewline
Raw Input & view raw input (R code)  \tabularnewline
Raw Output & view raw output of R engine  \tabularnewline
Computing time & 2 seconds \tabularnewline
R Server & 'AstonUniversity' @ aston.wessa.net \tabularnewline
\hline
\end{tabular}
%Source: https://freestatistics.org/blog/index.php?pk=147358&T=0

[TABLE]
[ROW][C]Summary of computational transaction[/C][/ROW]
[ROW][C]Raw Input[/C][C]view raw input (R code) [/C][/ROW]
[ROW][C]Raw Output[/C][C]view raw output of R engine [/C][/ROW]
[ROW][C]Computing time[/C][C]2 seconds[/C][/ROW]
[ROW][C]R Server[/C][C]'AstonUniversity' @ aston.wessa.net[/C][/ROW]
[/TABLE]
Source: https://freestatistics.org/blog/index.php?pk=147358&T=0

Globally Unique Identifier (entire table): ba.freestatistics.org/blog/index.php?pk=147358&T=0

As an alternative you can also use a QR Code:  

The GUIDs for individual cells are displayed in the table below:

Summary of computational transaction
Raw Inputview raw input (R code)
Raw Outputview raw output of R engine
Computing time2 seconds
R Server'AstonUniversity' @ aston.wessa.net


Estimated Parameters of Exponential Smoothing
ParameterValue
alpha0.143275889337061
betaFALSE
gammaFALSE

\begin{tabular}{lllllllll}
\hline
Estimated Parameters of Exponential Smoothing \tabularnewline
Parameter & Value \tabularnewline
alpha & 0.143275889337061 \tabularnewline
beta & FALSE \tabularnewline
gamma & FALSE \tabularnewline
\hline
\end{tabular}
%Source: https://freestatistics.org/blog/index.php?pk=147358&T=1

[TABLE]
[ROW][C]Estimated Parameters of Exponential Smoothing[/C][/ROW]
[ROW][C]Parameter[/C][C]Value[/C][/ROW]
[ROW][C]alpha[/C][C]0.143275889337061[/C][/ROW]
[ROW][C]beta[/C][C]FALSE[/C][/ROW]
[ROW][C]gamma[/C][C]FALSE[/C][/ROW]
[/TABLE]
Source: https://freestatistics.org/blog/index.php?pk=147358&T=1

Globally Unique Identifier (entire table): ba.freestatistics.org/blog/index.php?pk=147358&T=1

As an alternative you can also use a QR Code:  

The GUIDs for individual cells are displayed in the table below:

Estimated Parameters of Exponential Smoothing
ParameterValue
alpha0.143275889337061
betaFALSE
gammaFALSE


Interpolation Forecasts of Exponential Smoothing
tObservedFittedResiduals
29.1259.829-0.704
39.7829.72813377390670.0538662260932909
49.4419.73585150535546-0.294851505355457
59.1629.69360639370328-0.531606393703282
69.9159.617440014868180.297559985131823
710.4449.660073186369060.78392681363094
810.2099.77239099776720.436609002232798
99.9859.834946540854670.150053459145326
109.8429.85644558366182-0.0144455836618214
119.4299.85437587981568-0.425375879815681
1210.1329.793429772332550.338570227667445
139.8499.841938722804660.00706127719534067
149.1729.84295043357468-0.670950433574676
1510.3139.746819413503180.566180586496822
169.8199.82793944055889-0.00893944055888873
179.9559.826658634262640.128341365737361
1810.0489.84504685757740.202953142422608
1910.0829.874125149551740.207874850448258
2010.5419.903908603620530.637091396379475
2110.2089.995188440025790.212811559974215
2210.23310.02567920554230.207320794457702
239.43910.0553832767463-0.616383276746291
249.9639.96707041459797-0.00407041459797419
2510.1589.966487222326480.191512777673521
269.2259.99392638586706-0.768926385867063
2710.4749.883757774097230.590242225902772
289.7579.96832525393773-0.211325253937735
2910.499.938047440240430.551952559759574
3010.28110.01712893411180.263871065888154
3110.44410.05493529574730.389064704252711
3210.6410.11067888725880.529321112741243
3310.69510.18651784043160.508482159568359
3410.78610.25937107405580.526628925944173
359.83210.3348243017711-0.502824301771097
369.74710.2627817027546-0.515781702754557
3710.41110.18888262058860.222117379411385
389.51110.220706685661-0.709706685660999
3910.40210.11902282910450.282977170895538
409.70110.1595666349266-0.458566634926605
4110.5410.09386509248720.446134907512807
4210.11210.1577854681254-0.0457854681253966
4310.91510.1512255144610.763774485538983
4411.18310.26065598312960.92234401687043
4510.38410.3928056424214-0.00880564242139847
4610.83410.39154400617230.442455993827711
479.88610.4549372821805-0.568937282180467
4810.21610.3734222870991-0.157422287099051
4910.94310.35086746891350.59213253108654
509.86710.4357057839103-0.568705783910287
5110.20310.3542239569494-0.151223956949412
5210.83710.33255721002840.504442789971584
5310.57310.40483169938130.168168300618738
5410.64710.42892616221070.218073837789285
5511.50210.46017088526111.04182911473888
5610.65610.60943987821260.0465601217874241
5710.86610.61611082106930.249889178930689
5810.83510.65191391541630.183086084583687
599.94510.6781457370103-0.733145737010283
6010.33110.5731036295265-0.24210362952646

\begin{tabular}{lllllllll}
\hline
Interpolation Forecasts of Exponential Smoothing \tabularnewline
t & Observed & Fitted & Residuals \tabularnewline
2 & 9.125 & 9.829 & -0.704 \tabularnewline
3 & 9.782 & 9.7281337739067 & 0.0538662260932909 \tabularnewline
4 & 9.441 & 9.73585150535546 & -0.294851505355457 \tabularnewline
5 & 9.162 & 9.69360639370328 & -0.531606393703282 \tabularnewline
6 & 9.915 & 9.61744001486818 & 0.297559985131823 \tabularnewline
7 & 10.444 & 9.66007318636906 & 0.78392681363094 \tabularnewline
8 & 10.209 & 9.7723909977672 & 0.436609002232798 \tabularnewline
9 & 9.985 & 9.83494654085467 & 0.150053459145326 \tabularnewline
10 & 9.842 & 9.85644558366182 & -0.0144455836618214 \tabularnewline
11 & 9.429 & 9.85437587981568 & -0.425375879815681 \tabularnewline
12 & 10.132 & 9.79342977233255 & 0.338570227667445 \tabularnewline
13 & 9.849 & 9.84193872280466 & 0.00706127719534067 \tabularnewline
14 & 9.172 & 9.84295043357468 & -0.670950433574676 \tabularnewline
15 & 10.313 & 9.74681941350318 & 0.566180586496822 \tabularnewline
16 & 9.819 & 9.82793944055889 & -0.00893944055888873 \tabularnewline
17 & 9.955 & 9.82665863426264 & 0.128341365737361 \tabularnewline
18 & 10.048 & 9.8450468575774 & 0.202953142422608 \tabularnewline
19 & 10.082 & 9.87412514955174 & 0.207874850448258 \tabularnewline
20 & 10.541 & 9.90390860362053 & 0.637091396379475 \tabularnewline
21 & 10.208 & 9.99518844002579 & 0.212811559974215 \tabularnewline
22 & 10.233 & 10.0256792055423 & 0.207320794457702 \tabularnewline
23 & 9.439 & 10.0553832767463 & -0.616383276746291 \tabularnewline
24 & 9.963 & 9.96707041459797 & -0.00407041459797419 \tabularnewline
25 & 10.158 & 9.96648722232648 & 0.191512777673521 \tabularnewline
26 & 9.225 & 9.99392638586706 & -0.768926385867063 \tabularnewline
27 & 10.474 & 9.88375777409723 & 0.590242225902772 \tabularnewline
28 & 9.757 & 9.96832525393773 & -0.211325253937735 \tabularnewline
29 & 10.49 & 9.93804744024043 & 0.551952559759574 \tabularnewline
30 & 10.281 & 10.0171289341118 & 0.263871065888154 \tabularnewline
31 & 10.444 & 10.0549352957473 & 0.389064704252711 \tabularnewline
32 & 10.64 & 10.1106788872588 & 0.529321112741243 \tabularnewline
33 & 10.695 & 10.1865178404316 & 0.508482159568359 \tabularnewline
34 & 10.786 & 10.2593710740558 & 0.526628925944173 \tabularnewline
35 & 9.832 & 10.3348243017711 & -0.502824301771097 \tabularnewline
36 & 9.747 & 10.2627817027546 & -0.515781702754557 \tabularnewline
37 & 10.411 & 10.1888826205886 & 0.222117379411385 \tabularnewline
38 & 9.511 & 10.220706685661 & -0.709706685660999 \tabularnewline
39 & 10.402 & 10.1190228291045 & 0.282977170895538 \tabularnewline
40 & 9.701 & 10.1595666349266 & -0.458566634926605 \tabularnewline
41 & 10.54 & 10.0938650924872 & 0.446134907512807 \tabularnewline
42 & 10.112 & 10.1577854681254 & -0.0457854681253966 \tabularnewline
43 & 10.915 & 10.151225514461 & 0.763774485538983 \tabularnewline
44 & 11.183 & 10.2606559831296 & 0.92234401687043 \tabularnewline
45 & 10.384 & 10.3928056424214 & -0.00880564242139847 \tabularnewline
46 & 10.834 & 10.3915440061723 & 0.442455993827711 \tabularnewline
47 & 9.886 & 10.4549372821805 & -0.568937282180467 \tabularnewline
48 & 10.216 & 10.3734222870991 & -0.157422287099051 \tabularnewline
49 & 10.943 & 10.3508674689135 & 0.59213253108654 \tabularnewline
50 & 9.867 & 10.4357057839103 & -0.568705783910287 \tabularnewline
51 & 10.203 & 10.3542239569494 & -0.151223956949412 \tabularnewline
52 & 10.837 & 10.3325572100284 & 0.504442789971584 \tabularnewline
53 & 10.573 & 10.4048316993813 & 0.168168300618738 \tabularnewline
54 & 10.647 & 10.4289261622107 & 0.218073837789285 \tabularnewline
55 & 11.502 & 10.4601708852611 & 1.04182911473888 \tabularnewline
56 & 10.656 & 10.6094398782126 & 0.0465601217874241 \tabularnewline
57 & 10.866 & 10.6161108210693 & 0.249889178930689 \tabularnewline
58 & 10.835 & 10.6519139154163 & 0.183086084583687 \tabularnewline
59 & 9.945 & 10.6781457370103 & -0.733145737010283 \tabularnewline
60 & 10.331 & 10.5731036295265 & -0.24210362952646 \tabularnewline
\hline
\end{tabular}
%Source: https://freestatistics.org/blog/index.php?pk=147358&T=2

[TABLE]
[ROW][C]Interpolation Forecasts of Exponential Smoothing[/C][/ROW]
[ROW][C]t[/C][C]Observed[/C][C]Fitted[/C][C]Residuals[/C][/ROW]
[ROW][C]2[/C][C]9.125[/C][C]9.829[/C][C]-0.704[/C][/ROW]
[ROW][C]3[/C][C]9.782[/C][C]9.7281337739067[/C][C]0.0538662260932909[/C][/ROW]
[ROW][C]4[/C][C]9.441[/C][C]9.73585150535546[/C][C]-0.294851505355457[/C][/ROW]
[ROW][C]5[/C][C]9.162[/C][C]9.69360639370328[/C][C]-0.531606393703282[/C][/ROW]
[ROW][C]6[/C][C]9.915[/C][C]9.61744001486818[/C][C]0.297559985131823[/C][/ROW]
[ROW][C]7[/C][C]10.444[/C][C]9.66007318636906[/C][C]0.78392681363094[/C][/ROW]
[ROW][C]8[/C][C]10.209[/C][C]9.7723909977672[/C][C]0.436609002232798[/C][/ROW]
[ROW][C]9[/C][C]9.985[/C][C]9.83494654085467[/C][C]0.150053459145326[/C][/ROW]
[ROW][C]10[/C][C]9.842[/C][C]9.85644558366182[/C][C]-0.0144455836618214[/C][/ROW]
[ROW][C]11[/C][C]9.429[/C][C]9.85437587981568[/C][C]-0.425375879815681[/C][/ROW]
[ROW][C]12[/C][C]10.132[/C][C]9.79342977233255[/C][C]0.338570227667445[/C][/ROW]
[ROW][C]13[/C][C]9.849[/C][C]9.84193872280466[/C][C]0.00706127719534067[/C][/ROW]
[ROW][C]14[/C][C]9.172[/C][C]9.84295043357468[/C][C]-0.670950433574676[/C][/ROW]
[ROW][C]15[/C][C]10.313[/C][C]9.74681941350318[/C][C]0.566180586496822[/C][/ROW]
[ROW][C]16[/C][C]9.819[/C][C]9.82793944055889[/C][C]-0.00893944055888873[/C][/ROW]
[ROW][C]17[/C][C]9.955[/C][C]9.82665863426264[/C][C]0.128341365737361[/C][/ROW]
[ROW][C]18[/C][C]10.048[/C][C]9.8450468575774[/C][C]0.202953142422608[/C][/ROW]
[ROW][C]19[/C][C]10.082[/C][C]9.87412514955174[/C][C]0.207874850448258[/C][/ROW]
[ROW][C]20[/C][C]10.541[/C][C]9.90390860362053[/C][C]0.637091396379475[/C][/ROW]
[ROW][C]21[/C][C]10.208[/C][C]9.99518844002579[/C][C]0.212811559974215[/C][/ROW]
[ROW][C]22[/C][C]10.233[/C][C]10.0256792055423[/C][C]0.207320794457702[/C][/ROW]
[ROW][C]23[/C][C]9.439[/C][C]10.0553832767463[/C][C]-0.616383276746291[/C][/ROW]
[ROW][C]24[/C][C]9.963[/C][C]9.96707041459797[/C][C]-0.00407041459797419[/C][/ROW]
[ROW][C]25[/C][C]10.158[/C][C]9.96648722232648[/C][C]0.191512777673521[/C][/ROW]
[ROW][C]26[/C][C]9.225[/C][C]9.99392638586706[/C][C]-0.768926385867063[/C][/ROW]
[ROW][C]27[/C][C]10.474[/C][C]9.88375777409723[/C][C]0.590242225902772[/C][/ROW]
[ROW][C]28[/C][C]9.757[/C][C]9.96832525393773[/C][C]-0.211325253937735[/C][/ROW]
[ROW][C]29[/C][C]10.49[/C][C]9.93804744024043[/C][C]0.551952559759574[/C][/ROW]
[ROW][C]30[/C][C]10.281[/C][C]10.0171289341118[/C][C]0.263871065888154[/C][/ROW]
[ROW][C]31[/C][C]10.444[/C][C]10.0549352957473[/C][C]0.389064704252711[/C][/ROW]
[ROW][C]32[/C][C]10.64[/C][C]10.1106788872588[/C][C]0.529321112741243[/C][/ROW]
[ROW][C]33[/C][C]10.695[/C][C]10.1865178404316[/C][C]0.508482159568359[/C][/ROW]
[ROW][C]34[/C][C]10.786[/C][C]10.2593710740558[/C][C]0.526628925944173[/C][/ROW]
[ROW][C]35[/C][C]9.832[/C][C]10.3348243017711[/C][C]-0.502824301771097[/C][/ROW]
[ROW][C]36[/C][C]9.747[/C][C]10.2627817027546[/C][C]-0.515781702754557[/C][/ROW]
[ROW][C]37[/C][C]10.411[/C][C]10.1888826205886[/C][C]0.222117379411385[/C][/ROW]
[ROW][C]38[/C][C]9.511[/C][C]10.220706685661[/C][C]-0.709706685660999[/C][/ROW]
[ROW][C]39[/C][C]10.402[/C][C]10.1190228291045[/C][C]0.282977170895538[/C][/ROW]
[ROW][C]40[/C][C]9.701[/C][C]10.1595666349266[/C][C]-0.458566634926605[/C][/ROW]
[ROW][C]41[/C][C]10.54[/C][C]10.0938650924872[/C][C]0.446134907512807[/C][/ROW]
[ROW][C]42[/C][C]10.112[/C][C]10.1577854681254[/C][C]-0.0457854681253966[/C][/ROW]
[ROW][C]43[/C][C]10.915[/C][C]10.151225514461[/C][C]0.763774485538983[/C][/ROW]
[ROW][C]44[/C][C]11.183[/C][C]10.2606559831296[/C][C]0.92234401687043[/C][/ROW]
[ROW][C]45[/C][C]10.384[/C][C]10.3928056424214[/C][C]-0.00880564242139847[/C][/ROW]
[ROW][C]46[/C][C]10.834[/C][C]10.3915440061723[/C][C]0.442455993827711[/C][/ROW]
[ROW][C]47[/C][C]9.886[/C][C]10.4549372821805[/C][C]-0.568937282180467[/C][/ROW]
[ROW][C]48[/C][C]10.216[/C][C]10.3734222870991[/C][C]-0.157422287099051[/C][/ROW]
[ROW][C]49[/C][C]10.943[/C][C]10.3508674689135[/C][C]0.59213253108654[/C][/ROW]
[ROW][C]50[/C][C]9.867[/C][C]10.4357057839103[/C][C]-0.568705783910287[/C][/ROW]
[ROW][C]51[/C][C]10.203[/C][C]10.3542239569494[/C][C]-0.151223956949412[/C][/ROW]
[ROW][C]52[/C][C]10.837[/C][C]10.3325572100284[/C][C]0.504442789971584[/C][/ROW]
[ROW][C]53[/C][C]10.573[/C][C]10.4048316993813[/C][C]0.168168300618738[/C][/ROW]
[ROW][C]54[/C][C]10.647[/C][C]10.4289261622107[/C][C]0.218073837789285[/C][/ROW]
[ROW][C]55[/C][C]11.502[/C][C]10.4601708852611[/C][C]1.04182911473888[/C][/ROW]
[ROW][C]56[/C][C]10.656[/C][C]10.6094398782126[/C][C]0.0465601217874241[/C][/ROW]
[ROW][C]57[/C][C]10.866[/C][C]10.6161108210693[/C][C]0.249889178930689[/C][/ROW]
[ROW][C]58[/C][C]10.835[/C][C]10.6519139154163[/C][C]0.183086084583687[/C][/ROW]
[ROW][C]59[/C][C]9.945[/C][C]10.6781457370103[/C][C]-0.733145737010283[/C][/ROW]
[ROW][C]60[/C][C]10.331[/C][C]10.5731036295265[/C][C]-0.24210362952646[/C][/ROW]
[/TABLE]
Source: https://freestatistics.org/blog/index.php?pk=147358&T=2

Globally Unique Identifier (entire table): ba.freestatistics.org/blog/index.php?pk=147358&T=2

As an alternative you can also use a QR Code:  

The GUIDs for individual cells are displayed in the table below:

Interpolation Forecasts of Exponential Smoothing
tObservedFittedResiduals
29.1259.829-0.704
39.7829.72813377390670.0538662260932909
49.4419.73585150535546-0.294851505355457
59.1629.69360639370328-0.531606393703282
69.9159.617440014868180.297559985131823
710.4449.660073186369060.78392681363094
810.2099.77239099776720.436609002232798
99.9859.834946540854670.150053459145326
109.8429.85644558366182-0.0144455836618214
119.4299.85437587981568-0.425375879815681
1210.1329.793429772332550.338570227667445
139.8499.841938722804660.00706127719534067
149.1729.84295043357468-0.670950433574676
1510.3139.746819413503180.566180586496822
169.8199.82793944055889-0.00893944055888873
179.9559.826658634262640.128341365737361
1810.0489.84504685757740.202953142422608
1910.0829.874125149551740.207874850448258
2010.5419.903908603620530.637091396379475
2110.2089.995188440025790.212811559974215
2210.23310.02567920554230.207320794457702
239.43910.0553832767463-0.616383276746291
249.9639.96707041459797-0.00407041459797419
2510.1589.966487222326480.191512777673521
269.2259.99392638586706-0.768926385867063
2710.4749.883757774097230.590242225902772
289.7579.96832525393773-0.211325253937735
2910.499.938047440240430.551952559759574
3010.28110.01712893411180.263871065888154
3110.44410.05493529574730.389064704252711
3210.6410.11067888725880.529321112741243
3310.69510.18651784043160.508482159568359
3410.78610.25937107405580.526628925944173
359.83210.3348243017711-0.502824301771097
369.74710.2627817027546-0.515781702754557
3710.41110.18888262058860.222117379411385
389.51110.220706685661-0.709706685660999
3910.40210.11902282910450.282977170895538
409.70110.1595666349266-0.458566634926605
4110.5410.09386509248720.446134907512807
4210.11210.1577854681254-0.0457854681253966
4310.91510.1512255144610.763774485538983
4411.18310.26065598312960.92234401687043
4510.38410.3928056424214-0.00880564242139847
4610.83410.39154400617230.442455993827711
479.88610.4549372821805-0.568937282180467
4810.21610.3734222870991-0.157422287099051
4910.94310.35086746891350.59213253108654
509.86710.4357057839103-0.568705783910287
5110.20310.3542239569494-0.151223956949412
5210.83710.33255721002840.504442789971584
5310.57310.40483169938130.168168300618738
5410.64710.42892616221070.218073837789285
5511.50210.46017088526111.04182911473888
5610.65610.60943987821260.0465601217874241
5710.86610.61611082106930.249889178930689
5810.83510.65191391541630.183086084583687
599.94510.6781457370103-0.733145737010283
6010.33110.5731036295265-0.24210362952646


Extrapolation Forecasts of Exponential Smoothing
tForecast95% Lower Bound95% Upper Bound
6110.53841601669439.6423996351853811.4344323982033
6210.53841601669439.6332496509274311.4435823824612
6310.53841601669439.6241912393562211.4526407940324
6410.53841601669439.6152217049255811.4616103284631
6510.53841601669439.6063384817942411.4704935515944
6610.53841601669439.597539125252811.4792929081359
6710.53841601669439.5888213038657711.4880107295229
6810.53841601669439.5801827922571911.4966492411315
6910.53841601669439.571621464476311.5052105689124
7010.53841601669439.5631352878876311.513696745501
7110.53841601669439.554722317535411.5221097158533
7210.53841601669439.5463806909381211.5304513424505

\begin{tabular}{lllllllll}
\hline
Extrapolation Forecasts of Exponential Smoothing \tabularnewline
t & Forecast & 95% Lower Bound & 95% Upper Bound \tabularnewline
61 & 10.5384160166943 & 9.64239963518538 & 11.4344323982033 \tabularnewline
62 & 10.5384160166943 & 9.63324965092743 & 11.4435823824612 \tabularnewline
63 & 10.5384160166943 & 9.62419123935622 & 11.4526407940324 \tabularnewline
64 & 10.5384160166943 & 9.61522170492558 & 11.4616103284631 \tabularnewline
65 & 10.5384160166943 & 9.60633848179424 & 11.4704935515944 \tabularnewline
66 & 10.5384160166943 & 9.5975391252528 & 11.4792929081359 \tabularnewline
67 & 10.5384160166943 & 9.58882130386577 & 11.4880107295229 \tabularnewline
68 & 10.5384160166943 & 9.58018279225719 & 11.4966492411315 \tabularnewline
69 & 10.5384160166943 & 9.5716214644763 & 11.5052105689124 \tabularnewline
70 & 10.5384160166943 & 9.56313528788763 & 11.513696745501 \tabularnewline
71 & 10.5384160166943 & 9.5547223175354 & 11.5221097158533 \tabularnewline
72 & 10.5384160166943 & 9.54638069093812 & 11.5304513424505 \tabularnewline
\hline
\end{tabular}
%Source: https://freestatistics.org/blog/index.php?pk=147358&T=3

[TABLE]
[ROW][C]Extrapolation Forecasts of Exponential Smoothing[/C][/ROW]
[ROW][C]t[/C][C]Forecast[/C][C]95% Lower Bound[/C][C]95% Upper Bound[/C][/ROW]
[ROW][C]61[/C][C]10.5384160166943[/C][C]9.64239963518538[/C][C]11.4344323982033[/C][/ROW]
[ROW][C]62[/C][C]10.5384160166943[/C][C]9.63324965092743[/C][C]11.4435823824612[/C][/ROW]
[ROW][C]63[/C][C]10.5384160166943[/C][C]9.62419123935622[/C][C]11.4526407940324[/C][/ROW]
[ROW][C]64[/C][C]10.5384160166943[/C][C]9.61522170492558[/C][C]11.4616103284631[/C][/ROW]
[ROW][C]65[/C][C]10.5384160166943[/C][C]9.60633848179424[/C][C]11.4704935515944[/C][/ROW]
[ROW][C]66[/C][C]10.5384160166943[/C][C]9.5975391252528[/C][C]11.4792929081359[/C][/ROW]
[ROW][C]67[/C][C]10.5384160166943[/C][C]9.58882130386577[/C][C]11.4880107295229[/C][/ROW]
[ROW][C]68[/C][C]10.5384160166943[/C][C]9.58018279225719[/C][C]11.4966492411315[/C][/ROW]
[ROW][C]69[/C][C]10.5384160166943[/C][C]9.5716214644763[/C][C]11.5052105689124[/C][/ROW]
[ROW][C]70[/C][C]10.5384160166943[/C][C]9.56313528788763[/C][C]11.513696745501[/C][/ROW]
[ROW][C]71[/C][C]10.5384160166943[/C][C]9.5547223175354[/C][C]11.5221097158533[/C][/ROW]
[ROW][C]72[/C][C]10.5384160166943[/C][C]9.54638069093812[/C][C]11.5304513424505[/C][/ROW]
[/TABLE]
Source: https://freestatistics.org/blog/index.php?pk=147358&T=3

Globally Unique Identifier (entire table): ba.freestatistics.org/blog/index.php?pk=147358&T=3

As an alternative you can also use a QR Code:  

The GUIDs for individual cells are displayed in the table below:

Extrapolation Forecasts of Exponential Smoothing
tForecast95% Lower Bound95% Upper Bound
6110.53841601669439.6423996351853811.4344323982033
6210.53841601669439.6332496509274311.4435823824612
6310.53841601669439.6241912393562211.4526407940324
6410.53841601669439.6152217049255811.4616103284631
6510.53841601669439.6063384817942411.4704935515944
6610.53841601669439.597539125252811.4792929081359
6710.53841601669439.5888213038657711.4880107295229
6810.53841601669439.5801827922571911.4966492411315
6910.53841601669439.571621464476311.5052105689124
7010.53841601669439.5631352878876311.513696745501
7110.53841601669439.554722317535411.5221097158533
7210.53841601669439.5463806909381211.5304513424505


Parameters (Session):
par1 = 12 ;
Parameters (R input):
par1 = 12 ; par2 = Single ; par3 = additive ;
R code (references can be found in the software module):
par1 <- as.numeric(par1)
if (par2 == 'Single') K <- 1
if (par2 == 'Double') K <- 2
if (par2 == 'Triple') K <- par1
nx <- length(x)
nxmK <- nx - K
x <- ts(x, frequency = par1)
if (par2 == 'Single') fit <- HoltWinters(x, gamma=F, beta=F)
if (par2 == 'Double') fit <- HoltWinters(x, gamma=F)
if (par2 == 'Triple') fit <- HoltWinters(x, seasonal=par3)
fit
myresid <- x - fit$fitted[,'xhat']
bitmap(file='test1.png')
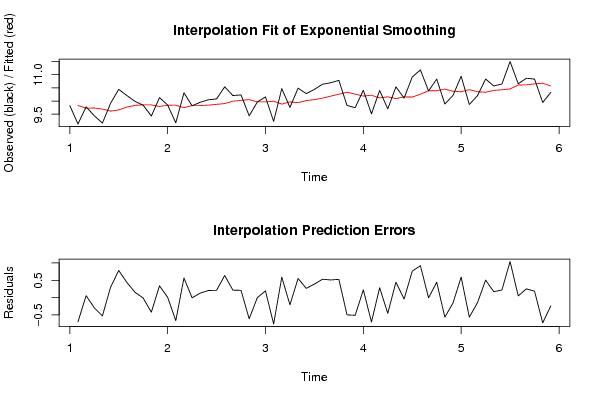
op <- par(mfrow=c(2,1))
plot(fit,ylab='Observed (black) / Fitted (red)',main='Interpolation Fit of Exponential Smoothing')
plot(myresid,ylab='Residuals',main='Interpolation Prediction Errors')
par(op)
dev.off()
bitmap(file='test2.png')
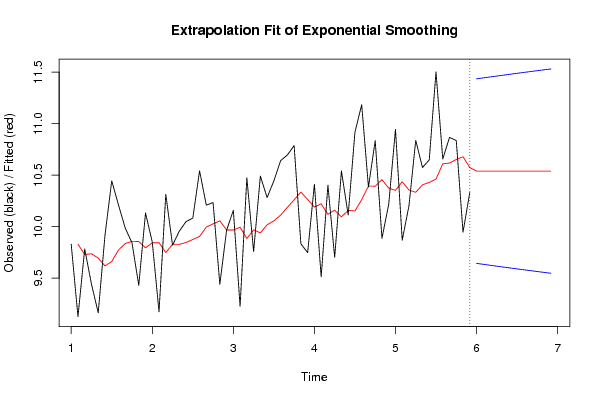
p <- predict(fit, par1, prediction.interval=TRUE)
np <- length(p[,1])
plot(fit,p,ylab='Observed (black) / Fitted (red)',main='Extrapolation Fit of Exponential Smoothing')
dev.off()
bitmap(file='test3.png')
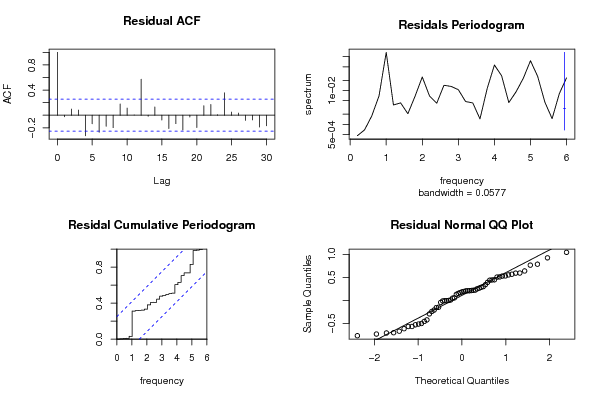
op <- par(mfrow = c(2,2))
acf(as.numeric(myresid),lag.max = nx/2,main='Residual ACF')
spectrum(myresid,main='Residals Periodogram')
cpgram(myresid,main='Residal Cumulative Periodogram')
qqnorm(myresid,main='Residual Normal QQ Plot')
qqline(myresid)
par(op)
dev.off()
load(file='createtable')
a<-table.start()
a<-table.row.start(a)
a<-table.element(a,'Estimated Parameters of Exponential Smoothing',2,TRUE)
a<-table.row.end(a)
a<-table.row.start(a)
a<-table.element(a,'Parameter',header=TRUE)
a<-table.element(a,'Value',header=TRUE)
a<-table.row.end(a)
a<-table.row.start(a)
a<-table.element(a,'alpha',header=TRUE)
a<-table.element(a,fit$alpha)
a<-table.row.end(a)
a<-table.row.start(a)
a<-table.element(a,'beta',header=TRUE)
a<-table.element(a,fit$beta)
a<-table.row.end(a)
a<-table.row.start(a)
a<-table.element(a,'gamma',header=TRUE)
a<-table.element(a,fit$gamma)
a<-table.row.end(a)
a<-table.end(a)
table.save(a,file='mytable.tab')
a<-table.start()
a<-table.row.start(a)
a<-table.element(a,'Interpolation Forecasts of Exponential Smoothing',4,TRUE)
a<-table.row.end(a)
a<-table.row.start(a)
a<-table.element(a,'t',header=TRUE)
a<-table.element(a,'Observed',header=TRUE)
a<-table.element(a,'Fitted',header=TRUE)
a<-table.element(a,'Residuals',header=TRUE)
a<-table.row.end(a)
for (i in 1:nxmK) {
a<-table.row.start(a)
a<-table.element(a,i+K,header=TRUE)
a<-table.element(a,x[i+K])
a<-table.element(a,fit$fitted[i,'xhat'])
a<-table.element(a,myresid[i])
a<-table.row.end(a)
}
a<-table.end(a)
table.save(a,file='mytable1.tab')
a<-table.start()
a<-table.row.start(a)
a<-table.element(a,'Extrapolation Forecasts of Exponential Smoothing',4,TRUE)
a<-table.row.end(a)
a<-table.row.start(a)
a<-table.element(a,'t',header=TRUE)
a<-table.element(a,'Forecast',header=TRUE)
a<-table.element(a,'95% Lower Bound',header=TRUE)
a<-table.element(a,'95% Upper Bound',header=TRUE)
a<-table.row.end(a)
for (i in 1:np) {
a<-table.row.start(a)
a<-table.element(a,nx+i,header=TRUE)
a<-table.element(a,p[i,'fit'])
a<-table.element(a,p[i,'lwr'])
a<-table.element(a,p[i,'upr'])
a<-table.row.end(a)
}
a<-table.end(a)
table.save(a,file='mytable2.tab')