| Multiple Linear Regression - Estimated Regression Equation |
| Births[t] = + 9.470475 + 0.345771527777781M1[t] -0.529098611111111M2[t] + 0.30883125M3[t] -0.0318388888888881M4[t] + 0.184290972222223M5[t] + 0.224020833333334M6[t] + 0.683950694444445M7[t] + 0.635480555555556M8[t] + 0.400410416666667M9[t] + 0.461940277777779M10[t] -0.354729861111111M11[t] + 0.0168701388888889t + e[t] |
| Multiple Linear Regression - Ordinary Least Squares | |||||
| Variable | Parameter | S.D. | T-STAT H0: parameter = 0 | 2-tail p-value | 1-tail p-value |
| (Intercept) | 9.470475 | 0.133009 | 71.2016 | 0 | 0 |
| M1 | 0.345771527777781 | 0.161813 | 2.1369 | 0.037845 | 0.018922 |
| M2 | -0.529098611111111 | 0.161571 | -3.2747 | 0.00199 | 0.000995 |
| M3 | 0.30883125 | 0.161352 | 1.914 | 0.061718 | 0.030859 |
| M4 | -0.0318388888888881 | 0.161156 | -0.1976 | 0.844237 | 0.422119 |
| M5 | 0.184290972222223 | 0.160983 | 1.1448 | 0.258094 | 0.129047 |
| M6 | 0.224020833333334 | 0.160832 | 1.3929 | 0.170209 | 0.085105 |
| M7 | 0.683950694444445 | 0.160705 | 4.2559 | 9.9e-05 | 4.9e-05 |
| M8 | 0.635480555555556 | 0.160601 | 3.9569 | 0.000255 | 0.000128 |
| M9 | 0.400410416666667 | 0.16052 | 2.4945 | 0.016188 | 0.008094 |
| M10 | 0.461940277777779 | 0.160462 | 2.8788 | 0.00599 | 0.002995 |
| M11 | -0.354729861111111 | 0.160427 | -2.2112 | 0.031925 | 0.015963 |
| t | 0.0168701388888889 | 0.001929 | 8.7433 | 0 | 0 |
| Multiple Linear Regression - Regression Statistics | |
| Multiple R | 0.899762836842612 |
| R-squared | 0.809573162563065 |
| Adjusted R-squared | 0.76095354449406 |
| F-TEST (value) | 16.6511625289622 |
| F-TEST (DF numerator) | 12 |
| F-TEST (DF denominator) | 47 |
| p-value | 4.67736960274578e-13 |
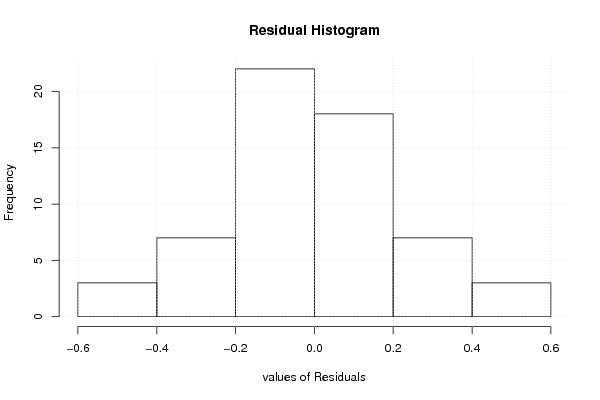
| Multiple Linear Regression - Residual Statistics | |
| Residual Standard Deviation | 0.253638769423387 |
| Sum Squared Residuals | 3.02363339166666 |
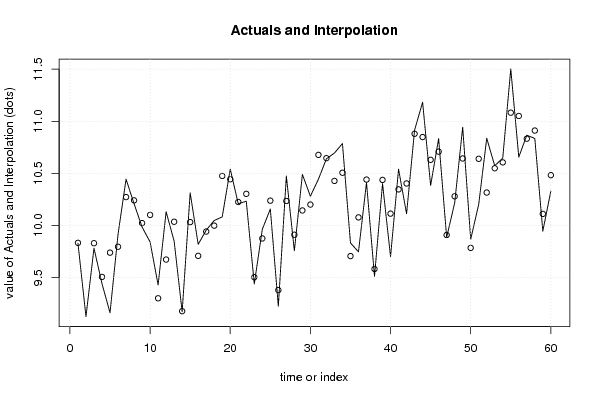
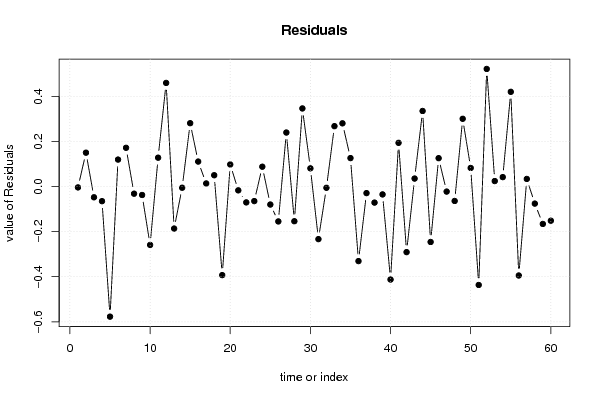
| Multiple Linear Regression - Actuals, Interpolation, and Residuals | |||
| Time or Index | Actuals | Interpolation Forecast | Residuals Prediction Error |
| 1 | 9.829 | 9.83311666666666 | -0.00411666666665606 |
| 2 | 9.125 | 8.97511666666667 | 0.149883333333333 |
| 3 | 9.782 | 9.82991666666667 | -0.0479166666666673 |
| 4 | 9.441 | 9.50611666666667 | -0.0651166666666668 |
| 5 | 9.162 | 9.73911666666667 | -0.577116666666667 |
| 6 | 9.915 | 9.79571666666667 | 0.119283333333332 |
| 7 | 10.444 | 10.2725166666667 | 0.171483333333333 |
| 8 | 10.209 | 10.2409166666667 | -0.0319166666666677 |
| 9 | 9.985 | 10.0227166666667 | -0.0377166666666679 |
| 10 | 9.842 | 10.1011166666667 | -0.259116666666667 |
| 11 | 9.429 | 9.30131666666667 | 0.127683333333333 |
| 12 | 10.132 | 9.67291666666667 | 0.459083333333333 |
| 13 | 9.849 | 10.0355583333333 | -0.186558333333336 |
| 14 | 9.172 | 9.17755833333333 | -0.00555833333333307 |
| 15 | 10.313 | 10.0323583333333 | 0.280641666666667 |
| 16 | 9.819 | 9.70855833333333 | 0.110441666666667 |
| 17 | 9.955 | 9.94155833333333 | 0.0134416666666663 |
| 18 | 10.048 | 9.99815833333333 | 0.0498416666666664 |
| 19 | 10.082 | 10.4749583333333 | -0.392958333333333 |
| 20 | 10.541 | 10.4433583333333 | 0.0976416666666666 |
| 21 | 10.208 | 10.2251583333333 | -0.0171583333333334 |
| 22 | 10.233 | 10.3035583333333 | -0.0705583333333334 |
| 23 | 9.439 | 9.50375833333333 | -0.0647583333333336 |
| 24 | 9.963 | 9.87535833333333 | 0.0876416666666661 |
| 25 | 10.158 | 10.238 | -0.0800000000000031 |
| 26 | 9.225 | 9.38 | -0.155 |
| 27 | 10.474 | 10.2348 | 0.2392 |
| 28 | 9.757 | 9.911 | -0.154000000000001 |
| 29 | 10.49 | 10.144 | 0.346 |
| 30 | 10.281 | 10.2006 | 0.0804000000000006 |
| 31 | 10.444 | 10.6774 | -0.2334 |
| 32 | 10.64 | 10.6458 | -0.00579999999999958 |
| 33 | 10.695 | 10.4276 | 0.2674 |
| 34 | 10.786 | 10.506 | 0.279999999999999 |
| 35 | 9.832 | 9.7062 | 0.125800000000001 |
| 36 | 9.747 | 10.0778 | -0.3308 |
| 37 | 10.411 | 10.4404416666667 | -0.0294416666666694 |
| 38 | 9.511 | 9.58244166666667 | -0.0714416666666671 |
| 39 | 10.402 | 10.4372416666667 | -0.035241666666667 |
| 40 | 9.701 | 10.1134416666667 | -0.412441666666666 |
| 41 | 10.54 | 10.3464416666667 | 0.193558333333333 |
| 42 | 10.112 | 10.4030416666667 | -0.291041666666666 |
| 43 | 10.915 | 10.8798416666667 | 0.0351583333333324 |
| 44 | 11.183 | 10.8482416666667 | 0.334758333333333 |
| 45 | 10.384 | 10.6300416666667 | -0.246041666666666 |
| 46 | 10.834 | 10.7084416666667 | 0.125558333333333 |
| 47 | 9.886 | 9.90864166666667 | -0.0226416666666673 |
| 48 | 10.216 | 10.2802416666667 | -0.0642416666666665 |
| 49 | 10.943 | 10.6428833333333 | 0.300116666666664 |
| 50 | 9.867 | 9.78488333333333 | 0.082116666666668 |
| 51 | 10.203 | 10.6396833333333 | -0.436683333333333 |
| 52 | 10.837 | 10.3158833333333 | 0.521116666666667 |
| 53 | 10.573 | 10.5488833333333 | 0.0241166666666674 |
| 54 | 10.647 | 10.6054833333333 | 0.0415166666666676 |
| 55 | 11.502 | 11.0822833333333 | 0.419716666666667 |
| 56 | 10.656 | 11.0506833333333 | -0.394683333333332 |
| 57 | 10.866 | 10.8324833333333 | 0.0335166666666669 |
| 58 | 10.835 | 10.9108833333333 | -0.075883333333332 |
| 59 | 9.945 | 10.1110833333333 | -0.166083333333333 |
| 60 | 10.331 | 10.4826833333333 | -0.151683333333333 |
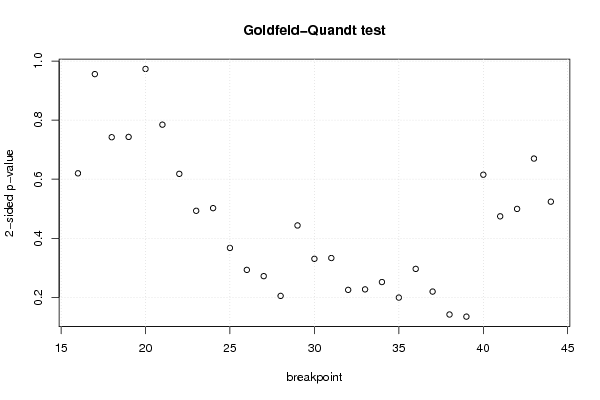
| Goldfeld-Quandt test for Heteroskedasticity | |||
| p-values | Alternative Hypothesis | ||
| breakpoint index | greater | 2-sided | less |
| 16 | 0.309988850485689 | 0.619977700971378 | 0.690011149514311 |
| 17 | 0.477948720221301 | 0.955897440442602 | 0.522051279778699 |
| 18 | 0.371100037986032 | 0.742200075972064 | 0.628899962013968 |
| 19 | 0.628397484929692 | 0.743205030140616 | 0.371602515070308 |
| 20 | 0.513322560372693 | 0.973354879254613 | 0.486677439627307 |
| 21 | 0.392334654513498 | 0.784669309026997 | 0.607665345486502 |
| 22 | 0.30908114178231 | 0.61816228356462 | 0.69091885821769 |
| 23 | 0.246514446531129 | 0.493028893062258 | 0.753485553468871 |
| 24 | 0.25103494429906 | 0.50206988859812 | 0.74896505570094 |
| 25 | 0.183626481168566 | 0.367252962337133 | 0.816373518831434 |
| 26 | 0.146481877681542 | 0.292963755363084 | 0.853518122318458 |
| 27 | 0.135904504579545 | 0.271809009159089 | 0.864095495420455 |
| 28 | 0.102466653221412 | 0.204933306442823 | 0.897533346778588 |
| 29 | 0.22171031064306 | 0.443420621286121 | 0.77828968935694 |
| 30 | 0.165215951562832 | 0.330431903125663 | 0.834784048437168 |
| 31 | 0.166585051503444 | 0.333170103006888 | 0.833414948496556 |
| 32 | 0.112670812278089 | 0.225341624556177 | 0.887329187721911 |
| 33 | 0.113524839048696 | 0.227049678097393 | 0.886475160951304 |
| 34 | 0.125927266126425 | 0.251854532252851 | 0.874072733873575 |
| 35 | 0.099610094985634 | 0.199220189971268 | 0.900389905014366 |
| 36 | 0.148174827387603 | 0.296349654775205 | 0.851825172612397 |
| 37 | 0.109797571156855 | 0.21959514231371 | 0.890202428843145 |
| 38 | 0.0709447556203267 | 0.141889511240653 | 0.929055244379673 |
| 39 | 0.0673152608974471 | 0.134630521794894 | 0.932684739102553 |
| 40 | 0.307583390324132 | 0.615166780648264 | 0.692416609675868 |
| 41 | 0.237171111866796 | 0.474342223733593 | 0.762828888133204 |
| 42 | 0.24971138544553 | 0.499422770891061 | 0.75028861455447 |
| 43 | 0.334939765727473 | 0.669879531454946 | 0.665060234272527 |
| 44 | 0.738071740967669 | 0.523856518064662 | 0.261928259032331 |
| Meta Analysis of Goldfeld-Quandt test for Heteroskedasticity | |||
| Description | # significant tests | % significant tests | OK/NOK |
| 1% type I error level | 0 | 0 | OK |
| 5% type I error level | 0 | 0 | OK |
| 10% type I error level | 0 | 0 | OK |