Free Statistics

of Irreproducible Research!

Author's title

Author*The author of this computation has been verified*
R Software Modulerwasp_exponentialsmoothing.wasp
Title produced by softwareExponential Smoothing
Date of computationFri, 25 Nov 2011 12:03:34 -0500
Cite this page as followsStatistical Computations at FreeStatistics.org, Office for Research Development and Education, URL https://freestatistics.org/blog/index.php?v=date/2011/Nov/25/t1322240632pahxoppdqmmm9mi.htm/, Retrieved Thu, 18 Apr 2024 22:44:05 +0000
Statistical Computations at FreeStatistics.org, Office for Research Development and Education, URL https://freestatistics.org/blog/index.php?pk=147342, Retrieved Thu, 18 Apr 2024 22:44:05 +0000
QR Codes:

Original text written by user:
IsPrivate?No (this computation is public)
User-defined keywords
Estimated Impact206
Family? (F = Feedback message, R = changed R code, M = changed R Module, P = changed Parameters, D = changed Data)
-     [Multiple Regression] [Q1 The Seatbeltlaw] [2007-11-14 19:27:43] [8cd6641b921d30ebe00b648d1481bba0]
-  M D  [Multiple Regression] [Workshop 8, Multi...] [2010-11-29 10:32:18] [d946de7cca328fbcf207448a112523ab]
-         [Multiple Regression] [Workshop 8, Multi...] [2010-11-29 20:25:47] [3635fb7041b1998c5a1332cf9de22bce]
-    D      [Multiple Regression] [Workshop 8, Multi...] [2010-11-29 20:46:24] [3635fb7041b1998c5a1332cf9de22bce]
- RM D          [Exponential Smoothing] [] [2011-11-25 17:03:34] [f8ac047da1b1db86cbd9837decfb2b34] [Current]
- R PD            [Exponential Smoothing] [] [2011-12-09 17:07:28] [b1eb71d4db1ceb5d347df987feb4a25e]
Feedback Forum

Post a new message
Dataseries X:
9911
8915
9452
9112
8472
8230
8384
8625
8221
8649
8625
10443
10357
8586
8892
8329
8101
7922
8120
7838
7735
8406
8209
9451
10041
9411
10405
8467
8464
8102
7627
7513
7510
8291
8064
9383
9706
8579
9474
8318
8213
8059
9111
7708
7680
8014
8007
8718
9486
9113
9025
8476
7952
7759
7835
7600
7651
8319
8812
8630


Summary of computational transaction
Raw Inputview raw input (R code)
Raw Outputview raw output of R engine
Computing time1 seconds
R Server'Gwilym Jenkins' @ jenkins.wessa.net

\begin{tabular}{lllllllll}
\hline
Summary of computational transaction \tabularnewline
Raw Input & view raw input (R code)  \tabularnewline
Raw Output & view raw output of R engine  \tabularnewline
Computing time & 1 seconds \tabularnewline
R Server & 'Gwilym Jenkins' @ jenkins.wessa.net \tabularnewline
\hline
\end{tabular}
%Source: https://freestatistics.org/blog/index.php?pk=147342&T=0

[TABLE]
[ROW][C]Summary of computational transaction[/C][/ROW]
[ROW][C]Raw Input[/C][C]view raw input (R code) [/C][/ROW]
[ROW][C]Raw Output[/C][C]view raw output of R engine [/C][/ROW]
[ROW][C]Computing time[/C][C]1 seconds[/C][/ROW]
[ROW][C]R Server[/C][C]'Gwilym Jenkins' @ jenkins.wessa.net[/C][/ROW]
[/TABLE]
Source: https://freestatistics.org/blog/index.php?pk=147342&T=0

Globally Unique Identifier (entire table): ba.freestatistics.org/blog/index.php?pk=147342&T=0

As an alternative you can also use a QR Code:  

The GUIDs for individual cells are displayed in the table below:

Summary of computational transaction
Raw Inputview raw input (R code)
Raw Outputview raw output of R engine
Computing time1 seconds
R Server'Gwilym Jenkins' @ jenkins.wessa.net


Estimated Parameters of Exponential Smoothing
ParameterValue
alpha0.782582633269772
betaFALSE
gammaFALSE

\begin{tabular}{lllllllll}
\hline
Estimated Parameters of Exponential Smoothing \tabularnewline
Parameter & Value \tabularnewline
alpha & 0.782582633269772 \tabularnewline
beta & FALSE \tabularnewline
gamma & FALSE \tabularnewline
\hline
\end{tabular}
%Source: https://freestatistics.org/blog/index.php?pk=147342&T=1

[TABLE]
[ROW][C]Estimated Parameters of Exponential Smoothing[/C][/ROW]
[ROW][C]Parameter[/C][C]Value[/C][/ROW]
[ROW][C]alpha[/C][C]0.782582633269772[/C][/ROW]
[ROW][C]beta[/C][C]FALSE[/C][/ROW]
[ROW][C]gamma[/C][C]FALSE[/C][/ROW]
[/TABLE]
Source: https://freestatistics.org/blog/index.php?pk=147342&T=1

Globally Unique Identifier (entire table): ba.freestatistics.org/blog/index.php?pk=147342&T=1

As an alternative you can also use a QR Code:  

The GUIDs for individual cells are displayed in the table below:

Estimated Parameters of Exponential Smoothing
ParameterValue
alpha0.782582633269772
betaFALSE
gammaFALSE


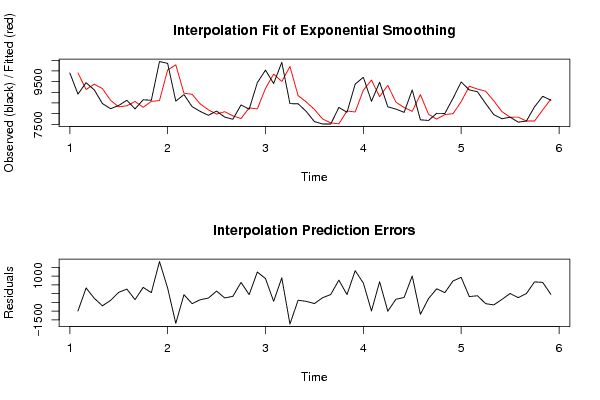
Interpolation Forecasts of Exponential Smoothing
tObservedFittedResiduals
289159911-996
394529131.54769726331320.452302736692
491129382.32810417635-270.328104176351
584729170.7740245632-698.774024563198
682308623.92560836001-393.925608360014
783848315.6462684572468.353731542762
886258369.13871168179255.861288318212
982218569.37131244565-348.37131244565
1086498296.74197339629352.258026603713
1186258572.4129874462352.5870125537658
12104438613.566670206351829.43332979365
131035710045.2494228278311.750577172248
14858610289.2200104346-1703.22001043458
1588928956.30960963092-64.3096096309182
1683298905.9820259814-576.982025981402
1781018454.44591273955-353.445912739549
1879228177.8452796294-255.845279629395
1981207977.62520698738142.374793012618
2078388089.04524741443-251.045247414435
2177357892.58159662298-157.581596622985
2284067769.26097578291636.739024217086
2382098267.56187806035-58.5618780603454
2494518221.732369318661229.26763068134
25100419183.73586873056857.264131269445
2694119854.61588998712-443.615889987121
27104059507.44979864069897.550201359314
28846710209.8569987123-1742.85699871227
2984648845.92737924737-381.92737924737
3081028547.03764507814-445.03764507814
3176278198.75891288871-571.758912888712
3275137751.3103172448-238.310317244802
3375107564.81280164001-54.8128016400105
3482917521.91725499568769.082745004323
3580648123.7880547835-59.7880547835048
3693838076.998961432951306.00103856705
3797069099.05269324781606.94730675219
3885799574.03911482194-995.039114821935
3994748795.33878413816678.661215861837
4083189326.44726554538-1008.44726554538
4182138537.25394896118-324.253948961177
4280598283.49843973502-224.498439735016
4391118107.809859602231003.19014039777
4477088892.88904134499-1184.88904134499
4576807965.61545523673-285.615455236732
4680147742.09776017503271.902239824974
4780077954.883731009252.1162689907969
4887187995.66901803222722.330981967783
4994868560.9526999929925.047300007096
5091139284.87865193155-171.878651931549
5190259150.3694039001-125.369403900098
5284769052.2574856645-576.257485664497
5379528601.28838509176-649.288385091757
5477598093.16657093517-334.166570935172
5578357831.6536159023.34638409800482
5676007834.27243798134-234.272437981344
5776517650.934896563370.0651034366255772
5883197650.98584538224668.014154617757
5988128173.76212156449638.237878435512
6086308673.23600112306-43.236001123063

\begin{tabular}{lllllllll}
\hline
Interpolation Forecasts of Exponential Smoothing \tabularnewline
t & Observed & Fitted & Residuals \tabularnewline
2 & 8915 & 9911 & -996 \tabularnewline
3 & 9452 & 9131.54769726331 & 320.452302736692 \tabularnewline
4 & 9112 & 9382.32810417635 & -270.328104176351 \tabularnewline
5 & 8472 & 9170.7740245632 & -698.774024563198 \tabularnewline
6 & 8230 & 8623.92560836001 & -393.925608360014 \tabularnewline
7 & 8384 & 8315.64626845724 & 68.353731542762 \tabularnewline
8 & 8625 & 8369.13871168179 & 255.861288318212 \tabularnewline
9 & 8221 & 8569.37131244565 & -348.37131244565 \tabularnewline
10 & 8649 & 8296.74197339629 & 352.258026603713 \tabularnewline
11 & 8625 & 8572.41298744623 & 52.5870125537658 \tabularnewline
12 & 10443 & 8613.56667020635 & 1829.43332979365 \tabularnewline
13 & 10357 & 10045.2494228278 & 311.750577172248 \tabularnewline
14 & 8586 & 10289.2200104346 & -1703.22001043458 \tabularnewline
15 & 8892 & 8956.30960963092 & -64.3096096309182 \tabularnewline
16 & 8329 & 8905.9820259814 & -576.982025981402 \tabularnewline
17 & 8101 & 8454.44591273955 & -353.445912739549 \tabularnewline
18 & 7922 & 8177.8452796294 & -255.845279629395 \tabularnewline
19 & 8120 & 7977.62520698738 & 142.374793012618 \tabularnewline
20 & 7838 & 8089.04524741443 & -251.045247414435 \tabularnewline
21 & 7735 & 7892.58159662298 & -157.581596622985 \tabularnewline
22 & 8406 & 7769.26097578291 & 636.739024217086 \tabularnewline
23 & 8209 & 8267.56187806035 & -58.5618780603454 \tabularnewline
24 & 9451 & 8221.73236931866 & 1229.26763068134 \tabularnewline
25 & 10041 & 9183.73586873056 & 857.264131269445 \tabularnewline
26 & 9411 & 9854.61588998712 & -443.615889987121 \tabularnewline
27 & 10405 & 9507.44979864069 & 897.550201359314 \tabularnewline
28 & 8467 & 10209.8569987123 & -1742.85699871227 \tabularnewline
29 & 8464 & 8845.92737924737 & -381.92737924737 \tabularnewline
30 & 8102 & 8547.03764507814 & -445.03764507814 \tabularnewline
31 & 7627 & 8198.75891288871 & -571.758912888712 \tabularnewline
32 & 7513 & 7751.3103172448 & -238.310317244802 \tabularnewline
33 & 7510 & 7564.81280164001 & -54.8128016400105 \tabularnewline
34 & 8291 & 7521.91725499568 & 769.082745004323 \tabularnewline
35 & 8064 & 8123.7880547835 & -59.7880547835048 \tabularnewline
36 & 9383 & 8076.99896143295 & 1306.00103856705 \tabularnewline
37 & 9706 & 9099.05269324781 & 606.94730675219 \tabularnewline
38 & 8579 & 9574.03911482194 & -995.039114821935 \tabularnewline
39 & 9474 & 8795.33878413816 & 678.661215861837 \tabularnewline
40 & 8318 & 9326.44726554538 & -1008.44726554538 \tabularnewline
41 & 8213 & 8537.25394896118 & -324.253948961177 \tabularnewline
42 & 8059 & 8283.49843973502 & -224.498439735016 \tabularnewline
43 & 9111 & 8107.80985960223 & 1003.19014039777 \tabularnewline
44 & 7708 & 8892.88904134499 & -1184.88904134499 \tabularnewline
45 & 7680 & 7965.61545523673 & -285.615455236732 \tabularnewline
46 & 8014 & 7742.09776017503 & 271.902239824974 \tabularnewline
47 & 8007 & 7954.8837310092 & 52.1162689907969 \tabularnewline
48 & 8718 & 7995.66901803222 & 722.330981967783 \tabularnewline
49 & 9486 & 8560.9526999929 & 925.047300007096 \tabularnewline
50 & 9113 & 9284.87865193155 & -171.878651931549 \tabularnewline
51 & 9025 & 9150.3694039001 & -125.369403900098 \tabularnewline
52 & 8476 & 9052.2574856645 & -576.257485664497 \tabularnewline
53 & 7952 & 8601.28838509176 & -649.288385091757 \tabularnewline
54 & 7759 & 8093.16657093517 & -334.166570935172 \tabularnewline
55 & 7835 & 7831.653615902 & 3.34638409800482 \tabularnewline
56 & 7600 & 7834.27243798134 & -234.272437981344 \tabularnewline
57 & 7651 & 7650.93489656337 & 0.0651034366255772 \tabularnewline
58 & 8319 & 7650.98584538224 & 668.014154617757 \tabularnewline
59 & 8812 & 8173.76212156449 & 638.237878435512 \tabularnewline
60 & 8630 & 8673.23600112306 & -43.236001123063 \tabularnewline
\hline
\end{tabular}
%Source: https://freestatistics.org/blog/index.php?pk=147342&T=2

[TABLE]
[ROW][C]Interpolation Forecasts of Exponential Smoothing[/C][/ROW]
[ROW][C]t[/C][C]Observed[/C][C]Fitted[/C][C]Residuals[/C][/ROW]
[ROW][C]2[/C][C]8915[/C][C]9911[/C][C]-996[/C][/ROW]
[ROW][C]3[/C][C]9452[/C][C]9131.54769726331[/C][C]320.452302736692[/C][/ROW]
[ROW][C]4[/C][C]9112[/C][C]9382.32810417635[/C][C]-270.328104176351[/C][/ROW]
[ROW][C]5[/C][C]8472[/C][C]9170.7740245632[/C][C]-698.774024563198[/C][/ROW]
[ROW][C]6[/C][C]8230[/C][C]8623.92560836001[/C][C]-393.925608360014[/C][/ROW]
[ROW][C]7[/C][C]8384[/C][C]8315.64626845724[/C][C]68.353731542762[/C][/ROW]
[ROW][C]8[/C][C]8625[/C][C]8369.13871168179[/C][C]255.861288318212[/C][/ROW]
[ROW][C]9[/C][C]8221[/C][C]8569.37131244565[/C][C]-348.37131244565[/C][/ROW]
[ROW][C]10[/C][C]8649[/C][C]8296.74197339629[/C][C]352.258026603713[/C][/ROW]
[ROW][C]11[/C][C]8625[/C][C]8572.41298744623[/C][C]52.5870125537658[/C][/ROW]
[ROW][C]12[/C][C]10443[/C][C]8613.56667020635[/C][C]1829.43332979365[/C][/ROW]
[ROW][C]13[/C][C]10357[/C][C]10045.2494228278[/C][C]311.750577172248[/C][/ROW]
[ROW][C]14[/C][C]8586[/C][C]10289.2200104346[/C][C]-1703.22001043458[/C][/ROW]
[ROW][C]15[/C][C]8892[/C][C]8956.30960963092[/C][C]-64.3096096309182[/C][/ROW]
[ROW][C]16[/C][C]8329[/C][C]8905.9820259814[/C][C]-576.982025981402[/C][/ROW]
[ROW][C]17[/C][C]8101[/C][C]8454.44591273955[/C][C]-353.445912739549[/C][/ROW]
[ROW][C]18[/C][C]7922[/C][C]8177.8452796294[/C][C]-255.845279629395[/C][/ROW]
[ROW][C]19[/C][C]8120[/C][C]7977.62520698738[/C][C]142.374793012618[/C][/ROW]
[ROW][C]20[/C][C]7838[/C][C]8089.04524741443[/C][C]-251.045247414435[/C][/ROW]
[ROW][C]21[/C][C]7735[/C][C]7892.58159662298[/C][C]-157.581596622985[/C][/ROW]
[ROW][C]22[/C][C]8406[/C][C]7769.26097578291[/C][C]636.739024217086[/C][/ROW]
[ROW][C]23[/C][C]8209[/C][C]8267.56187806035[/C][C]-58.5618780603454[/C][/ROW]
[ROW][C]24[/C][C]9451[/C][C]8221.73236931866[/C][C]1229.26763068134[/C][/ROW]
[ROW][C]25[/C][C]10041[/C][C]9183.73586873056[/C][C]857.264131269445[/C][/ROW]
[ROW][C]26[/C][C]9411[/C][C]9854.61588998712[/C][C]-443.615889987121[/C][/ROW]
[ROW][C]27[/C][C]10405[/C][C]9507.44979864069[/C][C]897.550201359314[/C][/ROW]
[ROW][C]28[/C][C]8467[/C][C]10209.8569987123[/C][C]-1742.85699871227[/C][/ROW]
[ROW][C]29[/C][C]8464[/C][C]8845.92737924737[/C][C]-381.92737924737[/C][/ROW]
[ROW][C]30[/C][C]8102[/C][C]8547.03764507814[/C][C]-445.03764507814[/C][/ROW]
[ROW][C]31[/C][C]7627[/C][C]8198.75891288871[/C][C]-571.758912888712[/C][/ROW]
[ROW][C]32[/C][C]7513[/C][C]7751.3103172448[/C][C]-238.310317244802[/C][/ROW]
[ROW][C]33[/C][C]7510[/C][C]7564.81280164001[/C][C]-54.8128016400105[/C][/ROW]
[ROW][C]34[/C][C]8291[/C][C]7521.91725499568[/C][C]769.082745004323[/C][/ROW]
[ROW][C]35[/C][C]8064[/C][C]8123.7880547835[/C][C]-59.7880547835048[/C][/ROW]
[ROW][C]36[/C][C]9383[/C][C]8076.99896143295[/C][C]1306.00103856705[/C][/ROW]
[ROW][C]37[/C][C]9706[/C][C]9099.05269324781[/C][C]606.94730675219[/C][/ROW]
[ROW][C]38[/C][C]8579[/C][C]9574.03911482194[/C][C]-995.039114821935[/C][/ROW]
[ROW][C]39[/C][C]9474[/C][C]8795.33878413816[/C][C]678.661215861837[/C][/ROW]
[ROW][C]40[/C][C]8318[/C][C]9326.44726554538[/C][C]-1008.44726554538[/C][/ROW]
[ROW][C]41[/C][C]8213[/C][C]8537.25394896118[/C][C]-324.253948961177[/C][/ROW]
[ROW][C]42[/C][C]8059[/C][C]8283.49843973502[/C][C]-224.498439735016[/C][/ROW]
[ROW][C]43[/C][C]9111[/C][C]8107.80985960223[/C][C]1003.19014039777[/C][/ROW]
[ROW][C]44[/C][C]7708[/C][C]8892.88904134499[/C][C]-1184.88904134499[/C][/ROW]
[ROW][C]45[/C][C]7680[/C][C]7965.61545523673[/C][C]-285.615455236732[/C][/ROW]
[ROW][C]46[/C][C]8014[/C][C]7742.09776017503[/C][C]271.902239824974[/C][/ROW]
[ROW][C]47[/C][C]8007[/C][C]7954.8837310092[/C][C]52.1162689907969[/C][/ROW]
[ROW][C]48[/C][C]8718[/C][C]7995.66901803222[/C][C]722.330981967783[/C][/ROW]
[ROW][C]49[/C][C]9486[/C][C]8560.9526999929[/C][C]925.047300007096[/C][/ROW]
[ROW][C]50[/C][C]9113[/C][C]9284.87865193155[/C][C]-171.878651931549[/C][/ROW]
[ROW][C]51[/C][C]9025[/C][C]9150.3694039001[/C][C]-125.369403900098[/C][/ROW]
[ROW][C]52[/C][C]8476[/C][C]9052.2574856645[/C][C]-576.257485664497[/C][/ROW]
[ROW][C]53[/C][C]7952[/C][C]8601.28838509176[/C][C]-649.288385091757[/C][/ROW]
[ROW][C]54[/C][C]7759[/C][C]8093.16657093517[/C][C]-334.166570935172[/C][/ROW]
[ROW][C]55[/C][C]7835[/C][C]7831.653615902[/C][C]3.34638409800482[/C][/ROW]
[ROW][C]56[/C][C]7600[/C][C]7834.27243798134[/C][C]-234.272437981344[/C][/ROW]
[ROW][C]57[/C][C]7651[/C][C]7650.93489656337[/C][C]0.0651034366255772[/C][/ROW]
[ROW][C]58[/C][C]8319[/C][C]7650.98584538224[/C][C]668.014154617757[/C][/ROW]
[ROW][C]59[/C][C]8812[/C][C]8173.76212156449[/C][C]638.237878435512[/C][/ROW]
[ROW][C]60[/C][C]8630[/C][C]8673.23600112306[/C][C]-43.236001123063[/C][/ROW]
[/TABLE]
Source: https://freestatistics.org/blog/index.php?pk=147342&T=2

Globally Unique Identifier (entire table): ba.freestatistics.org/blog/index.php?pk=147342&T=2

As an alternative you can also use a QR Code:  

The GUIDs for individual cells are displayed in the table below:

Interpolation Forecasts of Exponential Smoothing
tObservedFittedResiduals
289159911-996
394529131.54769726331320.452302736692
491129382.32810417635-270.328104176351
584729170.7740245632-698.774024563198
682308623.92560836001-393.925608360014
783848315.6462684572468.353731542762
886258369.13871168179255.861288318212
982218569.37131244565-348.37131244565
1086498296.74197339629352.258026603713
1186258572.4129874462352.5870125537658
12104438613.566670206351829.43332979365
131035710045.2494228278311.750577172248
14858610289.2200104346-1703.22001043458
1588928956.30960963092-64.3096096309182
1683298905.9820259814-576.982025981402
1781018454.44591273955-353.445912739549
1879228177.8452796294-255.845279629395
1981207977.62520698738142.374793012618
2078388089.04524741443-251.045247414435
2177357892.58159662298-157.581596622985
2284067769.26097578291636.739024217086
2382098267.56187806035-58.5618780603454
2494518221.732369318661229.26763068134
25100419183.73586873056857.264131269445
2694119854.61588998712-443.615889987121
27104059507.44979864069897.550201359314
28846710209.8569987123-1742.85699871227
2984648845.92737924737-381.92737924737
3081028547.03764507814-445.03764507814
3176278198.75891288871-571.758912888712
3275137751.3103172448-238.310317244802
3375107564.81280164001-54.8128016400105
3482917521.91725499568769.082745004323
3580648123.7880547835-59.7880547835048
3693838076.998961432951306.00103856705
3797069099.05269324781606.94730675219
3885799574.03911482194-995.039114821935
3994748795.33878413816678.661215861837
4083189326.44726554538-1008.44726554538
4182138537.25394896118-324.253948961177
4280598283.49843973502-224.498439735016
4391118107.809859602231003.19014039777
4477088892.88904134499-1184.88904134499
4576807965.61545523673-285.615455236732
4680147742.09776017503271.902239824974
4780077954.883731009252.1162689907969
4887187995.66901803222722.330981967783
4994868560.9526999929925.047300007096
5091139284.87865193155-171.878651931549
5190259150.3694039001-125.369403900098
5284769052.2574856645-576.257485664497
5379528601.28838509176-649.288385091757
5477598093.16657093517-334.166570935172
5578357831.6536159023.34638409800482
5676007834.27243798134-234.272437981344
5776517650.934896563370.0651034366255772
5883197650.98584538224668.014154617757
5988128173.76212156449638.237878435512
6086308673.23600112306-43.236001123063


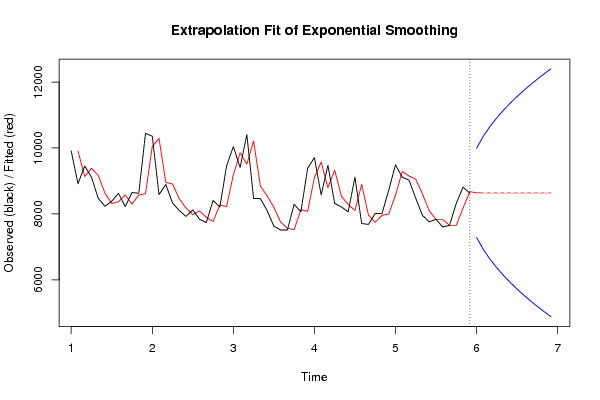
Extrapolation Forecasts of Exponential Smoothing
tForecast95% Lower Bound95% Upper Bound
618639.400257512127288.586638398629990.21387662562
628639.400257512126924.1139663050310354.6865487192
638639.400257512126624.5263934641910654.2741215601
648639.400257512126364.0483473136410914.7521677106
658639.400257512126130.4690224113411148.3314926129
668639.400257512125916.8563056750211361.9442093492
678639.400257512125718.8257940023711559.9747210219
688639.400257512125533.3956174438411745.4048975804
698639.400257512125358.4286862628111920.3718287614
708639.400257512125192.3313463113812086.4691687129
718639.400257512125033.8775900217212244.9229250025
728639.400257512124882.1002517889212396.7002632353

\begin{tabular}{lllllllll}
\hline
Extrapolation Forecasts of Exponential Smoothing \tabularnewline
t & Forecast & 95% Lower Bound & 95% Upper Bound \tabularnewline
61 & 8639.40025751212 & 7288.58663839862 & 9990.21387662562 \tabularnewline
62 & 8639.40025751212 & 6924.11396630503 & 10354.6865487192 \tabularnewline
63 & 8639.40025751212 & 6624.52639346419 & 10654.2741215601 \tabularnewline
64 & 8639.40025751212 & 6364.04834731364 & 10914.7521677106 \tabularnewline
65 & 8639.40025751212 & 6130.46902241134 & 11148.3314926129 \tabularnewline
66 & 8639.40025751212 & 5916.85630567502 & 11361.9442093492 \tabularnewline
67 & 8639.40025751212 & 5718.82579400237 & 11559.9747210219 \tabularnewline
68 & 8639.40025751212 & 5533.39561744384 & 11745.4048975804 \tabularnewline
69 & 8639.40025751212 & 5358.42868626281 & 11920.3718287614 \tabularnewline
70 & 8639.40025751212 & 5192.33134631138 & 12086.4691687129 \tabularnewline
71 & 8639.40025751212 & 5033.87759002172 & 12244.9229250025 \tabularnewline
72 & 8639.40025751212 & 4882.10025178892 & 12396.7002632353 \tabularnewline
\hline
\end{tabular}
%Source: https://freestatistics.org/blog/index.php?pk=147342&T=3

[TABLE]
[ROW][C]Extrapolation Forecasts of Exponential Smoothing[/C][/ROW]
[ROW][C]t[/C][C]Forecast[/C][C]95% Lower Bound[/C][C]95% Upper Bound[/C][/ROW]
[ROW][C]61[/C][C]8639.40025751212[/C][C]7288.58663839862[/C][C]9990.21387662562[/C][/ROW]
[ROW][C]62[/C][C]8639.40025751212[/C][C]6924.11396630503[/C][C]10354.6865487192[/C][/ROW]
[ROW][C]63[/C][C]8639.40025751212[/C][C]6624.52639346419[/C][C]10654.2741215601[/C][/ROW]
[ROW][C]64[/C][C]8639.40025751212[/C][C]6364.04834731364[/C][C]10914.7521677106[/C][/ROW]
[ROW][C]65[/C][C]8639.40025751212[/C][C]6130.46902241134[/C][C]11148.3314926129[/C][/ROW]
[ROW][C]66[/C][C]8639.40025751212[/C][C]5916.85630567502[/C][C]11361.9442093492[/C][/ROW]
[ROW][C]67[/C][C]8639.40025751212[/C][C]5718.82579400237[/C][C]11559.9747210219[/C][/ROW]
[ROW][C]68[/C][C]8639.40025751212[/C][C]5533.39561744384[/C][C]11745.4048975804[/C][/ROW]
[ROW][C]69[/C][C]8639.40025751212[/C][C]5358.42868626281[/C][C]11920.3718287614[/C][/ROW]
[ROW][C]70[/C][C]8639.40025751212[/C][C]5192.33134631138[/C][C]12086.4691687129[/C][/ROW]
[ROW][C]71[/C][C]8639.40025751212[/C][C]5033.87759002172[/C][C]12244.9229250025[/C][/ROW]
[ROW][C]72[/C][C]8639.40025751212[/C][C]4882.10025178892[/C][C]12396.7002632353[/C][/ROW]
[/TABLE]
Source: https://freestatistics.org/blog/index.php?pk=147342&T=3

Globally Unique Identifier (entire table): ba.freestatistics.org/blog/index.php?pk=147342&T=3

As an alternative you can also use a QR Code:  

The GUIDs for individual cells are displayed in the table below:

Extrapolation Forecasts of Exponential Smoothing
tForecast95% Lower Bound95% Upper Bound
618639.400257512127288.586638398629990.21387662562
628639.400257512126924.1139663050310354.6865487192
638639.400257512126624.5263934641910654.2741215601
648639.400257512126364.0483473136410914.7521677106
658639.400257512126130.4690224113411148.3314926129
668639.400257512125916.8563056750211361.9442093492
678639.400257512125718.8257940023711559.9747210219
688639.400257512125533.3956174438411745.4048975804
698639.400257512125358.4286862628111920.3718287614
708639.400257512125192.3313463113812086.4691687129
718639.400257512125033.8775900217212244.9229250025
728639.400257512124882.1002517889212396.7002632353


Parameters (Session):
par1 = 1 ; par2 = Include Monthly Dummies ; par3 = Linear Trend ;
Parameters (R input):
par1 = 12 ; par2 = Single ; par3 = multiplicative ;
R code (references can be found in the software module):
par1 <- as.numeric(par1)
if (par2 == 'Single') K <- 1
if (par2 == 'Double') K <- 2
if (par2 == 'Triple') K <- par1
nx <- length(x)
nxmK <- nx - K
x <- ts(x, frequency = par1)
if (par2 == 'Single') fit <- HoltWinters(x, gamma=F, beta=F)
if (par2 == 'Double') fit <- HoltWinters(x, gamma=F)
if (par2 == 'Triple') fit <- HoltWinters(x, seasonal=par3)
fit
myresid <- x - fit$fitted[,'xhat']
bitmap(file='test1.png')
op <- par(mfrow=c(2,1))
plot(fit,ylab='Observed (black) / Fitted (red)',main='Interpolation Fit of Exponential Smoothing')
plot(myresid,ylab='Residuals',main='Interpolation Prediction Errors')
par(op)
dev.off()
bitmap(file='test2.png')
p <- predict(fit, par1, prediction.interval=TRUE)
np <- length(p[,1])
plot(fit,p,ylab='Observed (black) / Fitted (red)',main='Extrapolation Fit of Exponential Smoothing')
dev.off()
bitmap(file='test3.png')
op <- par(mfrow = c(2,2))
acf(as.numeric(myresid),lag.max = nx/2,main='Residual ACF')
spectrum(myresid,main='Residals Periodogram')
cpgram(myresid,main='Residal Cumulative Periodogram')
qqnorm(myresid,main='Residual Normal QQ Plot')
qqline(myresid)
par(op)
dev.off()
load(file='createtable')
a<-table.start()
a<-table.row.start(a)
a<-table.element(a,'Estimated Parameters of Exponential Smoothing',2,TRUE)
a<-table.row.end(a)
a<-table.row.start(a)
a<-table.element(a,'Parameter',header=TRUE)
a<-table.element(a,'Value',header=TRUE)
a<-table.row.end(a)
a<-table.row.start(a)
a<-table.element(a,'alpha',header=TRUE)
a<-table.element(a,fit$alpha)
a<-table.row.end(a)
a<-table.row.start(a)
a<-table.element(a,'beta',header=TRUE)
a<-table.element(a,fit$beta)
a<-table.row.end(a)
a<-table.row.start(a)
a<-table.element(a,'gamma',header=TRUE)
a<-table.element(a,fit$gamma)
a<-table.row.end(a)
a<-table.end(a)
table.save(a,file='mytable.tab')
a<-table.start()
a<-table.row.start(a)
a<-table.element(a,'Interpolation Forecasts of Exponential Smoothing',4,TRUE)
a<-table.row.end(a)
a<-table.row.start(a)
a<-table.element(a,'t',header=TRUE)
a<-table.element(a,'Observed',header=TRUE)
a<-table.element(a,'Fitted',header=TRUE)
a<-table.element(a,'Residuals',header=TRUE)
a<-table.row.end(a)
for (i in 1:nxmK) {
a<-table.row.start(a)
a<-table.element(a,i+K,header=TRUE)
a<-table.element(a,x[i+K])
a<-table.element(a,fit$fitted[i,'xhat'])
a<-table.element(a,myresid[i])
a<-table.row.end(a)
}
a<-table.end(a)
table.save(a,file='mytable1.tab')
a<-table.start()
a<-table.row.start(a)
a<-table.element(a,'Extrapolation Forecasts of Exponential Smoothing',4,TRUE)
a<-table.row.end(a)
a<-table.row.start(a)
a<-table.element(a,'t',header=TRUE)
a<-table.element(a,'Forecast',header=TRUE)
a<-table.element(a,'95% Lower Bound',header=TRUE)
a<-table.element(a,'95% Upper Bound',header=TRUE)
a<-table.row.end(a)
for (i in 1:np) {
a<-table.row.start(a)
a<-table.element(a,nx+i,header=TRUE)
a<-table.element(a,p[i,'fit'])
a<-table.element(a,p[i,'lwr'])
a<-table.element(a,p[i,'upr'])
a<-table.row.end(a)
}
a<-table.end(a)
table.save(a,file='mytable2.tab')