Free Statistics

of Irreproducible Research!

Author's title

Author*The author of this computation has been verified*
R Software Modulerwasp_multipleregression.wasp
Title produced by softwareMultiple Regression
Date of computationThu, 24 Nov 2011 16:23:22 -0500
Cite this page as followsStatistical Computations at FreeStatistics.org, Office for Research Development and Education, URL https://freestatistics.org/blog/index.php?v=date/2011/Nov/24/t1322169908j4nq4gurjpgr50g.htm/, Retrieved Wed, 24 Apr 2024 19:42:35 +0000
Statistical Computations at FreeStatistics.org, Office for Research Development and Education, URL https://freestatistics.org/blog/index.php?pk=147217, Retrieved Wed, 24 Apr 2024 19:42:35 +0000
QR Codes:

Original text written by user:
IsPrivate?No (this computation is public)
User-defined keywords
Estimated Impact89
Family? (F = Feedback message, R = changed R code, M = changed R Module, P = changed Parameters, D = changed Data)
-     [Multiple Regression] [Ws 7 - goed] [2011-11-23 14:53:16] [9322e7627e8d230cdc5c9950daae258c]
-    D    [Multiple Regression] [Geboren in België] [2011-11-24 21:23:22] [02062aee8449a97abc7c7e765b9155b5] [Current]
- R  D      [Multiple Regression] [Geboren in België...] [2011-11-24 22:04:40] [baac05fe722f73c103cc2d713fa5bd78]
- RMPD        [Univariate Explorative Data Analysis] [vlaanderen] [2011-11-29 22:49:04] [15a5dd358825f04074b70fc847ec6454]
Feedback Forum

Post a new message
Dataseries X:
13509	62845	37905
14142	62035	37993
14755	62571	39070
15495	61141	38736
15096	60463	37537
15930	60703	37372
16436	63035	37824
16705	64512	38405
17415	66137	38977
17613	67231	39251


Summary of computational transaction
Raw Inputview raw input (R code)
Raw Outputview raw output of R engine
Computing time4 seconds
R Server'George Udny Yule' @ yule.wessa.net

\begin{tabular}{lllllllll}
\hline
Summary of computational transaction \tabularnewline
Raw Input & view raw input (R code)  \tabularnewline
Raw Output & view raw output of R engine  \tabularnewline
Computing time & 4 seconds \tabularnewline
R Server & 'George Udny Yule' @ yule.wessa.net \tabularnewline
\hline
\end{tabular}
%Source: https://freestatistics.org/blog/index.php?pk=147217&T=0

[TABLE]
[ROW][C]Summary of computational transaction[/C][/ROW]
[ROW][C]Raw Input[/C][C]view raw input (R code) [/C][/ROW]
[ROW][C]Raw Output[/C][C]view raw output of R engine [/C][/ROW]
[ROW][C]Computing time[/C][C]4 seconds[/C][/ROW]
[ROW][C]R Server[/C][C]'George Udny Yule' @ yule.wessa.net[/C][/ROW]
[/TABLE]
Source: https://freestatistics.org/blog/index.php?pk=147217&T=0

Globally Unique Identifier (entire table): ba.freestatistics.org/blog/index.php?pk=147217&T=0

As an alternative you can also use a QR Code:  

The GUIDs for individual cells are displayed in the table below:

Summary of computational transaction
Raw Inputview raw input (R code)
Raw Outputview raw output of R engine
Computing time4 seconds
R Server'George Udny Yule' @ yule.wessa.net


Multiple Linear Regression - Estimated Regression Equation
Brussel[t] = + 5603.29951051044 -0.0828922353186576Vlaanderen[t] + 0.334221860800385Wallonie[t] + 460.19148005847t + e[t]

\begin{tabular}{lllllllll}
\hline
Multiple Linear Regression - Estimated Regression Equation \tabularnewline
Brussel[t] =  +  5603.29951051044 -0.0828922353186576Vlaanderen[t] +  0.334221860800385Wallonie[t] +  460.19148005847t  + e[t] \tabularnewline
\hline
\end{tabular}
%Source: https://freestatistics.org/blog/index.php?pk=147217&T=1

[TABLE]
[ROW][C]Multiple Linear Regression - Estimated Regression Equation[/C][/ROW]
[ROW][C]Brussel[t] =  +  5603.29951051044 -0.0828922353186576Vlaanderen[t] +  0.334221860800385Wallonie[t] +  460.19148005847t  + e[t][/C][/ROW]
[/TABLE]
Source: https://freestatistics.org/blog/index.php?pk=147217&T=1

Globally Unique Identifier (entire table): ba.freestatistics.org/blog/index.php?pk=147217&T=1

As an alternative you can also use a QR Code:  

The GUIDs for individual cells are displayed in the table below:

Multiple Linear Regression - Estimated Regression Equation
Brussel[t] = + 5603.29951051044 -0.0828922353186576Vlaanderen[t] + 0.334221860800385Wallonie[t] + 460.19148005847t + e[t]


Multiple Linear Regression - Ordinary Least Squares
VariableParameterS.D.T-STATH0: parameter = 02-tail p-value1-tail p-value
(Intercept)5603.299510510444101.0909731.36630.2208350.110418
Vlaanderen-0.08289223531865760.05483-1.51180.1813410.09067
Wallonie0.3342218608003850.1448692.30710.0605110.030256
t460.1914800584731.4378414.63816e-063e-06

\begin{tabular}{lllllllll}
\hline
Multiple Linear Regression - Ordinary Least Squares \tabularnewline
Variable & Parameter & S.D. & T-STATH0: parameter = 0 & 2-tail p-value & 1-tail p-value \tabularnewline
(Intercept) & 5603.29951051044 & 4101.090973 & 1.3663 & 0.220835 & 0.110418 \tabularnewline
Vlaanderen & -0.0828922353186576 & 0.05483 & -1.5118 & 0.181341 & 0.09067 \tabularnewline
Wallonie & 0.334221860800385 & 0.144869 & 2.3071 & 0.060511 & 0.030256 \tabularnewline
t & 460.19148005847 & 31.43784 & 14.6381 & 6e-06 & 3e-06 \tabularnewline
\hline
\end{tabular}
%Source: https://freestatistics.org/blog/index.php?pk=147217&T=2

[TABLE]
[ROW][C]Multiple Linear Regression - Ordinary Least Squares[/C][/ROW]
[ROW][C]Variable[/C][C]Parameter[/C][C]S.D.[/C][C]T-STATH0: parameter = 0[/C][C]2-tail p-value[/C][C]1-tail p-value[/C][/ROW]
[ROW][C](Intercept)[/C][C]5603.29951051044[/C][C]4101.090973[/C][C]1.3663[/C][C]0.220835[/C][C]0.110418[/C][/ROW]
[ROW][C]Vlaanderen[/C][C]-0.0828922353186576[/C][C]0.05483[/C][C]-1.5118[/C][C]0.181341[/C][C]0.09067[/C][/ROW]
[ROW][C]Wallonie[/C][C]0.334221860800385[/C][C]0.144869[/C][C]2.3071[/C][C]0.060511[/C][C]0.030256[/C][/ROW]
[ROW][C]t[/C][C]460.19148005847[/C][C]31.43784[/C][C]14.6381[/C][C]6e-06[/C][C]3e-06[/C][/ROW]
[/TABLE]
Source: https://freestatistics.org/blog/index.php?pk=147217&T=2

Globally Unique Identifier (entire table): ba.freestatistics.org/blog/index.php?pk=147217&T=2

As an alternative you can also use a QR Code:  

The GUIDs for individual cells are displayed in the table below:

Multiple Linear Regression - Ordinary Least Squares
VariableParameterS.D.T-STATH0: parameter = 02-tail p-value1-tail p-value
(Intercept)5603.299510510444101.0909731.36630.2208350.110418
Vlaanderen-0.08289223531865760.05483-1.51180.1813410.09067
Wallonie0.3342218608003850.1448692.30710.0605110.030256
t460.1914800584731.4378414.63816e-063e-06


Multiple Linear Regression - Regression Statistics
Multiple R0.992512303481
R-squared0.98508067256116
Adjusted R-squared0.97762100884174
F-TEST (value)132.054300249039
F-TEST (DF numerator)3
F-TEST (DF denominator)6
p-value7.22356976368133e-06
Multiple Linear Regression - Residual Statistics
Residual Standard Deviation203.974359588487
Sum Squared Residuals249633.236217201

\begin{tabular}{lllllllll}
\hline
Multiple Linear Regression - Regression Statistics \tabularnewline
Multiple R & 0.992512303481 \tabularnewline
R-squared & 0.98508067256116 \tabularnewline
Adjusted R-squared & 0.97762100884174 \tabularnewline
F-TEST (value) & 132.054300249039 \tabularnewline
F-TEST (DF numerator) & 3 \tabularnewline
F-TEST (DF denominator) & 6 \tabularnewline
p-value & 7.22356976368133e-06 \tabularnewline
Multiple Linear Regression - Residual Statistics \tabularnewline
Residual Standard Deviation & 203.974359588487 \tabularnewline
Sum Squared Residuals & 249633.236217201 \tabularnewline
\hline
\end{tabular}
%Source: https://freestatistics.org/blog/index.php?pk=147217&T=3

[TABLE]
[ROW][C]Multiple Linear Regression - Regression Statistics[/C][/ROW]
[ROW][C]Multiple R[/C][C]0.992512303481[/C][/ROW]
[ROW][C]R-squared[/C][C]0.98508067256116[/C][/ROW]
[ROW][C]Adjusted R-squared[/C][C]0.97762100884174[/C][/ROW]
[ROW][C]F-TEST (value)[/C][C]132.054300249039[/C][/ROW]
[ROW][C]F-TEST (DF numerator)[/C][C]3[/C][/ROW]
[ROW][C]F-TEST (DF denominator)[/C][C]6[/C][/ROW]
[ROW][C]p-value[/C][C]7.22356976368133e-06[/C][/ROW]
[ROW][C]Multiple Linear Regression - Residual Statistics[/C][/ROW]
[ROW][C]Residual Standard Deviation[/C][C]203.974359588487[/C][/ROW]
[ROW][C]Sum Squared Residuals[/C][C]249633.236217201[/C][/ROW]
[/TABLE]
Source: https://freestatistics.org/blog/index.php?pk=147217&T=3

Globally Unique Identifier (entire table): ba.freestatistics.org/blog/index.php?pk=147217&T=3

As an alternative you can also use a QR Code:  

The GUIDs for individual cells are displayed in the table below:

Multiple Linear Regression - Regression Statistics
Multiple R0.992512303481
R-squared0.98508067256116
Adjusted R-squared0.97762100884174
F-TEST (value)132.054300249039
F-TEST (DF numerator)3
F-TEST (DF denominator)6
p-value7.22356976368133e-06
Multiple Linear Regression - Residual Statistics
Residual Standard Deviation203.974359588487
Sum Squared Residuals249633.236217201


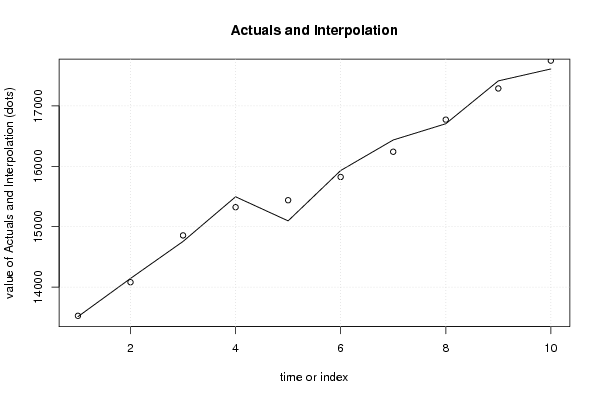
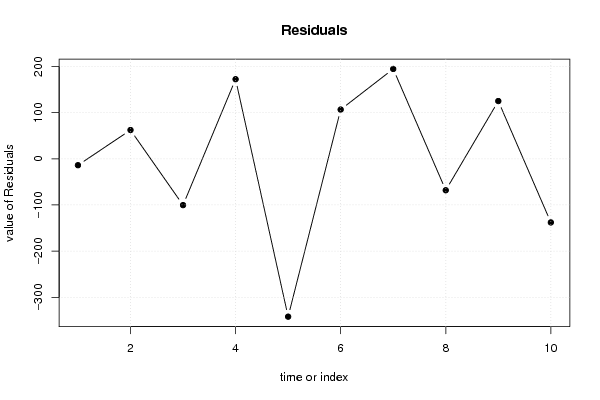
Multiple Linear Regression - Actuals, Interpolation, and Residuals
Time or IndexActualsInterpolationForecastResidualsPrediction Error
11350913522.8080956065-13.8080956064645
21414214079.553810023562.4461899765145
31475514855.2719960332-100.271996033169
41549515322.36927109172.630728910009
51509615438.0296755948-342.029675594849
61593015823.1804121448106.819587855223
71643616241.1354805219194.864519478088
81670516773.0780301397-68.0780301397485
91741517289.7445321832125.25546781678
101761317750.8286966624-137.828696662384

\begin{tabular}{lllllllll}
\hline
Multiple Linear Regression - Actuals, Interpolation, and Residuals \tabularnewline
Time or Index & Actuals & InterpolationForecast & ResidualsPrediction Error \tabularnewline
1 & 13509 & 13522.8080956065 & -13.8080956064645 \tabularnewline
2 & 14142 & 14079.5538100235 & 62.4461899765145 \tabularnewline
3 & 14755 & 14855.2719960332 & -100.271996033169 \tabularnewline
4 & 15495 & 15322.36927109 & 172.630728910009 \tabularnewline
5 & 15096 & 15438.0296755948 & -342.029675594849 \tabularnewline
6 & 15930 & 15823.1804121448 & 106.819587855223 \tabularnewline
7 & 16436 & 16241.1354805219 & 194.864519478088 \tabularnewline
8 & 16705 & 16773.0780301397 & -68.0780301397485 \tabularnewline
9 & 17415 & 17289.7445321832 & 125.25546781678 \tabularnewline
10 & 17613 & 17750.8286966624 & -137.828696662384 \tabularnewline
\hline
\end{tabular}
%Source: https://freestatistics.org/blog/index.php?pk=147217&T=4

[TABLE]
[ROW][C]Multiple Linear Regression - Actuals, Interpolation, and Residuals[/C][/ROW]
[ROW][C]Time or Index[/C][C]Actuals[/C][C]InterpolationForecast[/C][C]ResidualsPrediction Error[/C][/ROW]
[ROW][C]1[/C][C]13509[/C][C]13522.8080956065[/C][C]-13.8080956064645[/C][/ROW]
[ROW][C]2[/C][C]14142[/C][C]14079.5538100235[/C][C]62.4461899765145[/C][/ROW]
[ROW][C]3[/C][C]14755[/C][C]14855.2719960332[/C][C]-100.271996033169[/C][/ROW]
[ROW][C]4[/C][C]15495[/C][C]15322.36927109[/C][C]172.630728910009[/C][/ROW]
[ROW][C]5[/C][C]15096[/C][C]15438.0296755948[/C][C]-342.029675594849[/C][/ROW]
[ROW][C]6[/C][C]15930[/C][C]15823.1804121448[/C][C]106.819587855223[/C][/ROW]
[ROW][C]7[/C][C]16436[/C][C]16241.1354805219[/C][C]194.864519478088[/C][/ROW]
[ROW][C]8[/C][C]16705[/C][C]16773.0780301397[/C][C]-68.0780301397485[/C][/ROW]
[ROW][C]9[/C][C]17415[/C][C]17289.7445321832[/C][C]125.25546781678[/C][/ROW]
[ROW][C]10[/C][C]17613[/C][C]17750.8286966624[/C][C]-137.828696662384[/C][/ROW]
[/TABLE]
Source: https://freestatistics.org/blog/index.php?pk=147217&T=4

Globally Unique Identifier (entire table): ba.freestatistics.org/blog/index.php?pk=147217&T=4

As an alternative you can also use a QR Code:  

The GUIDs for individual cells are displayed in the table below:

Multiple Linear Regression - Actuals, Interpolation, and Residuals
Time or IndexActualsInterpolationForecastResidualsPrediction Error
11350913522.8080956065-13.8080956064645
21414214079.553810023562.4461899765145
31475514855.2719960332-100.271996033169
41549515322.36927109172.630728910009
51509615438.0296755948-342.029675594849
61593015823.1804121448106.819587855223
71643616241.1354805219194.864519478088
81670516773.0780301397-68.0780301397485
91741517289.7445321832125.25546781678
101761317750.8286966624-137.828696662384


Parameters (Session):
par1 = 1 ; par2 = Do not include Seasonal Dummies ; par3 = Linear Trend ;
Parameters (R input):
par1 = 1 ; par2 = Do not include Seasonal Dummies ; par3 = Linear Trend ;
R code (references can be found in the software module):
library(lattice)
library(lmtest)
n25 <- 25 #minimum number of obs. for Goldfeld-Quandt test
par1 <- as.numeric(par1)
x <- t(y)
k <- length(x[1,])
n <- length(x[,1])
x1 <- cbind(x[,par1], x[,1:k!=par1])
mycolnames <- c(colnames(x)[par1], colnames(x)[1:k!=par1])
colnames(x1) <- mycolnames #colnames(x)[par1]
x <- x1
if (par3 == 'First Differences'){
x2 <- array(0, dim=c(n-1,k), dimnames=list(1:(n-1), paste('(1-B)',colnames(x),sep='')))
for (i in 1:n-1) {
for (j in 1:k) {
x2[i,j] <- x[i+1,j] - x[i,j]
}
}
x <- x2
}
if (par2 == 'Include Monthly Dummies'){
x2 <- array(0, dim=c(n,11), dimnames=list(1:n, paste('M', seq(1:11), sep ='')))
for (i in 1:11){
x2[seq(i,n,12),i] <- 1
}
x <- cbind(x, x2)
}
if (par2 == 'Include Quarterly Dummies'){
x2 <- array(0, dim=c(n,3), dimnames=list(1:n, paste('Q', seq(1:3), sep ='')))
for (i in 1:3){
x2[seq(i,n,4),i] <- 1
}
x <- cbind(x, x2)
}
k <- length(x[1,])
if (par3 == 'Linear Trend'){
x <- cbind(x, c(1:n))
colnames(x)[k+1] <- 't'
}
x
k <- length(x[1,])
df <- as.data.frame(x)
(mylm <- lm(df))
(mysum <- summary(mylm))
if (n > n25) {
kp3 <- k + 3
nmkm3 <- n - k - 3
gqarr <- array(NA, dim=c(nmkm3-kp3+1,3))
numgqtests <- 0
numsignificant1 <- 0
numsignificant5 <- 0
numsignificant10 <- 0
for (mypoint in kp3:nmkm3) {
j <- 0
numgqtests <- numgqtests + 1
for (myalt in c('greater', 'two.sided', 'less')) {
j <- j + 1
gqarr[mypoint-kp3+1,j] <- gqtest(mylm, point=mypoint, alternative=myalt)$p.value
}
if (gqarr[mypoint-kp3+1,2] < 0.01) numsignificant1 <- numsignificant1 + 1
if (gqarr[mypoint-kp3+1,2] < 0.05) numsignificant5 <- numsignificant5 + 1
if (gqarr[mypoint-kp3+1,2] < 0.10) numsignificant10 <- numsignificant10 + 1
}
gqarr
}
bitmap(file='test0.png')
plot(x[,1], type='l', main='Actuals and Interpolation', ylab='value of Actuals and Interpolation (dots)', xlab='time or index')
points(x[,1]-mysum$resid)
grid()
dev.off()
bitmap(file='test1.png')
plot(mysum$resid, type='b', pch=19, main='Residuals', ylab='value of Residuals', xlab='time or index')
grid()
dev.off()
bitmap(file='test2.png')
hist(mysum$resid, main='Residual Histogram', xlab='values of Residuals')
grid()
dev.off()
bitmap(file='test3.png')
densityplot(~mysum$resid,col='black',main='Residual Density Plot', xlab='values of Residuals')
dev.off()
bitmap(file='test4.png')
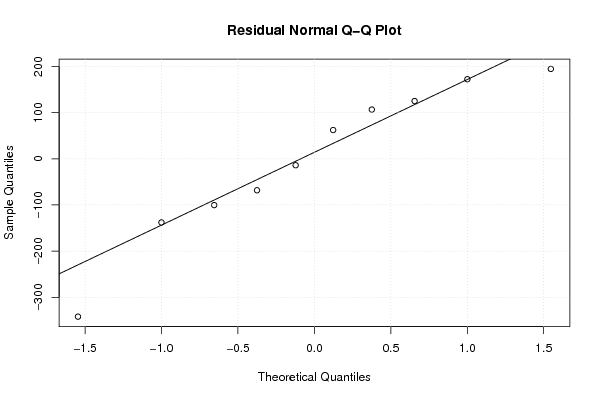
qqnorm(mysum$resid, main='Residual Normal Q-Q Plot')
qqline(mysum$resid)
grid()
dev.off()
(myerror <- as.ts(mysum$resid))
bitmap(file='test5.png')
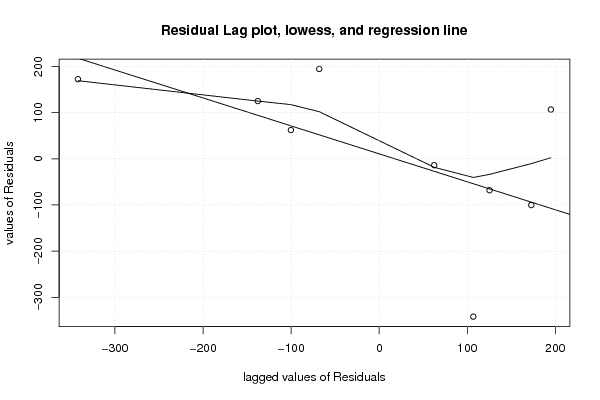
dum <- cbind(lag(myerror,k=1),myerror)
dum
dum1 <- dum[2:length(myerror),]
dum1
z <- as.data.frame(dum1)
z
plot(z,main=paste('Residual Lag plot, lowess, and regression line'), ylab='values of Residuals', xlab='lagged values of Residuals')
lines(lowess(z))
abline(lm(z))
grid()
dev.off()
bitmap(file='test6.png')
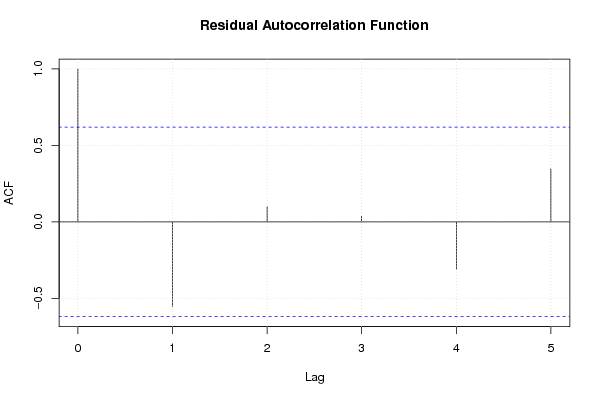
acf(mysum$resid, lag.max=length(mysum$resid)/2, main='Residual Autocorrelation Function')
grid()
dev.off()
bitmap(file='test7.png')
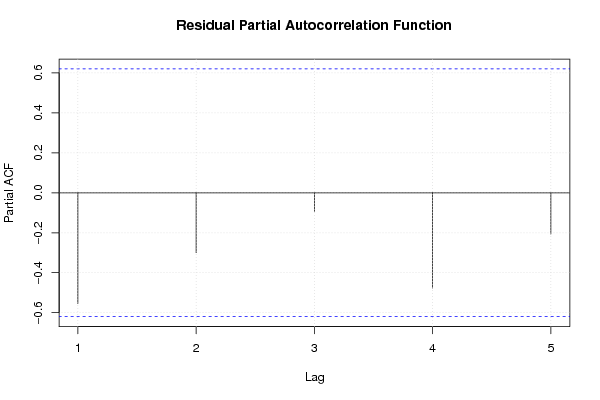
pacf(mysum$resid, lag.max=length(mysum$resid)/2, main='Residual Partial Autocorrelation Function')
grid()
dev.off()
bitmap(file='test8.png')
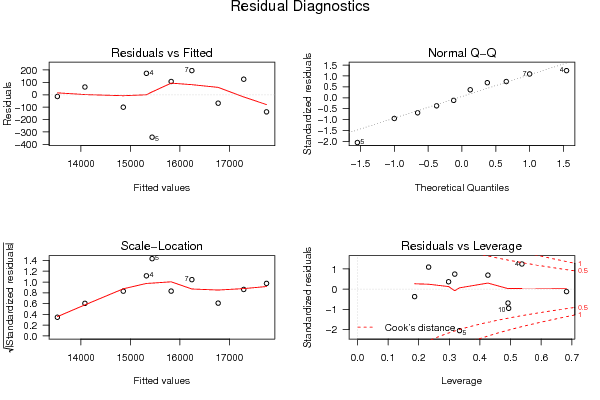
opar <- par(mfrow = c(2,2), oma = c(0, 0, 1.1, 0))
plot(mylm, las = 1, sub='Residual Diagnostics')
par(opar)
dev.off()
if (n > n25) {
bitmap(file='test9.png')
plot(kp3:nmkm3,gqarr[,2], main='Goldfeld-Quandt test',ylab='2-sided p-value',xlab='breakpoint')
grid()
dev.off()
}
load(file='createtable')
a<-table.start()
a<-table.row.start(a)
a<-table.element(a, 'Multiple Linear Regression - Estimated Regression Equation', 1, TRUE)
a<-table.row.end(a)
myeq <- colnames(x)[1]
myeq <- paste(myeq, '[t] = ', sep='')
for (i in 1:k){
if (mysum$coefficients[i,1] > 0) myeq <- paste(myeq, '+', '')
myeq <- paste(myeq, mysum$coefficients[i,1], sep=' ')
if (rownames(mysum$coefficients)[i] != '(Intercept)') {
myeq <- paste(myeq, rownames(mysum$coefficients)[i], sep='')
if (rownames(mysum$coefficients)[i] != 't') myeq <- paste(myeq, '[t]', sep='')
}
}
myeq <- paste(myeq, ' + e[t]')
a<-table.row.start(a)
a<-table.element(a, myeq)
a<-table.row.end(a)
a<-table.end(a)
table.save(a,file='mytable1.tab')
a<-table.start()
a<-table.row.start(a)
a<-table.element(a,hyperlink('ols1.htm','Multiple Linear Regression - Ordinary Least Squares',''), 6, TRUE)
a<-table.row.end(a)
a<-table.row.start(a)
a<-table.element(a,'Variable',header=TRUE)
a<-table.element(a,'Parameter',header=TRUE)
a<-table.element(a,'S.D.',header=TRUE)
a<-table.element(a,'T-STAT
H0: parameter = 0',header=TRUE)
a<-table.element(a,'2-tail p-value',header=TRUE)
a<-table.element(a,'1-tail p-value',header=TRUE)
a<-table.row.end(a)
for (i in 1:k){
a<-table.row.start(a)
a<-table.element(a,rownames(mysum$coefficients)[i],header=TRUE)
a<-table.element(a,mysum$coefficients[i,1])
a<-table.element(a, round(mysum$coefficients[i,2],6))
a<-table.element(a, round(mysum$coefficients[i,3],4))
a<-table.element(a, round(mysum$coefficients[i,4],6))
a<-table.element(a, round(mysum$coefficients[i,4]/2,6))
a<-table.row.end(a)
}
a<-table.end(a)
table.save(a,file='mytable2.tab')
a<-table.start()
a<-table.row.start(a)
a<-table.element(a, 'Multiple Linear Regression - Regression Statistics', 2, TRUE)
a<-table.row.end(a)
a<-table.row.start(a)
a<-table.element(a, 'Multiple R',1,TRUE)
a<-table.element(a, sqrt(mysum$r.squared))
a<-table.row.end(a)
a<-table.row.start(a)
a<-table.element(a, 'R-squared',1,TRUE)
a<-table.element(a, mysum$r.squared)
a<-table.row.end(a)
a<-table.row.start(a)
a<-table.element(a, 'Adjusted R-squared',1,TRUE)
a<-table.element(a, mysum$adj.r.squared)
a<-table.row.end(a)
a<-table.row.start(a)
a<-table.element(a, 'F-TEST (value)',1,TRUE)
a<-table.element(a, mysum$fstatistic[1])
a<-table.row.end(a)
a<-table.row.start(a)
a<-table.element(a, 'F-TEST (DF numerator)',1,TRUE)
a<-table.element(a, mysum$fstatistic[2])
a<-table.row.end(a)
a<-table.row.start(a)
a<-table.element(a, 'F-TEST (DF denominator)',1,TRUE)
a<-table.element(a, mysum$fstatistic[3])
a<-table.row.end(a)
a<-table.row.start(a)
a<-table.element(a, 'p-value',1,TRUE)
a<-table.element(a, 1-pf(mysum$fstatistic[1],mysum$fstatistic[2],mysum$fstatistic[3]))
a<-table.row.end(a)
a<-table.row.start(a)
a<-table.element(a, 'Multiple Linear Regression - Residual Statistics', 2, TRUE)
a<-table.row.end(a)
a<-table.row.start(a)
a<-table.element(a, 'Residual Standard Deviation',1,TRUE)
a<-table.element(a, mysum$sigma)
a<-table.row.end(a)
a<-table.row.start(a)
a<-table.element(a, 'Sum Squared Residuals',1,TRUE)
a<-table.element(a, sum(myerror*myerror))
a<-table.row.end(a)
a<-table.end(a)
table.save(a,file='mytable3.tab')
a<-table.start()
a<-table.row.start(a)
a<-table.element(a, 'Multiple Linear Regression - Actuals, Interpolation, and Residuals', 4, TRUE)
a<-table.row.end(a)
a<-table.row.start(a)
a<-table.element(a, 'Time or Index', 1, TRUE)
a<-table.element(a, 'Actuals', 1, TRUE)
a<-table.element(a, 'Interpolation
Forecast', 1, TRUE)
a<-table.element(a, 'Residuals
Prediction Error', 1, TRUE)
a<-table.row.end(a)
for (i in 1:n) {
a<-table.row.start(a)
a<-table.element(a,i, 1, TRUE)
a<-table.element(a,x[i])
a<-table.element(a,x[i]-mysum$resid[i])
a<-table.element(a,mysum$resid[i])
a<-table.row.end(a)
}
a<-table.end(a)
table.save(a,file='mytable4.tab')
if (n > n25) {
a<-table.start()
a<-table.row.start(a)
a<-table.element(a,'Goldfeld-Quandt test for Heteroskedasticity',4,TRUE)
a<-table.row.end(a)
a<-table.row.start(a)
a<-table.element(a,'p-values',header=TRUE)
a<-table.element(a,'Alternative Hypothesis',3,header=TRUE)
a<-table.row.end(a)
a<-table.row.start(a)
a<-table.element(a,'breakpoint index',header=TRUE)
a<-table.element(a,'greater',header=TRUE)
a<-table.element(a,'2-sided',header=TRUE)
a<-table.element(a,'less',header=TRUE)
a<-table.row.end(a)
for (mypoint in kp3:nmkm3) {
a<-table.row.start(a)
a<-table.element(a,mypoint,header=TRUE)
a<-table.element(a,gqarr[mypoint-kp3+1,1])
a<-table.element(a,gqarr[mypoint-kp3+1,2])
a<-table.element(a,gqarr[mypoint-kp3+1,3])
a<-table.row.end(a)
}
a<-table.end(a)
table.save(a,file='mytable5.tab')
a<-table.start()
a<-table.row.start(a)
a<-table.element(a,'Meta Analysis of Goldfeld-Quandt test for Heteroskedasticity',4,TRUE)
a<-table.row.end(a)
a<-table.row.start(a)
a<-table.element(a,'Description',header=TRUE)
a<-table.element(a,'# significant tests',header=TRUE)
a<-table.element(a,'% significant tests',header=TRUE)
a<-table.element(a,'OK/NOK',header=TRUE)
a<-table.row.end(a)
a<-table.row.start(a)
a<-table.element(a,'1% type I error level',header=TRUE)
a<-table.element(a,numsignificant1)
a<-table.element(a,numsignificant1/numgqtests)
if (numsignificant1/numgqtests < 0.01) dum <- 'OK' else dum <- 'NOK'
a<-table.element(a,dum)
a<-table.row.end(a)
a<-table.row.start(a)
a<-table.element(a,'5% type I error level',header=TRUE)
a<-table.element(a,numsignificant5)
a<-table.element(a,numsignificant5/numgqtests)
if (numsignificant5/numgqtests < 0.05) dum <- 'OK' else dum <- 'NOK'
a<-table.element(a,dum)
a<-table.row.end(a)
a<-table.row.start(a)
a<-table.element(a,'10% type I error level',header=TRUE)
a<-table.element(a,numsignificant10)
a<-table.element(a,numsignificant10/numgqtests)
if (numsignificant10/numgqtests < 0.1) dum <- 'OK' else dum <- 'NOK'
a<-table.element(a,dum)
a<-table.row.end(a)
a<-table.end(a)
table.save(a,file='mytable6.tab')
}