| Multiple Linear Regression - Estimated Regression Equation |
| werkloosheid[t] = + 0.663907484037988 -3.94105757478893indicator[t] + 1.00077195481772economie[t] + 1.03740674497135`finaciën`[t] + 0.888119561734234spaarvermogen[t] + e[t] |
| Multiple Linear Regression - Ordinary Least Squares | |||||
| Variable | Parameter | S.D. | T-STAT H0: parameter = 0 | 2-tail p-value | 1-tail p-value |
| (Intercept) | 0.663907484037988 | 0.4621 | 1.4367 | 0.156462 | 0.078231 |
| indicator | -3.94105757478893 | 0.030998 | -127.1389 | 0 | 0 |
| economie | 1.00077195481772 | 0.022989 | 43.5326 | 0 | 0 |
| `finaciën` | 1.03740674497135 | 0.133596 | 7.7652 | 0 | 0 |
| spaarvermogen | 0.888119561734234 | 0.059123 | 15.0216 | 0 | 0 |
| Multiple Linear Regression - Regression Statistics | |
| Multiple R | 0.998682888644061 |
| R-squared | 0.997367512070446 |
| Adjusted R-squared | 0.997176058402843 |
| F-TEST (value) | 5209.44583905242 |
| F-TEST (DF numerator) | 4 |
| F-TEST (DF denominator) | 55 |
| p-value | 0 |
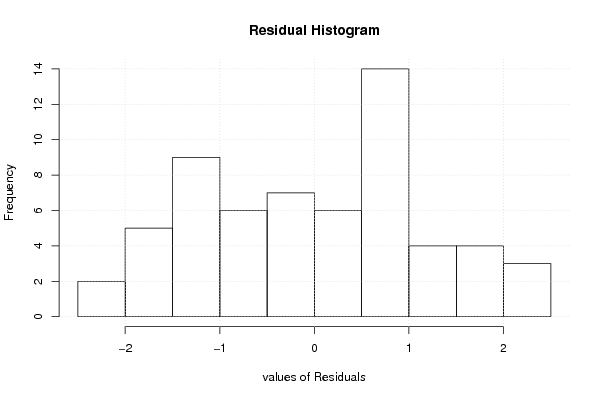
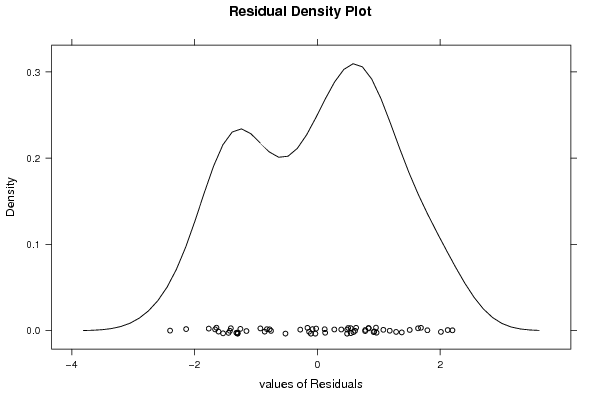
| Multiple Linear Regression - Residual Statistics | |
| Residual Standard Deviation | 1.22777002196627 |
| Sum Squared Residuals | 82.9080574761476 |
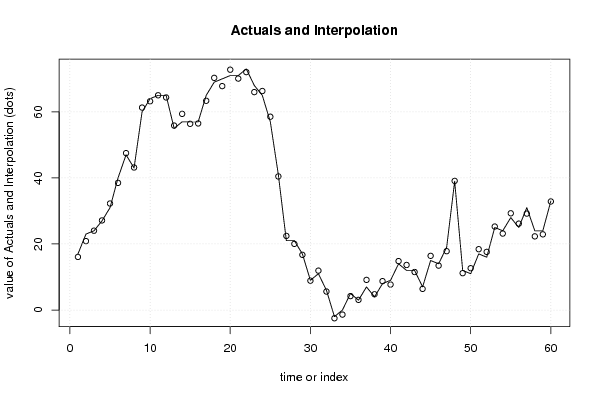
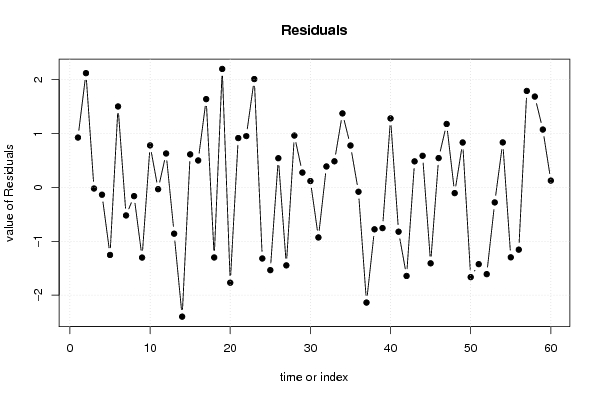
| Multiple Linear Regression - Actuals, Interpolation, and Residuals | |||
| Time or Index | Actuals | Interpolation Forecast | Residuals Prediction Error |
| 1 | 17 | 16.0736139829278 | 0.926386017072153 |
| 2 | 23 | 20.8773956651227 | 2.12260433487732 |
| 3 | 24 | 24.0203386395551 | -0.0203386395551358 |
| 4 | 27 | 27.1353068970918 | -0.135306897091802 |
| 5 | 31 | 32.2543983268314 | -1.25439832683136 |
| 6 | 40 | 38.4964619532442 | 1.50353804675578 |
| 7 | 47 | 47.5199761676191 | -0.519976167619086 |
| 8 | 43 | 43.1614767725681 | -0.161476772568109 |
| 9 | 60 | 61.3027307262776 | -1.3027307262776 |
| 10 | 64 | 63.2195969597254 | 0.780403040274637 |
| 11 | 65 | 65.0324708733475 | -0.03247087334746 |
| 12 | 65 | 64.3696560977802 | 0.630343902219803 |
| 13 | 55 | 55.8587817002212 | -0.858781700221217 |
| 14 | 57 | 59.3998518512777 | -2.39985185127774 |
| 15 | 57 | 56.3862966509993 | 0.61370334900073 |
| 16 | 57 | 56.4989490440828 | 0.501050955917242 |
| 17 | 65 | 63.3602240697047 | 1.63977593029535 |
| 18 | 69 | 70.3008494863241 | -1.30084948632414 |
| 19 | 70 | 67.7997653428065 | 2.20023465719354 |
| 20 | 71 | 72.7695695893089 | -1.76956958930891 |
| 21 | 71 | 70.0834512479147 | 0.916548752085257 |
| 22 | 73 | 72.045612344774 | 0.954387655226048 |
| 23 | 68 | 65.9877792046986 | 2.01222079530139 |
| 24 | 65 | 66.3196555732587 | -1.31965557325875 |
| 25 | 57 | 58.5362054583165 | -1.53620545831646 |
| 26 | 41 | 40.4578695246032 | 0.542130475396825 |
| 27 | 21 | 22.4474758860071 | -1.44747588600706 |
| 28 | 21 | 20.0363967038671 | 0.963603296132864 |
| 29 | 17 | 16.7240983770593 | 0.275901622940672 |
| 30 | 9 | 8.8813660402577 | 0.118633959742296 |
| 31 | 11 | 11.9289767681223 | -0.928976768122317 |
| 32 | 6 | 5.61089553877961 | 0.389104461220393 |
| 33 | -2 | -2.4851163010848 | 0.485116301084798 |
| 34 | 0 | -1.37443997580619 | 1.37443997580619 |
| 35 | 5 | 4.2215442561099 | 0.778455743890102 |
| 36 | 3 | 3.08014519131288 | -0.0801451913128812 |
| 37 | 7 | 9.13797833138822 | -2.13797833138822 |
| 38 | 4 | 4.77778744928401 | -0.77778744928401 |
| 39 | 8 | 8.75547981422656 | -0.755479814226565 |
| 40 | 9 | 7.71807306925522 | 1.28192693074478 |
| 41 | 14 | 14.8221417876148 | -0.82214178761484 |
| 42 | 12 | 13.6441079326642 | -1.6441079326642 |
| 43 | 12 | 11.5159242714974 | 0.484075728502632 |
| 44 | 7 | 6.41251168725893 | 0.587488312741068 |
| 45 | 15 | 16.40971091507 | -1.40971091506997 |
| 46 | 14 | 13.4554379366509 | 0.544562063349142 |
| 47 | 19 | 17.8217096294454 | 1.1782903705546 |
| 48 | 39 | 39.1059065575873 | -0.105906557587345 |
| 49 | 12 | 11.1656712208522 | 0.834328779147761 |
| 50 | 11 | 12.6659834095522 | -1.6659834095522 |
| 51 | 17 | 18.4252421831533 | -1.42524218315331 |
| 52 | 16 | 17.6103922017263 | -1.61039220172633 |
| 53 | 25 | 25.2786106610176 | -0.278610661017638 |
| 54 | 24 | 23.1644143582987 | 0.83558564170129 |
| 55 | 28 | 29.2982651013039 | -1.29826510130391 |
| 56 | 25 | 26.1553221268715 | -1.15532212687145 |
| 57 | 31 | 29.2082601399261 | 1.79173986007386 |
| 58 | 24 | 22.3129295867181 | 1.68707041328189 |
| 59 | 24 | 22.9251222136838 | 1.07487778631617 |
| 60 | 33 | 32.8733907799466 | 0.126609220053433 |
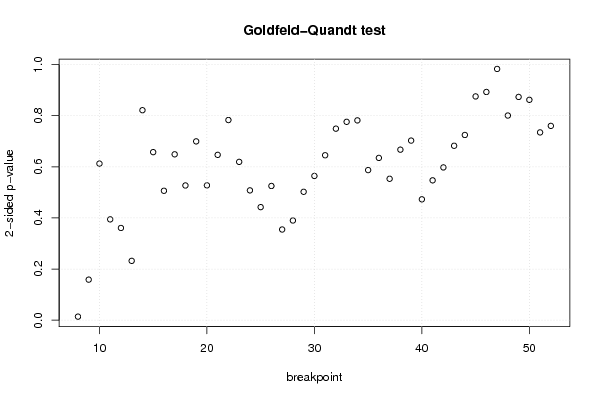
| Goldfeld-Quandt test for Heteroskedasticity | |||
| p-values | Alternative Hypothesis | ||
| breakpoint index | greater | 2-sided | less |
| 8 | 0.0070087772525633 | 0.0140175545051266 | 0.992991222747437 |
| 9 | 0.0793967049220025 | 0.158793409844005 | 0.920603295077998 |
| 10 | 0.306307986825658 | 0.612615973651316 | 0.693692013174342 |
| 11 | 0.197311547925028 | 0.394623095850056 | 0.802688452074972 |
| 12 | 0.180442034373562 | 0.360884068747125 | 0.819557965626438 |
| 13 | 0.116141486241761 | 0.232282972483523 | 0.883858513758239 |
| 14 | 0.410780302190068 | 0.821560604380136 | 0.589219697809932 |
| 15 | 0.328756526339702 | 0.657513052679404 | 0.671243473660298 |
| 16 | 0.253187880015859 | 0.506375760031718 | 0.746812119984141 |
| 17 | 0.324530108140534 | 0.649060216281067 | 0.675469891859466 |
| 18 | 0.263561894853232 | 0.527123789706464 | 0.736438105146768 |
| 19 | 0.650184735938607 | 0.699630528122785 | 0.349815264061393 |
| 20 | 0.736190956386892 | 0.527618087226216 | 0.263809043613108 |
| 21 | 0.676523929042789 | 0.646952141914423 | 0.323476070957211 |
| 22 | 0.608442561827068 | 0.783114876345865 | 0.391557438172932 |
| 23 | 0.690281371224178 | 0.619437257551643 | 0.309718628775822 |
| 24 | 0.746021505985734 | 0.507956988028532 | 0.253978494014266 |
| 25 | 0.778811726498087 | 0.442376547003826 | 0.221188273501913 |
| 26 | 0.737426603249654 | 0.525146793500692 | 0.262573396750346 |
| 27 | 0.822543781264088 | 0.354912437471825 | 0.177456218735912 |
| 28 | 0.804938715315615 | 0.390122569368769 | 0.195061284684385 |
| 29 | 0.74879692494669 | 0.50240615010662 | 0.25120307505331 |
| 30 | 0.717767801278603 | 0.564464397442795 | 0.282232198721397 |
| 31 | 0.677319349851182 | 0.645361300297636 | 0.322680650148818 |
| 32 | 0.625319022726602 | 0.749361954546796 | 0.374680977273398 |
| 33 | 0.611949980070959 | 0.776100039858082 | 0.388050019929041 |
| 34 | 0.609086366618211 | 0.781827266763577 | 0.390913633381789 |
| 35 | 0.706301418800306 | 0.587397162399389 | 0.293698581199694 |
| 36 | 0.68254169695653 | 0.634916606086939 | 0.31745830304347 |
| 37 | 0.723326672437418 | 0.553346655125164 | 0.276673327562582 |
| 38 | 0.66637904087501 | 0.66724191824998 | 0.33362095912499 |
| 39 | 0.648657076016114 | 0.702685847967773 | 0.351342923983886 |
| 40 | 0.763519220596443 | 0.472961558807114 | 0.236480779403557 |
| 41 | 0.726393564856683 | 0.547212870286635 | 0.273606435143317 |
| 42 | 0.701109720521819 | 0.597780558956363 | 0.298890279478181 |
| 43 | 0.658802207368311 | 0.682395585263378 | 0.341197792631689 |
| 44 | 0.637672188462445 | 0.724655623075111 | 0.362327811537555 |
| 45 | 0.562288329343428 | 0.875423341313143 | 0.437711670656572 |
| 46 | 0.553552469562311 | 0.892895060875377 | 0.446447530437689 |
| 47 | 0.491477009698665 | 0.982954019397331 | 0.508522990301335 |
| 48 | 0.400365678447678 | 0.800731356895356 | 0.599634321552322 |
| 49 | 0.436742023079982 | 0.873484046159963 | 0.563257976920018 |
| 50 | 0.431078685454058 | 0.862157370908117 | 0.568921314545942 |
| 51 | 0.367369502670951 | 0.734739005341901 | 0.632630497329049 |
| 52 | 0.380106748074403 | 0.760213496148807 | 0.619893251925597 |
| Meta Analysis of Goldfeld-Quandt test for Heteroskedasticity | |||
| Description | # significant tests | % significant tests | OK/NOK |
| 1% type I error level | 0 | 0 | OK |
| 5% type I error level | 1 | 0.0222222222222222 | OK |
| 10% type I error level | 1 | 0.0222222222222222 | OK |