Free Statistics

of Irreproducible Research!

Author's title

Author*The author of this computation has been verified*
R Software Modulerwasp_multipleregression.wasp
Title produced by softwareMultiple Regression
Date of computationThu, 24 Nov 2011 14:12:28 -0500
Cite this page as followsStatistical Computations at FreeStatistics.org, Office for Research Development and Education, URL https://freestatistics.org/blog/index.php?v=date/2011/Nov/24/t1322161971gg5wieknnpmhvft.htm/, Retrieved Wed, 24 Apr 2024 14:20:07 +0000
Statistical Computations at FreeStatistics.org, Office for Research Development and Education, URL https://freestatistics.org/blog/index.php?pk=147161, Retrieved Wed, 24 Apr 2024 14:20:07 +0000
QR Codes:

Original text written by user:
IsPrivate?No (this computation is public)
User-defined keywords
Estimated Impact74
Family? (F = Feedback message, R = changed R code, M = changed R Module, P = changed Parameters, D = changed Data)
-     [Multiple Regression] [Competence to learn] [2010-11-17 07:43:53] [b98453cac15ba1066b407e146608df68]
- R  D    [Multiple Regression] [WS7] [2011-11-24 19:12:28] [ae47d588931629dc57e50b2172c5fe3b] [Current]
-   PD      [Multiple Regression] [WS7 goed] [2011-11-24 19:21:37] [430266ea0cf3e59522f72a6c9ff36aef]
Feedback Forum

Post a new message
Dataseries X:
6.8	225	0.442	0.672	9.2
6.3	180	0.435	0.797	11.7
6.4	190	0.456	0.761	15.8
6.2	180	0.416	0.651	8.6
6.9	205	0.449	0.9  	23.2
6.4	225	0.431	0.78	    27.4
6.3	185	0.487	0.771	9.3
6.8	235	0.469	0.75	    16
6.9	235	0.435	0.818	4.7
6.7	210	0.48  	0.825	12.5
6.9	245	0.516	0.632	20.1
6.9	245	0.493	0.757	9.1
6.3	185	0.374	0.709	8.1
6.1	185	0.424	0.782	8.6
6.2	180	0.441	0.775	20.3
6.8	220	0.503	0.88	    25
6.5	194	0.503	0.833	19.2
7.6	225	0.425	0.571	3.3
6.3	210	0.371	0.816	11.2
7.1	240	0.504	0.714	10.5
6.8	225	0.4	    0.765	10.1
7.3	263	0.482	0.655	7.2
6.4	210	0.475	0.244	13.6
6.8	235	0.428	0.728	9
7.2	230	0.559	0.721	24.6
6.4	190	0.441	0.757	12.6
6.6	220	0.492	0.747	5.6
6.8	210	0.402	0.739	8.7
6.1	180	0.415	0.713	7.7
6.5	235	0.492	0.742	24.1
6.4	185	0.484	0.861	11.7
6	175	0.387	0.721	7.7
6	192	0.436	0.785	9.6
7.3	263	0.482	0.655	7.2
6.1	180	0.34	    0.821	12.3
6.7	240	0.516	0.728	8.9
6.4	210	0.475	0.846	13.6
5.8	160	0.412	0.813	11.2
6.9	230	0.411	0.595	2.8
7	245	0.407	0.573	3.2
7.3	228	0.445	0.726	9.4
5.9	155	0.291	0.707	11.9
6.2	200	0.449	0.804	15.4
6.8	235	0.546	0.784	7.4
7	235	0.48	    0.744	18.9
5.9	105	0.359	0.839	7.9
6.1	180	0.528	0.79	    12.2
5.7	185	0.352	0.701	11
7.1	245	0.414	0.778	2.8
5.8	180	0.425	0.872	11.8
7.4	240	0.599	0.713	17.1
6.8	225	0.482	0.701	11.6
6.8	215	0.457	0.734	5.8
7	230	0.435	0.764	8.3


Summary of computational transaction
Raw Inputview raw input (R code)
Raw Outputview raw output of R engine
Computing time5 seconds
R Server'George Udny Yule' @ yule.wessa.net

\begin{tabular}{lllllllll}
\hline
Summary of computational transaction \tabularnewline
Raw Input & view raw input (R code)  \tabularnewline
Raw Output & view raw output of R engine  \tabularnewline
Computing time & 5 seconds \tabularnewline
R Server & 'George Udny Yule' @ yule.wessa.net \tabularnewline
\hline
\end{tabular}
%Source: https://freestatistics.org/blog/index.php?pk=147161&T=0

[TABLE]
[ROW][C]Summary of computational transaction[/C][/ROW]
[ROW][C]Raw Input[/C][C]view raw input (R code) [/C][/ROW]
[ROW][C]Raw Output[/C][C]view raw output of R engine [/C][/ROW]
[ROW][C]Computing time[/C][C]5 seconds[/C][/ROW]
[ROW][C]R Server[/C][C]'George Udny Yule' @ yule.wessa.net[/C][/ROW]
[/TABLE]
Source: https://freestatistics.org/blog/index.php?pk=147161&T=0

Globally Unique Identifier (entire table): ba.freestatistics.org/blog/index.php?pk=147161&T=0

As an alternative you can also use a QR Code:  

The GUIDs for individual cells are displayed in the table below:

Summary of computational transaction
Raw Inputview raw input (R code)
Raw Outputview raw output of R engine
Computing time5 seconds
R Server'George Udny Yule' @ yule.wessa.net


Multiple Linear Regression - Estimated Regression Equation
veldgoal[t] = + 0.0370424918019334 + 0.0353032646205693hoogte[t] + 0.000554830562716251gewicht[t] + 0.0320573009846686vrijeworp[t] + 0.00333141873931926puntpergame[t] + e[t]

\begin{tabular}{lllllllll}
\hline
Multiple Linear Regression - Estimated Regression Equation \tabularnewline
veldgoal[t] =  +  0.0370424918019334 +  0.0353032646205693hoogte[t] +  0.000554830562716251gewicht[t] +  0.0320573009846686vrijeworp[t] +  0.00333141873931926puntpergame[t]  + e[t] \tabularnewline
\hline
\end{tabular}
%Source: https://freestatistics.org/blog/index.php?pk=147161&T=1

[TABLE]
[ROW][C]Multiple Linear Regression - Estimated Regression Equation[/C][/ROW]
[ROW][C]veldgoal[t] =  +  0.0370424918019334 +  0.0353032646205693hoogte[t] +  0.000554830562716251gewicht[t] +  0.0320573009846686vrijeworp[t] +  0.00333141873931926puntpergame[t]  + e[t][/C][/ROW]
[/TABLE]
Source: https://freestatistics.org/blog/index.php?pk=147161&T=1

Globally Unique Identifier (entire table): ba.freestatistics.org/blog/index.php?pk=147161&T=1

As an alternative you can also use a QR Code:  

The GUIDs for individual cells are displayed in the table below:

Multiple Linear Regression - Estimated Regression Equation
veldgoal[t] = + 0.0370424918019334 + 0.0353032646205693hoogte[t] + 0.000554830562716251gewicht[t] + 0.0320573009846686vrijeworp[t] + 0.00333141873931926puntpergame[t] + e[t]


Multiple Linear Regression - Ordinary Least Squares
VariableParameterS.D.T-STATH0: parameter = 02-tail p-value1-tail p-value
(Intercept)0.03704249180193340.1238190.29920.7660780.383039
hoogte0.03530326462056930.0246411.43270.1582910.079145
gewicht0.0005548305627162510.0003781.46830.1484220.074211
vrijeworp0.03205730098466860.066820.47980.6335340.316767
puntpergame0.003331418739319260.0010923.05170.0036680.001834

\begin{tabular}{lllllllll}
\hline
Multiple Linear Regression - Ordinary Least Squares \tabularnewline
Variable & Parameter & S.D. & T-STATH0: parameter = 0 & 2-tail p-value & 1-tail p-value \tabularnewline
(Intercept) & 0.0370424918019334 & 0.123819 & 0.2992 & 0.766078 & 0.383039 \tabularnewline
hoogte & 0.0353032646205693 & 0.024641 & 1.4327 & 0.158291 & 0.079145 \tabularnewline
gewicht & 0.000554830562716251 & 0.000378 & 1.4683 & 0.148422 & 0.074211 \tabularnewline
vrijeworp & 0.0320573009846686 & 0.06682 & 0.4798 & 0.633534 & 0.316767 \tabularnewline
puntpergame & 0.00333141873931926 & 0.001092 & 3.0517 & 0.003668 & 0.001834 \tabularnewline
\hline
\end{tabular}
%Source: https://freestatistics.org/blog/index.php?pk=147161&T=2

[TABLE]
[ROW][C]Multiple Linear Regression - Ordinary Least Squares[/C][/ROW]
[ROW][C]Variable[/C][C]Parameter[/C][C]S.D.[/C][C]T-STATH0: parameter = 0[/C][C]2-tail p-value[/C][C]1-tail p-value[/C][/ROW]
[ROW][C](Intercept)[/C][C]0.0370424918019334[/C][C]0.123819[/C][C]0.2992[/C][C]0.766078[/C][C]0.383039[/C][/ROW]
[ROW][C]hoogte[/C][C]0.0353032646205693[/C][C]0.024641[/C][C]1.4327[/C][C]0.158291[/C][C]0.079145[/C][/ROW]
[ROW][C]gewicht[/C][C]0.000554830562716251[/C][C]0.000378[/C][C]1.4683[/C][C]0.148422[/C][C]0.074211[/C][/ROW]
[ROW][C]vrijeworp[/C][C]0.0320573009846686[/C][C]0.06682[/C][C]0.4798[/C][C]0.633534[/C][C]0.316767[/C][/ROW]
[ROW][C]puntpergame[/C][C]0.00333141873931926[/C][C]0.001092[/C][C]3.0517[/C][C]0.003668[/C][C]0.001834[/C][/ROW]
[/TABLE]
Source: https://freestatistics.org/blog/index.php?pk=147161&T=2

Globally Unique Identifier (entire table): ba.freestatistics.org/blog/index.php?pk=147161&T=2

As an alternative you can also use a QR Code:  

The GUIDs for individual cells are displayed in the table below:

Multiple Linear Regression - Ordinary Least Squares
VariableParameterS.D.T-STATH0: parameter = 02-tail p-value1-tail p-value
(Intercept)0.03704249180193340.1238190.29920.7660780.383039
hoogte0.03530326462056930.0246411.43270.1582910.079145
gewicht0.0005548305627162510.0003781.46830.1484220.074211
vrijeworp0.03205730098466860.066820.47980.6335340.316767
puntpergame0.003331418739319260.0010923.05170.0036680.001834


Multiple Linear Regression - Regression Statistics
Multiple R0.641767441548494
R-squared0.411865449031699
Adjusted R-squared0.363854465279185
F-TEST (value)8.57856717027028
F-TEST (DF numerator)4
F-TEST (DF denominator)49
p-value2.49538802317151e-05
Multiple Linear Regression - Residual Statistics
Residual Standard Deviation0.0451046940926362
Sum Squared Residuals0.0996872380303244

\begin{tabular}{lllllllll}
\hline
Multiple Linear Regression - Regression Statistics \tabularnewline
Multiple R & 0.641767441548494 \tabularnewline
R-squared & 0.411865449031699 \tabularnewline
Adjusted R-squared & 0.363854465279185 \tabularnewline
F-TEST (value) & 8.57856717027028 \tabularnewline
F-TEST (DF numerator) & 4 \tabularnewline
F-TEST (DF denominator) & 49 \tabularnewline
p-value & 2.49538802317151e-05 \tabularnewline
Multiple Linear Regression - Residual Statistics \tabularnewline
Residual Standard Deviation & 0.0451046940926362 \tabularnewline
Sum Squared Residuals & 0.0996872380303244 \tabularnewline
\hline
\end{tabular}
%Source: https://freestatistics.org/blog/index.php?pk=147161&T=3

[TABLE]
[ROW][C]Multiple Linear Regression - Regression Statistics[/C][/ROW]
[ROW][C]Multiple R[/C][C]0.641767441548494[/C][/ROW]
[ROW][C]R-squared[/C][C]0.411865449031699[/C][/ROW]
[ROW][C]Adjusted R-squared[/C][C]0.363854465279185[/C][/ROW]
[ROW][C]F-TEST (value)[/C][C]8.57856717027028[/C][/ROW]
[ROW][C]F-TEST (DF numerator)[/C][C]4[/C][/ROW]
[ROW][C]F-TEST (DF denominator)[/C][C]49[/C][/ROW]
[ROW][C]p-value[/C][C]2.49538802317151e-05[/C][/ROW]
[ROW][C]Multiple Linear Regression - Residual Statistics[/C][/ROW]
[ROW][C]Residual Standard Deviation[/C][C]0.0451046940926362[/C][/ROW]
[ROW][C]Sum Squared Residuals[/C][C]0.0996872380303244[/C][/ROW]
[/TABLE]
Source: https://freestatistics.org/blog/index.php?pk=147161&T=3

Globally Unique Identifier (entire table): ba.freestatistics.org/blog/index.php?pk=147161&T=3

As an alternative you can also use a QR Code:  

The GUIDs for individual cells are displayed in the table below:

Multiple Linear Regression - Regression Statistics
Multiple R0.641767441548494
R-squared0.411865449031699
Adjusted R-squared0.363854465279185
F-TEST (value)8.57856717027028
F-TEST (DF numerator)4
F-TEST (DF denominator)49
p-value2.49538802317151e-05
Multiple Linear Regression - Residual Statistics
Residual Standard Deviation0.0451046940926362
Sum Squared Residuals0.0996872380303244


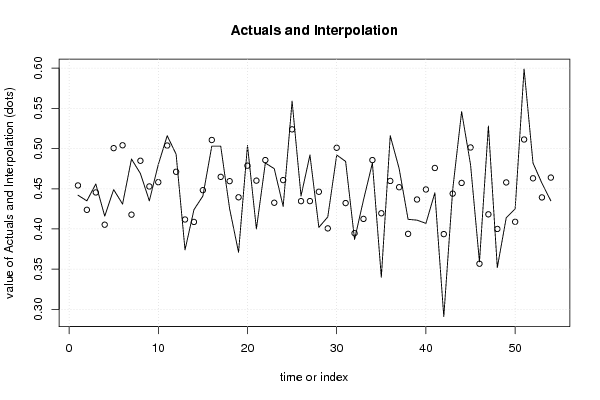
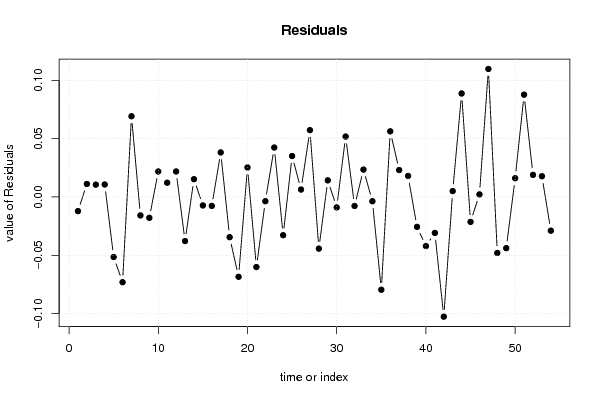
Multiple Linear Regression - Actuals, Interpolation, and Residuals
Time or IndexActualsInterpolationForecastResidualsPrediction Error
10.4420.454133126496396-0.0121331264963955
20.4350.4238498283352610.0111501716647387
30.4560.4454332144202420.0105667855797584
40.4160.4053117378375530.0106882621624469
50.4490.500515768679102-0.0515157686791015
60.4310.504105830210123-0.0731058302101226
70.4870.4177950863488750.069204913651125
80.4690.484835549027733-0.0158355490277332
90.4350.45290074020244-0.0179007402024399
100.480.4581787904840030.0218212095159973
110.5160.5037902364319710.0122097635680294
120.4930.4711517929225420.0218482070774576
130.3740.411809831200642-0.0378098312006424
140.4240.4087550706180690.0152449293819311
150.4410.448264442409687-0.0072644424096873
160.5030.51066330836887-0.00766330836886963
170.5030.4648178125177450.0381821874822548
180.4250.459482580231416-0.0344825802314158
190.3710.439438124565798-0.0684381245657979
200.5040.4787238153257810.0252761846742189
210.40.460112732353357-0.060112732353357
220.4820.48566050859452-0.0036605085945198
230.4750.4326270798389910.0423729201610094
240.4280.460810357230836-0.0328103572308356
250.5590.523903241491970.0350967585080302
260.4410.4346444452504810.00635555474951868
270.4920.4347095108710010.0572904891289988
280.4020.446292797851965-0.0442927978519648
290.4150.4007706871711580.0142293128288418
300.4920.500972603022171-0.00897260302217103
310.4840.4322059748739180.0517940251260817
320.3870.394722666303397-0.00772266630339737
330.4360.4125361487372990.023463851262701
340.4820.48566050859452-0.0036605085945198
350.340.419557401878371-0.079557401878371
360.5160.4597210417084280.056278958291572
370.4750.4519255750317610.0230744249682389
380.4120.3939487922167470.0180512077832533
390.4110.436648113664571-0.025648113664571
400.4070.449128205441437-0.0421282054414366
410.4450.475846628495865-0.0308466284958648
420.2910.393638885078371-0.102638885078371
430.4490.4439667635699030.00503323643009668
440.5460.4572752961030660.0887247038969338
450.480.501364972489965-0.0213649724899648
460.3590.3568032457152580.00219675428474236
470.5280.4182304836739140.109769516326086
480.3520.400032528364449-0.0480325283644493
490.4140.457897711109623-0.0438977111096229
500.4250.4089356354727590.0160643645272413
510.5990.5112701010904740.0877298989095256
520.4820.4630581931993170.0189418068006829
530.4570.4392455498165970.0177544501834031
540.4350.463918927059293-0.0289189270592928

\begin{tabular}{lllllllll}
\hline
Multiple Linear Regression - Actuals, Interpolation, and Residuals \tabularnewline
Time or Index & Actuals & InterpolationForecast & ResidualsPrediction Error \tabularnewline
1 & 0.442 & 0.454133126496396 & -0.0121331264963955 \tabularnewline
2 & 0.435 & 0.423849828335261 & 0.0111501716647387 \tabularnewline
3 & 0.456 & 0.445433214420242 & 0.0105667855797584 \tabularnewline
4 & 0.416 & 0.405311737837553 & 0.0106882621624469 \tabularnewline
5 & 0.449 & 0.500515768679102 & -0.0515157686791015 \tabularnewline
6 & 0.431 & 0.504105830210123 & -0.0731058302101226 \tabularnewline
7 & 0.487 & 0.417795086348875 & 0.069204913651125 \tabularnewline
8 & 0.469 & 0.484835549027733 & -0.0158355490277332 \tabularnewline
9 & 0.435 & 0.45290074020244 & -0.0179007402024399 \tabularnewline
10 & 0.48 & 0.458178790484003 & 0.0218212095159973 \tabularnewline
11 & 0.516 & 0.503790236431971 & 0.0122097635680294 \tabularnewline
12 & 0.493 & 0.471151792922542 & 0.0218482070774576 \tabularnewline
13 & 0.374 & 0.411809831200642 & -0.0378098312006424 \tabularnewline
14 & 0.424 & 0.408755070618069 & 0.0152449293819311 \tabularnewline
15 & 0.441 & 0.448264442409687 & -0.0072644424096873 \tabularnewline
16 & 0.503 & 0.51066330836887 & -0.00766330836886963 \tabularnewline
17 & 0.503 & 0.464817812517745 & 0.0381821874822548 \tabularnewline
18 & 0.425 & 0.459482580231416 & -0.0344825802314158 \tabularnewline
19 & 0.371 & 0.439438124565798 & -0.0684381245657979 \tabularnewline
20 & 0.504 & 0.478723815325781 & 0.0252761846742189 \tabularnewline
21 & 0.4 & 0.460112732353357 & -0.060112732353357 \tabularnewline
22 & 0.482 & 0.48566050859452 & -0.0036605085945198 \tabularnewline
23 & 0.475 & 0.432627079838991 & 0.0423729201610094 \tabularnewline
24 & 0.428 & 0.460810357230836 & -0.0328103572308356 \tabularnewline
25 & 0.559 & 0.52390324149197 & 0.0350967585080302 \tabularnewline
26 & 0.441 & 0.434644445250481 & 0.00635555474951868 \tabularnewline
27 & 0.492 & 0.434709510871001 & 0.0572904891289988 \tabularnewline
28 & 0.402 & 0.446292797851965 & -0.0442927978519648 \tabularnewline
29 & 0.415 & 0.400770687171158 & 0.0142293128288418 \tabularnewline
30 & 0.492 & 0.500972603022171 & -0.00897260302217103 \tabularnewline
31 & 0.484 & 0.432205974873918 & 0.0517940251260817 \tabularnewline
32 & 0.387 & 0.394722666303397 & -0.00772266630339737 \tabularnewline
33 & 0.436 & 0.412536148737299 & 0.023463851262701 \tabularnewline
34 & 0.482 & 0.48566050859452 & -0.0036605085945198 \tabularnewline
35 & 0.34 & 0.419557401878371 & -0.079557401878371 \tabularnewline
36 & 0.516 & 0.459721041708428 & 0.056278958291572 \tabularnewline
37 & 0.475 & 0.451925575031761 & 0.0230744249682389 \tabularnewline
38 & 0.412 & 0.393948792216747 & 0.0180512077832533 \tabularnewline
39 & 0.411 & 0.436648113664571 & -0.025648113664571 \tabularnewline
40 & 0.407 & 0.449128205441437 & -0.0421282054414366 \tabularnewline
41 & 0.445 & 0.475846628495865 & -0.0308466284958648 \tabularnewline
42 & 0.291 & 0.393638885078371 & -0.102638885078371 \tabularnewline
43 & 0.449 & 0.443966763569903 & 0.00503323643009668 \tabularnewline
44 & 0.546 & 0.457275296103066 & 0.0887247038969338 \tabularnewline
45 & 0.48 & 0.501364972489965 & -0.0213649724899648 \tabularnewline
46 & 0.359 & 0.356803245715258 & 0.00219675428474236 \tabularnewline
47 & 0.528 & 0.418230483673914 & 0.109769516326086 \tabularnewline
48 & 0.352 & 0.400032528364449 & -0.0480325283644493 \tabularnewline
49 & 0.414 & 0.457897711109623 & -0.0438977111096229 \tabularnewline
50 & 0.425 & 0.408935635472759 & 0.0160643645272413 \tabularnewline
51 & 0.599 & 0.511270101090474 & 0.0877298989095256 \tabularnewline
52 & 0.482 & 0.463058193199317 & 0.0189418068006829 \tabularnewline
53 & 0.457 & 0.439245549816597 & 0.0177544501834031 \tabularnewline
54 & 0.435 & 0.463918927059293 & -0.0289189270592928 \tabularnewline
\hline
\end{tabular}
%Source: https://freestatistics.org/blog/index.php?pk=147161&T=4

[TABLE]
[ROW][C]Multiple Linear Regression - Actuals, Interpolation, and Residuals[/C][/ROW]
[ROW][C]Time or Index[/C][C]Actuals[/C][C]InterpolationForecast[/C][C]ResidualsPrediction Error[/C][/ROW]
[ROW][C]1[/C][C]0.442[/C][C]0.454133126496396[/C][C]-0.0121331264963955[/C][/ROW]
[ROW][C]2[/C][C]0.435[/C][C]0.423849828335261[/C][C]0.0111501716647387[/C][/ROW]
[ROW][C]3[/C][C]0.456[/C][C]0.445433214420242[/C][C]0.0105667855797584[/C][/ROW]
[ROW][C]4[/C][C]0.416[/C][C]0.405311737837553[/C][C]0.0106882621624469[/C][/ROW]
[ROW][C]5[/C][C]0.449[/C][C]0.500515768679102[/C][C]-0.0515157686791015[/C][/ROW]
[ROW][C]6[/C][C]0.431[/C][C]0.504105830210123[/C][C]-0.0731058302101226[/C][/ROW]
[ROW][C]7[/C][C]0.487[/C][C]0.417795086348875[/C][C]0.069204913651125[/C][/ROW]
[ROW][C]8[/C][C]0.469[/C][C]0.484835549027733[/C][C]-0.0158355490277332[/C][/ROW]
[ROW][C]9[/C][C]0.435[/C][C]0.45290074020244[/C][C]-0.0179007402024399[/C][/ROW]
[ROW][C]10[/C][C]0.48[/C][C]0.458178790484003[/C][C]0.0218212095159973[/C][/ROW]
[ROW][C]11[/C][C]0.516[/C][C]0.503790236431971[/C][C]0.0122097635680294[/C][/ROW]
[ROW][C]12[/C][C]0.493[/C][C]0.471151792922542[/C][C]0.0218482070774576[/C][/ROW]
[ROW][C]13[/C][C]0.374[/C][C]0.411809831200642[/C][C]-0.0378098312006424[/C][/ROW]
[ROW][C]14[/C][C]0.424[/C][C]0.408755070618069[/C][C]0.0152449293819311[/C][/ROW]
[ROW][C]15[/C][C]0.441[/C][C]0.448264442409687[/C][C]-0.0072644424096873[/C][/ROW]
[ROW][C]16[/C][C]0.503[/C][C]0.51066330836887[/C][C]-0.00766330836886963[/C][/ROW]
[ROW][C]17[/C][C]0.503[/C][C]0.464817812517745[/C][C]0.0381821874822548[/C][/ROW]
[ROW][C]18[/C][C]0.425[/C][C]0.459482580231416[/C][C]-0.0344825802314158[/C][/ROW]
[ROW][C]19[/C][C]0.371[/C][C]0.439438124565798[/C][C]-0.0684381245657979[/C][/ROW]
[ROW][C]20[/C][C]0.504[/C][C]0.478723815325781[/C][C]0.0252761846742189[/C][/ROW]
[ROW][C]21[/C][C]0.4[/C][C]0.460112732353357[/C][C]-0.060112732353357[/C][/ROW]
[ROW][C]22[/C][C]0.482[/C][C]0.48566050859452[/C][C]-0.0036605085945198[/C][/ROW]
[ROW][C]23[/C][C]0.475[/C][C]0.432627079838991[/C][C]0.0423729201610094[/C][/ROW]
[ROW][C]24[/C][C]0.428[/C][C]0.460810357230836[/C][C]-0.0328103572308356[/C][/ROW]
[ROW][C]25[/C][C]0.559[/C][C]0.52390324149197[/C][C]0.0350967585080302[/C][/ROW]
[ROW][C]26[/C][C]0.441[/C][C]0.434644445250481[/C][C]0.00635555474951868[/C][/ROW]
[ROW][C]27[/C][C]0.492[/C][C]0.434709510871001[/C][C]0.0572904891289988[/C][/ROW]
[ROW][C]28[/C][C]0.402[/C][C]0.446292797851965[/C][C]-0.0442927978519648[/C][/ROW]
[ROW][C]29[/C][C]0.415[/C][C]0.400770687171158[/C][C]0.0142293128288418[/C][/ROW]
[ROW][C]30[/C][C]0.492[/C][C]0.500972603022171[/C][C]-0.00897260302217103[/C][/ROW]
[ROW][C]31[/C][C]0.484[/C][C]0.432205974873918[/C][C]0.0517940251260817[/C][/ROW]
[ROW][C]32[/C][C]0.387[/C][C]0.394722666303397[/C][C]-0.00772266630339737[/C][/ROW]
[ROW][C]33[/C][C]0.436[/C][C]0.412536148737299[/C][C]0.023463851262701[/C][/ROW]
[ROW][C]34[/C][C]0.482[/C][C]0.48566050859452[/C][C]-0.0036605085945198[/C][/ROW]
[ROW][C]35[/C][C]0.34[/C][C]0.419557401878371[/C][C]-0.079557401878371[/C][/ROW]
[ROW][C]36[/C][C]0.516[/C][C]0.459721041708428[/C][C]0.056278958291572[/C][/ROW]
[ROW][C]37[/C][C]0.475[/C][C]0.451925575031761[/C][C]0.0230744249682389[/C][/ROW]
[ROW][C]38[/C][C]0.412[/C][C]0.393948792216747[/C][C]0.0180512077832533[/C][/ROW]
[ROW][C]39[/C][C]0.411[/C][C]0.436648113664571[/C][C]-0.025648113664571[/C][/ROW]
[ROW][C]40[/C][C]0.407[/C][C]0.449128205441437[/C][C]-0.0421282054414366[/C][/ROW]
[ROW][C]41[/C][C]0.445[/C][C]0.475846628495865[/C][C]-0.0308466284958648[/C][/ROW]
[ROW][C]42[/C][C]0.291[/C][C]0.393638885078371[/C][C]-0.102638885078371[/C][/ROW]
[ROW][C]43[/C][C]0.449[/C][C]0.443966763569903[/C][C]0.00503323643009668[/C][/ROW]
[ROW][C]44[/C][C]0.546[/C][C]0.457275296103066[/C][C]0.0887247038969338[/C][/ROW]
[ROW][C]45[/C][C]0.48[/C][C]0.501364972489965[/C][C]-0.0213649724899648[/C][/ROW]
[ROW][C]46[/C][C]0.359[/C][C]0.356803245715258[/C][C]0.00219675428474236[/C][/ROW]
[ROW][C]47[/C][C]0.528[/C][C]0.418230483673914[/C][C]0.109769516326086[/C][/ROW]
[ROW][C]48[/C][C]0.352[/C][C]0.400032528364449[/C][C]-0.0480325283644493[/C][/ROW]
[ROW][C]49[/C][C]0.414[/C][C]0.457897711109623[/C][C]-0.0438977111096229[/C][/ROW]
[ROW][C]50[/C][C]0.425[/C][C]0.408935635472759[/C][C]0.0160643645272413[/C][/ROW]
[ROW][C]51[/C][C]0.599[/C][C]0.511270101090474[/C][C]0.0877298989095256[/C][/ROW]
[ROW][C]52[/C][C]0.482[/C][C]0.463058193199317[/C][C]0.0189418068006829[/C][/ROW]
[ROW][C]53[/C][C]0.457[/C][C]0.439245549816597[/C][C]0.0177544501834031[/C][/ROW]
[ROW][C]54[/C][C]0.435[/C][C]0.463918927059293[/C][C]-0.0289189270592928[/C][/ROW]
[/TABLE]
Source: https://freestatistics.org/blog/index.php?pk=147161&T=4

Globally Unique Identifier (entire table): ba.freestatistics.org/blog/index.php?pk=147161&T=4

As an alternative you can also use a QR Code:  

The GUIDs for individual cells are displayed in the table below:

Multiple Linear Regression - Actuals, Interpolation, and Residuals
Time or IndexActualsInterpolationForecastResidualsPrediction Error
10.4420.454133126496396-0.0121331264963955
20.4350.4238498283352610.0111501716647387
30.4560.4454332144202420.0105667855797584
40.4160.4053117378375530.0106882621624469
50.4490.500515768679102-0.0515157686791015
60.4310.504105830210123-0.0731058302101226
70.4870.4177950863488750.069204913651125
80.4690.484835549027733-0.0158355490277332
90.4350.45290074020244-0.0179007402024399
100.480.4581787904840030.0218212095159973
110.5160.5037902364319710.0122097635680294
120.4930.4711517929225420.0218482070774576
130.3740.411809831200642-0.0378098312006424
140.4240.4087550706180690.0152449293819311
150.4410.448264442409687-0.0072644424096873
160.5030.51066330836887-0.00766330836886963
170.5030.4648178125177450.0381821874822548
180.4250.459482580231416-0.0344825802314158
190.3710.439438124565798-0.0684381245657979
200.5040.4787238153257810.0252761846742189
210.40.460112732353357-0.060112732353357
220.4820.48566050859452-0.0036605085945198
230.4750.4326270798389910.0423729201610094
240.4280.460810357230836-0.0328103572308356
250.5590.523903241491970.0350967585080302
260.4410.4346444452504810.00635555474951868
270.4920.4347095108710010.0572904891289988
280.4020.446292797851965-0.0442927978519648
290.4150.4007706871711580.0142293128288418
300.4920.500972603022171-0.00897260302217103
310.4840.4322059748739180.0517940251260817
320.3870.394722666303397-0.00772266630339737
330.4360.4125361487372990.023463851262701
340.4820.48566050859452-0.0036605085945198
350.340.419557401878371-0.079557401878371
360.5160.4597210417084280.056278958291572
370.4750.4519255750317610.0230744249682389
380.4120.3939487922167470.0180512077832533
390.4110.436648113664571-0.025648113664571
400.4070.449128205441437-0.0421282054414366
410.4450.475846628495865-0.0308466284958648
420.2910.393638885078371-0.102638885078371
430.4490.4439667635699030.00503323643009668
440.5460.4572752961030660.0887247038969338
450.480.501364972489965-0.0213649724899648
460.3590.3568032457152580.00219675428474236
470.5280.4182304836739140.109769516326086
480.3520.400032528364449-0.0480325283644493
490.4140.457897711109623-0.0438977111096229
500.4250.4089356354727590.0160643645272413
510.5990.5112701010904740.0877298989095256
520.4820.4630581931993170.0189418068006829
530.4570.4392455498165970.0177544501834031
540.4350.463918927059293-0.0289189270592928


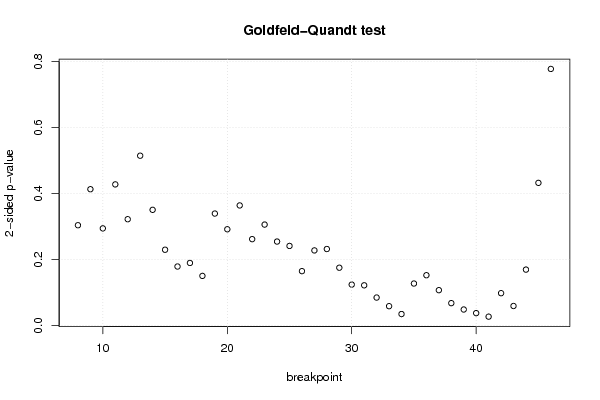
Goldfeld-Quandt test for Heteroskedasticity
p-valuesAlternative Hypothesis
breakpoint indexgreater2-sidedless
80.1521941425275110.3043882850550220.847805857472489
90.2067353118506750.413470623701350.793264688149325
100.1474321590919310.2948643181838620.852567840908069
110.2140637788453550.428127557690710.785936221154645
120.1613057117479460.3226114234958910.838694288252054
130.2574687139213350.514937427842670.742531286078665
140.1755494251283840.3510988502567680.824450574871616
150.1150596017126420.2301192034252830.884940398287358
160.08965990898071560.1793198179614310.910340091019284
170.095043392294750.19008678458950.90495660770525
180.07546768562581330.1509353712516270.924532314374187
190.1698968280756690.3397936561513390.83010317192433
200.1461018291149980.2922036582299950.853898170885002
210.1821849232908150.364369846581630.817815076709185
220.1311021911504650.2622043823009310.868897808849534
230.1531876044813680.3063752089627360.846812395518632
240.127474464747570.254948929495140.87252553525243
250.1208283710785180.2416567421570350.879171628921482
260.08267335209437120.1653467041887420.917326647905629
270.1140607612693290.2281215225386570.885939238730671
280.1161872414545070.2323744829090140.883812758545493
290.08783282485182640.1756656497036530.912167175148174
300.06229681209434950.1245936241886990.93770318790565
310.06122245553890610.1224449110778120.938777544461094
320.04266352273842920.08532704547685850.95733647726157
330.02959394280787340.05918788561574680.970406057192127
340.0176927486250120.03538549725002410.982307251374988
350.06389741412761480.127794828255230.936102585872385
360.07646841653795420.1529368330759080.923531583462046
370.05381775927357920.1076355185471580.94618224072642
380.03417763323138690.06835526646277380.965822366768613
390.02454500520132780.04909001040265550.975454994798672
400.01906482515068960.03812965030137910.98093517484931
410.01372953255325320.02745906510650640.986270467446747
420.04927704150418070.09855408300836150.95072295849582
430.02987177422119140.05974354844238280.970128225778809
440.08497445488105880.1699489097621180.915025545118941
450.2163750385241020.4327500770482040.783624961475898
460.6110897100935530.7778205798128930.388910289906447

\begin{tabular}{lllllllll}
\hline
Goldfeld-Quandt test for Heteroskedasticity \tabularnewline
p-values & Alternative Hypothesis \tabularnewline
breakpoint index & greater & 2-sided & less \tabularnewline
8 & 0.152194142527511 & 0.304388285055022 & 0.847805857472489 \tabularnewline
9 & 0.206735311850675 & 0.41347062370135 & 0.793264688149325 \tabularnewline
10 & 0.147432159091931 & 0.294864318183862 & 0.852567840908069 \tabularnewline
11 & 0.214063778845355 & 0.42812755769071 & 0.785936221154645 \tabularnewline
12 & 0.161305711747946 & 0.322611423495891 & 0.838694288252054 \tabularnewline
13 & 0.257468713921335 & 0.51493742784267 & 0.742531286078665 \tabularnewline
14 & 0.175549425128384 & 0.351098850256768 & 0.824450574871616 \tabularnewline
15 & 0.115059601712642 & 0.230119203425283 & 0.884940398287358 \tabularnewline
16 & 0.0896599089807156 & 0.179319817961431 & 0.910340091019284 \tabularnewline
17 & 0.09504339229475 & 0.1900867845895 & 0.90495660770525 \tabularnewline
18 & 0.0754676856258133 & 0.150935371251627 & 0.924532314374187 \tabularnewline
19 & 0.169896828075669 & 0.339793656151339 & 0.83010317192433 \tabularnewline
20 & 0.146101829114998 & 0.292203658229995 & 0.853898170885002 \tabularnewline
21 & 0.182184923290815 & 0.36436984658163 & 0.817815076709185 \tabularnewline
22 & 0.131102191150465 & 0.262204382300931 & 0.868897808849534 \tabularnewline
23 & 0.153187604481368 & 0.306375208962736 & 0.846812395518632 \tabularnewline
24 & 0.12747446474757 & 0.25494892949514 & 0.87252553525243 \tabularnewline
25 & 0.120828371078518 & 0.241656742157035 & 0.879171628921482 \tabularnewline
26 & 0.0826733520943712 & 0.165346704188742 & 0.917326647905629 \tabularnewline
27 & 0.114060761269329 & 0.228121522538657 & 0.885939238730671 \tabularnewline
28 & 0.116187241454507 & 0.232374482909014 & 0.883812758545493 \tabularnewline
29 & 0.0878328248518264 & 0.175665649703653 & 0.912167175148174 \tabularnewline
30 & 0.0622968120943495 & 0.124593624188699 & 0.93770318790565 \tabularnewline
31 & 0.0612224555389061 & 0.122444911077812 & 0.938777544461094 \tabularnewline
32 & 0.0426635227384292 & 0.0853270454768585 & 0.95733647726157 \tabularnewline
33 & 0.0295939428078734 & 0.0591878856157468 & 0.970406057192127 \tabularnewline
34 & 0.017692748625012 & 0.0353854972500241 & 0.982307251374988 \tabularnewline
35 & 0.0638974141276148 & 0.12779482825523 & 0.936102585872385 \tabularnewline
36 & 0.0764684165379542 & 0.152936833075908 & 0.923531583462046 \tabularnewline
37 & 0.0538177592735792 & 0.107635518547158 & 0.94618224072642 \tabularnewline
38 & 0.0341776332313869 & 0.0683552664627738 & 0.965822366768613 \tabularnewline
39 & 0.0245450052013278 & 0.0490900104026555 & 0.975454994798672 \tabularnewline
40 & 0.0190648251506896 & 0.0381296503013791 & 0.98093517484931 \tabularnewline
41 & 0.0137295325532532 & 0.0274590651065064 & 0.986270467446747 \tabularnewline
42 & 0.0492770415041807 & 0.0985540830083615 & 0.95072295849582 \tabularnewline
43 & 0.0298717742211914 & 0.0597435484423828 & 0.970128225778809 \tabularnewline
44 & 0.0849744548810588 & 0.169948909762118 & 0.915025545118941 \tabularnewline
45 & 0.216375038524102 & 0.432750077048204 & 0.783624961475898 \tabularnewline
46 & 0.611089710093553 & 0.777820579812893 & 0.388910289906447 \tabularnewline
\hline
\end{tabular}
%Source: https://freestatistics.org/blog/index.php?pk=147161&T=5

[TABLE]
[ROW][C]Goldfeld-Quandt test for Heteroskedasticity[/C][/ROW]
[ROW][C]p-values[/C][C]Alternative Hypothesis[/C][/ROW]
[ROW][C]breakpoint index[/C][C]greater[/C][C]2-sided[/C][C]less[/C][/ROW]
[ROW][C]8[/C][C]0.152194142527511[/C][C]0.304388285055022[/C][C]0.847805857472489[/C][/ROW]
[ROW][C]9[/C][C]0.206735311850675[/C][C]0.41347062370135[/C][C]0.793264688149325[/C][/ROW]
[ROW][C]10[/C][C]0.147432159091931[/C][C]0.294864318183862[/C][C]0.852567840908069[/C][/ROW]
[ROW][C]11[/C][C]0.214063778845355[/C][C]0.42812755769071[/C][C]0.785936221154645[/C][/ROW]
[ROW][C]12[/C][C]0.161305711747946[/C][C]0.322611423495891[/C][C]0.838694288252054[/C][/ROW]
[ROW][C]13[/C][C]0.257468713921335[/C][C]0.51493742784267[/C][C]0.742531286078665[/C][/ROW]
[ROW][C]14[/C][C]0.175549425128384[/C][C]0.351098850256768[/C][C]0.824450574871616[/C][/ROW]
[ROW][C]15[/C][C]0.115059601712642[/C][C]0.230119203425283[/C][C]0.884940398287358[/C][/ROW]
[ROW][C]16[/C][C]0.0896599089807156[/C][C]0.179319817961431[/C][C]0.910340091019284[/C][/ROW]
[ROW][C]17[/C][C]0.09504339229475[/C][C]0.1900867845895[/C][C]0.90495660770525[/C][/ROW]
[ROW][C]18[/C][C]0.0754676856258133[/C][C]0.150935371251627[/C][C]0.924532314374187[/C][/ROW]
[ROW][C]19[/C][C]0.169896828075669[/C][C]0.339793656151339[/C][C]0.83010317192433[/C][/ROW]
[ROW][C]20[/C][C]0.146101829114998[/C][C]0.292203658229995[/C][C]0.853898170885002[/C][/ROW]
[ROW][C]21[/C][C]0.182184923290815[/C][C]0.36436984658163[/C][C]0.817815076709185[/C][/ROW]
[ROW][C]22[/C][C]0.131102191150465[/C][C]0.262204382300931[/C][C]0.868897808849534[/C][/ROW]
[ROW][C]23[/C][C]0.153187604481368[/C][C]0.306375208962736[/C][C]0.846812395518632[/C][/ROW]
[ROW][C]24[/C][C]0.12747446474757[/C][C]0.25494892949514[/C][C]0.87252553525243[/C][/ROW]
[ROW][C]25[/C][C]0.120828371078518[/C][C]0.241656742157035[/C][C]0.879171628921482[/C][/ROW]
[ROW][C]26[/C][C]0.0826733520943712[/C][C]0.165346704188742[/C][C]0.917326647905629[/C][/ROW]
[ROW][C]27[/C][C]0.114060761269329[/C][C]0.228121522538657[/C][C]0.885939238730671[/C][/ROW]
[ROW][C]28[/C][C]0.116187241454507[/C][C]0.232374482909014[/C][C]0.883812758545493[/C][/ROW]
[ROW][C]29[/C][C]0.0878328248518264[/C][C]0.175665649703653[/C][C]0.912167175148174[/C][/ROW]
[ROW][C]30[/C][C]0.0622968120943495[/C][C]0.124593624188699[/C][C]0.93770318790565[/C][/ROW]
[ROW][C]31[/C][C]0.0612224555389061[/C][C]0.122444911077812[/C][C]0.938777544461094[/C][/ROW]
[ROW][C]32[/C][C]0.0426635227384292[/C][C]0.0853270454768585[/C][C]0.95733647726157[/C][/ROW]
[ROW][C]33[/C][C]0.0295939428078734[/C][C]0.0591878856157468[/C][C]0.970406057192127[/C][/ROW]
[ROW][C]34[/C][C]0.017692748625012[/C][C]0.0353854972500241[/C][C]0.982307251374988[/C][/ROW]
[ROW][C]35[/C][C]0.0638974141276148[/C][C]0.12779482825523[/C][C]0.936102585872385[/C][/ROW]
[ROW][C]36[/C][C]0.0764684165379542[/C][C]0.152936833075908[/C][C]0.923531583462046[/C][/ROW]
[ROW][C]37[/C][C]0.0538177592735792[/C][C]0.107635518547158[/C][C]0.94618224072642[/C][/ROW]
[ROW][C]38[/C][C]0.0341776332313869[/C][C]0.0683552664627738[/C][C]0.965822366768613[/C][/ROW]
[ROW][C]39[/C][C]0.0245450052013278[/C][C]0.0490900104026555[/C][C]0.975454994798672[/C][/ROW]
[ROW][C]40[/C][C]0.0190648251506896[/C][C]0.0381296503013791[/C][C]0.98093517484931[/C][/ROW]
[ROW][C]41[/C][C]0.0137295325532532[/C][C]0.0274590651065064[/C][C]0.986270467446747[/C][/ROW]
[ROW][C]42[/C][C]0.0492770415041807[/C][C]0.0985540830083615[/C][C]0.95072295849582[/C][/ROW]
[ROW][C]43[/C][C]0.0298717742211914[/C][C]0.0597435484423828[/C][C]0.970128225778809[/C][/ROW]
[ROW][C]44[/C][C]0.0849744548810588[/C][C]0.169948909762118[/C][C]0.915025545118941[/C][/ROW]
[ROW][C]45[/C][C]0.216375038524102[/C][C]0.432750077048204[/C][C]0.783624961475898[/C][/ROW]
[ROW][C]46[/C][C]0.611089710093553[/C][C]0.777820579812893[/C][C]0.388910289906447[/C][/ROW]
[/TABLE]
Source: https://freestatistics.org/blog/index.php?pk=147161&T=5

Globally Unique Identifier (entire table): ba.freestatistics.org/blog/index.php?pk=147161&T=5

As an alternative you can also use a QR Code:  

The GUIDs for individual cells are displayed in the table below:

Goldfeld-Quandt test for Heteroskedasticity
p-valuesAlternative Hypothesis
breakpoint indexgreater2-sidedless
80.1521941425275110.3043882850550220.847805857472489
90.2067353118506750.413470623701350.793264688149325
100.1474321590919310.2948643181838620.852567840908069
110.2140637788453550.428127557690710.785936221154645
120.1613057117479460.3226114234958910.838694288252054
130.2574687139213350.514937427842670.742531286078665
140.1755494251283840.3510988502567680.824450574871616
150.1150596017126420.2301192034252830.884940398287358
160.08965990898071560.1793198179614310.910340091019284
170.095043392294750.19008678458950.90495660770525
180.07546768562581330.1509353712516270.924532314374187
190.1698968280756690.3397936561513390.83010317192433
200.1461018291149980.2922036582299950.853898170885002
210.1821849232908150.364369846581630.817815076709185
220.1311021911504650.2622043823009310.868897808849534
230.1531876044813680.3063752089627360.846812395518632
240.127474464747570.254948929495140.87252553525243
250.1208283710785180.2416567421570350.879171628921482
260.08267335209437120.1653467041887420.917326647905629
270.1140607612693290.2281215225386570.885939238730671
280.1161872414545070.2323744829090140.883812758545493
290.08783282485182640.1756656497036530.912167175148174
300.06229681209434950.1245936241886990.93770318790565
310.06122245553890610.1224449110778120.938777544461094
320.04266352273842920.08532704547685850.95733647726157
330.02959394280787340.05918788561574680.970406057192127
340.0176927486250120.03538549725002410.982307251374988
350.06389741412761480.127794828255230.936102585872385
360.07646841653795420.1529368330759080.923531583462046
370.05381775927357920.1076355185471580.94618224072642
380.03417763323138690.06835526646277380.965822366768613
390.02454500520132780.04909001040265550.975454994798672
400.01906482515068960.03812965030137910.98093517484931
410.01372953255325320.02745906510650640.986270467446747
420.04927704150418070.09855408300836150.95072295849582
430.02987177422119140.05974354844238280.970128225778809
440.08497445488105880.1699489097621180.915025545118941
450.2163750385241020.4327500770482040.783624961475898
460.6110897100935530.7778205798128930.388910289906447


Meta Analysis of Goldfeld-Quandt test for Heteroskedasticity
Description# significant tests% significant testsOK/NOK
1% type I error level00OK
5% type I error level40.102564102564103NOK
10% type I error level90.230769230769231NOK

\begin{tabular}{lllllllll}
\hline
Meta Analysis of Goldfeld-Quandt test for Heteroskedasticity \tabularnewline
Description & # significant tests & % significant tests & OK/NOK \tabularnewline
1% type I error level & 0 & 0 & OK \tabularnewline
5% type I error level & 4 & 0.102564102564103 & NOK \tabularnewline
10% type I error level & 9 & 0.230769230769231 & NOK \tabularnewline
\hline
\end{tabular}
%Source: https://freestatistics.org/blog/index.php?pk=147161&T=6

[TABLE]
[ROW][C]Meta Analysis of Goldfeld-Quandt test for Heteroskedasticity[/C][/ROW]
[ROW][C]Description[/C][C]# significant tests[/C][C]% significant tests[/C][C]OK/NOK[/C][/ROW]
[ROW][C]1% type I error level[/C][C]0[/C][C]0[/C][C]OK[/C][/ROW]
[ROW][C]5% type I error level[/C][C]4[/C][C]0.102564102564103[/C][C]NOK[/C][/ROW]
[ROW][C]10% type I error level[/C][C]9[/C][C]0.230769230769231[/C][C]NOK[/C][/ROW]
[/TABLE]
Source: https://freestatistics.org/blog/index.php?pk=147161&T=6

Globally Unique Identifier (entire table): ba.freestatistics.org/blog/index.php?pk=147161&T=6

As an alternative you can also use a QR Code:  

The GUIDs for individual cells are displayed in the table below:

Meta Analysis of Goldfeld-Quandt test for Heteroskedasticity
Description# significant tests% significant testsOK/NOK
1% type I error level00OK
5% type I error level40.102564102564103NOK
10% type I error level90.230769230769231NOK


Parameters (Session):
par1 = 3 ; par2 = Do not include Seasonal Dummies ; par3 = No Linear Trend ;
Parameters (R input):
par1 = 3 ; par2 = Do not include Seasonal Dummies ; par3 = No Linear Trend ;
R code (references can be found in the software module):
library(lattice)
library(lmtest)
n25 <- 25 #minimum number of obs. for Goldfeld-Quandt test
par1 <- as.numeric(par1)
x <- t(y)
k <- length(x[1,])
n <- length(x[,1])
x1 <- cbind(x[,par1], x[,1:k!=par1])
mycolnames <- c(colnames(x)[par1], colnames(x)[1:k!=par1])
colnames(x1) <- mycolnames #colnames(x)[par1]
x <- x1
if (par3 == 'First Differences'){
x2 <- array(0, dim=c(n-1,k), dimnames=list(1:(n-1), paste('(1-B)',colnames(x),sep='')))
for (i in 1:n-1) {
for (j in 1:k) {
x2[i,j] <- x[i+1,j] - x[i,j]
}
}
x <- x2
}
if (par2 == 'Include Monthly Dummies'){
x2 <- array(0, dim=c(n,11), dimnames=list(1:n, paste('M', seq(1:11), sep ='')))
for (i in 1:11){
x2[seq(i,n,12),i] <- 1
}
x <- cbind(x, x2)
}
if (par2 == 'Include Quarterly Dummies'){
x2 <- array(0, dim=c(n,3), dimnames=list(1:n, paste('Q', seq(1:3), sep ='')))
for (i in 1:3){
x2[seq(i,n,4),i] <- 1
}
x <- cbind(x, x2)
}
k <- length(x[1,])
if (par3 == 'Linear Trend'){
x <- cbind(x, c(1:n))
colnames(x)[k+1] <- 't'
}
x
k <- length(x[1,])
df <- as.data.frame(x)
(mylm <- lm(df))
(mysum <- summary(mylm))
if (n > n25) {
kp3 <- k + 3
nmkm3 <- n - k - 3
gqarr <- array(NA, dim=c(nmkm3-kp3+1,3))
numgqtests <- 0
numsignificant1 <- 0
numsignificant5 <- 0
numsignificant10 <- 0
for (mypoint in kp3:nmkm3) {
j <- 0
numgqtests <- numgqtests + 1
for (myalt in c('greater', 'two.sided', 'less')) {
j <- j + 1
gqarr[mypoint-kp3+1,j] <- gqtest(mylm, point=mypoint, alternative=myalt)$p.value
}
if (gqarr[mypoint-kp3+1,2] < 0.01) numsignificant1 <- numsignificant1 + 1
if (gqarr[mypoint-kp3+1,2] < 0.05) numsignificant5 <- numsignificant5 + 1
if (gqarr[mypoint-kp3+1,2] < 0.10) numsignificant10 <- numsignificant10 + 1
}
gqarr
}
bitmap(file='test0.png')
plot(x[,1], type='l', main='Actuals and Interpolation', ylab='value of Actuals and Interpolation (dots)', xlab='time or index')
points(x[,1]-mysum$resid)
grid()
dev.off()
bitmap(file='test1.png')
plot(mysum$resid, type='b', pch=19, main='Residuals', ylab='value of Residuals', xlab='time or index')
grid()
dev.off()
bitmap(file='test2.png')
hist(mysum$resid, main='Residual Histogram', xlab='values of Residuals')
grid()
dev.off()
bitmap(file='test3.png')
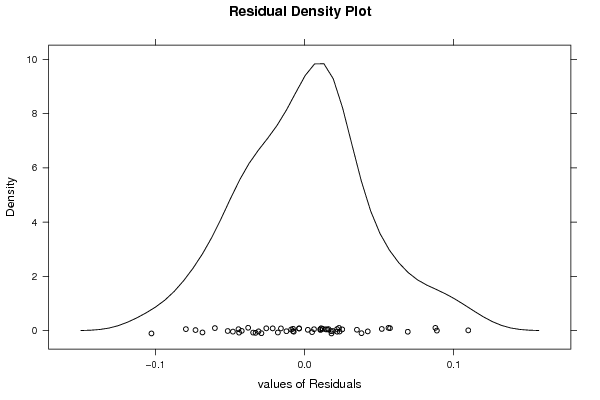
densityplot(~mysum$resid,col='black',main='Residual Density Plot', xlab='values of Residuals')
dev.off()
bitmap(file='test4.png')
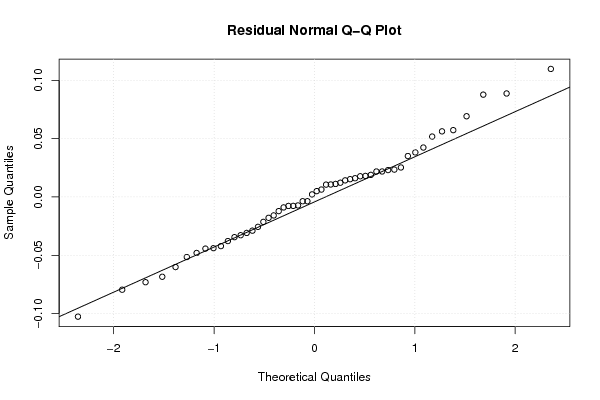
qqnorm(mysum$resid, main='Residual Normal Q-Q Plot')
qqline(mysum$resid)
grid()
dev.off()
(myerror <- as.ts(mysum$resid))
bitmap(file='test5.png')
dum <- cbind(lag(myerror,k=1),myerror)
dum
dum1 <- dum[2:length(myerror),]
dum1
z <- as.data.frame(dum1)
z
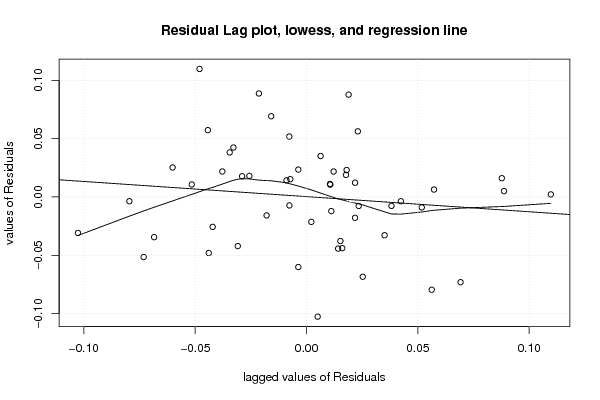
plot(z,main=paste('Residual Lag plot, lowess, and regression line'), ylab='values of Residuals', xlab='lagged values of Residuals')
lines(lowess(z))
abline(lm(z))
grid()
dev.off()
bitmap(file='test6.png')
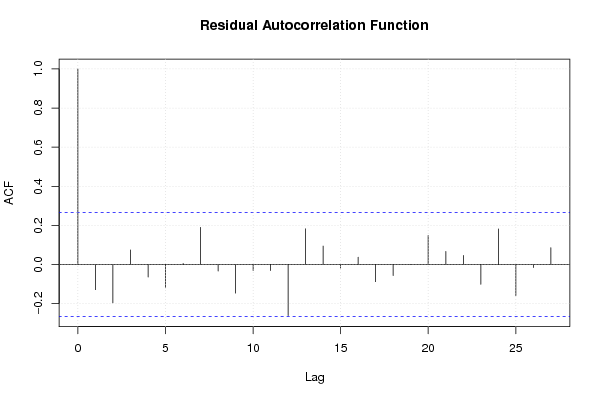
acf(mysum$resid, lag.max=length(mysum$resid)/2, main='Residual Autocorrelation Function')
grid()
dev.off()
bitmap(file='test7.png')
pacf(mysum$resid, lag.max=length(mysum$resid)/2, main='Residual Partial Autocorrelation Function')
grid()
dev.off()
bitmap(file='test8.png')
opar <- par(mfrow = c(2,2), oma = c(0, 0, 1.1, 0))
plot(mylm, las = 1, sub='Residual Diagnostics')
par(opar)
dev.off()
if (n > n25) {
bitmap(file='test9.png')
plot(kp3:nmkm3,gqarr[,2], main='Goldfeld-Quandt test',ylab='2-sided p-value',xlab='breakpoint')
grid()
dev.off()
}
load(file='createtable')
a<-table.start()
a<-table.row.start(a)
a<-table.element(a, 'Multiple Linear Regression - Estimated Regression Equation', 1, TRUE)
a<-table.row.end(a)
myeq <- colnames(x)[1]
myeq <- paste(myeq, '[t] = ', sep='')
for (i in 1:k){
if (mysum$coefficients[i,1] > 0) myeq <- paste(myeq, '+', '')
myeq <- paste(myeq, mysum$coefficients[i,1], sep=' ')
if (rownames(mysum$coefficients)[i] != '(Intercept)') {
myeq <- paste(myeq, rownames(mysum$coefficients)[i], sep='')
if (rownames(mysum$coefficients)[i] != 't') myeq <- paste(myeq, '[t]', sep='')
}
}
myeq <- paste(myeq, ' + e[t]')
a<-table.row.start(a)
a<-table.element(a, myeq)
a<-table.row.end(a)
a<-table.end(a)
table.save(a,file='mytable1.tab')
a<-table.start()
a<-table.row.start(a)
a<-table.element(a,hyperlink('ols1.htm','Multiple Linear Regression - Ordinary Least Squares',''), 6, TRUE)
a<-table.row.end(a)
a<-table.row.start(a)
a<-table.element(a,'Variable',header=TRUE)
a<-table.element(a,'Parameter',header=TRUE)
a<-table.element(a,'S.D.',header=TRUE)
a<-table.element(a,'T-STAT
H0: parameter = 0',header=TRUE)
a<-table.element(a,'2-tail p-value',header=TRUE)
a<-table.element(a,'1-tail p-value',header=TRUE)
a<-table.row.end(a)
for (i in 1:k){
a<-table.row.start(a)
a<-table.element(a,rownames(mysum$coefficients)[i],header=TRUE)
a<-table.element(a,mysum$coefficients[i,1])
a<-table.element(a, round(mysum$coefficients[i,2],6))
a<-table.element(a, round(mysum$coefficients[i,3],4))
a<-table.element(a, round(mysum$coefficients[i,4],6))
a<-table.element(a, round(mysum$coefficients[i,4]/2,6))
a<-table.row.end(a)
}
a<-table.end(a)
table.save(a,file='mytable2.tab')
a<-table.start()
a<-table.row.start(a)
a<-table.element(a, 'Multiple Linear Regression - Regression Statistics', 2, TRUE)
a<-table.row.end(a)
a<-table.row.start(a)
a<-table.element(a, 'Multiple R',1,TRUE)
a<-table.element(a, sqrt(mysum$r.squared))
a<-table.row.end(a)
a<-table.row.start(a)
a<-table.element(a, 'R-squared',1,TRUE)
a<-table.element(a, mysum$r.squared)
a<-table.row.end(a)
a<-table.row.start(a)
a<-table.element(a, 'Adjusted R-squared',1,TRUE)
a<-table.element(a, mysum$adj.r.squared)
a<-table.row.end(a)
a<-table.row.start(a)
a<-table.element(a, 'F-TEST (value)',1,TRUE)
a<-table.element(a, mysum$fstatistic[1])
a<-table.row.end(a)
a<-table.row.start(a)
a<-table.element(a, 'F-TEST (DF numerator)',1,TRUE)
a<-table.element(a, mysum$fstatistic[2])
a<-table.row.end(a)
a<-table.row.start(a)
a<-table.element(a, 'F-TEST (DF denominator)',1,TRUE)
a<-table.element(a, mysum$fstatistic[3])
a<-table.row.end(a)
a<-table.row.start(a)
a<-table.element(a, 'p-value',1,TRUE)
a<-table.element(a, 1-pf(mysum$fstatistic[1],mysum$fstatistic[2],mysum$fstatistic[3]))
a<-table.row.end(a)
a<-table.row.start(a)
a<-table.element(a, 'Multiple Linear Regression - Residual Statistics', 2, TRUE)
a<-table.row.end(a)
a<-table.row.start(a)
a<-table.element(a, 'Residual Standard Deviation',1,TRUE)
a<-table.element(a, mysum$sigma)
a<-table.row.end(a)
a<-table.row.start(a)
a<-table.element(a, 'Sum Squared Residuals',1,TRUE)
a<-table.element(a, sum(myerror*myerror))
a<-table.row.end(a)
a<-table.end(a)
table.save(a,file='mytable3.tab')
a<-table.start()
a<-table.row.start(a)
a<-table.element(a, 'Multiple Linear Regression - Actuals, Interpolation, and Residuals', 4, TRUE)
a<-table.row.end(a)
a<-table.row.start(a)
a<-table.element(a, 'Time or Index', 1, TRUE)
a<-table.element(a, 'Actuals', 1, TRUE)
a<-table.element(a, 'Interpolation
Forecast', 1, TRUE)
a<-table.element(a, 'Residuals
Prediction Error', 1, TRUE)
a<-table.row.end(a)
for (i in 1:n) {
a<-table.row.start(a)
a<-table.element(a,i, 1, TRUE)
a<-table.element(a,x[i])
a<-table.element(a,x[i]-mysum$resid[i])
a<-table.element(a,mysum$resid[i])
a<-table.row.end(a)
}
a<-table.end(a)
table.save(a,file='mytable4.tab')
if (n > n25) {
a<-table.start()
a<-table.row.start(a)
a<-table.element(a,'Goldfeld-Quandt test for Heteroskedasticity',4,TRUE)
a<-table.row.end(a)
a<-table.row.start(a)
a<-table.element(a,'p-values',header=TRUE)
a<-table.element(a,'Alternative Hypothesis',3,header=TRUE)
a<-table.row.end(a)
a<-table.row.start(a)
a<-table.element(a,'breakpoint index',header=TRUE)
a<-table.element(a,'greater',header=TRUE)
a<-table.element(a,'2-sided',header=TRUE)
a<-table.element(a,'less',header=TRUE)
a<-table.row.end(a)
for (mypoint in kp3:nmkm3) {
a<-table.row.start(a)
a<-table.element(a,mypoint,header=TRUE)
a<-table.element(a,gqarr[mypoint-kp3+1,1])
a<-table.element(a,gqarr[mypoint-kp3+1,2])
a<-table.element(a,gqarr[mypoint-kp3+1,3])
a<-table.row.end(a)
}
a<-table.end(a)
table.save(a,file='mytable5.tab')
a<-table.start()
a<-table.row.start(a)
a<-table.element(a,'Meta Analysis of Goldfeld-Quandt test for Heteroskedasticity',4,TRUE)
a<-table.row.end(a)
a<-table.row.start(a)
a<-table.element(a,'Description',header=TRUE)
a<-table.element(a,'# significant tests',header=TRUE)
a<-table.element(a,'% significant tests',header=TRUE)
a<-table.element(a,'OK/NOK',header=TRUE)
a<-table.row.end(a)
a<-table.row.start(a)
a<-table.element(a,'1% type I error level',header=TRUE)
a<-table.element(a,numsignificant1)
a<-table.element(a,numsignificant1/numgqtests)
if (numsignificant1/numgqtests < 0.01) dum <- 'OK' else dum <- 'NOK'
a<-table.element(a,dum)
a<-table.row.end(a)
a<-table.row.start(a)
a<-table.element(a,'5% type I error level',header=TRUE)
a<-table.element(a,numsignificant5)
a<-table.element(a,numsignificant5/numgqtests)
if (numsignificant5/numgqtests < 0.05) dum <- 'OK' else dum <- 'NOK'
a<-table.element(a,dum)
a<-table.row.end(a)
a<-table.row.start(a)
a<-table.element(a,'10% type I error level',header=TRUE)
a<-table.element(a,numsignificant10)
a<-table.element(a,numsignificant10/numgqtests)
if (numsignificant10/numgqtests < 0.1) dum <- 'OK' else dum <- 'NOK'
a<-table.element(a,dum)
a<-table.row.end(a)
a<-table.end(a)
table.save(a,file='mytable6.tab')
}