Free Statistics

of Irreproducible Research!

Author's title

Author*The author of this computation has been verified*
R Software Modulerwasp_multipleregression.wasp
Title produced by softwareMultiple Regression
Date of computationThu, 24 Nov 2011 13:45:56 -0500
Cite this page as followsStatistical Computations at FreeStatistics.org, Office for Research Development and Education, URL https://freestatistics.org/blog/index.php?v=date/2011/Nov/24/t13221604210oybxz2jz1wqj7w.htm/, Retrieved Thu, 25 Apr 2024 01:15:55 +0000
Statistical Computations at FreeStatistics.org, Office for Research Development and Education, URL https://freestatistics.org/blog/index.php?pk=147146, Retrieved Thu, 25 Apr 2024 01:15:55 +0000
QR Codes:

Original text written by user:
IsPrivate?No (this computation is public)
User-defined keywords
Estimated Impact69
Family? (F = Feedback message, R = changed R code, M = changed R Module, P = changed Parameters, D = changed Data)
-       [Multiple Regression] [WS 7 3] [2011-11-24 18:45:56] [850c8b4f3ff1a893cc2b9e9f060c8f7e] [Current]
Feedback Forum

Post a new message
Dataseries X:
119.3	143.7
104.1	124.1
97.1	129.2
97.3	121.9
104.5	124.8
111	129.6
113	125.2
95.4	124.8
86.2	128.3
111.7	129.4
97.5	127.6
99.7	123.7
111.5	129
91.8	118.4
86.3	104.9
88.7	101
95.1	99.5
105.1	106.7
104.5	101.6
89.1	103.2
82.6	104.6
102.7	105.7
91.8	101.1
94.1	98.8
103.1	107.6
93.2	96.9
91	106.4
94.3	102
99.4	105.7
115.7	117
116.8	116
99.8	125.5
96	120.2
115.9	124.1
109.1	111.4
117.3	120.8
109.8	120.2
112.8	124.6
110.7	125.4
100	114.2
113.3	113.6
122.4	110.5
112.5	106.4
104.2	117
92.5	121.9
117.2	114.9
109.3	117.6
106.1	117.6
118.8	125.8
105.3	114.9
106	119.4
102	117.3
112.9	115
116.5	120.9
114.8	117
100.5	117.8
85.4	114
114.6	114.4
109.9	119.6
100.7	113.1
115.5	125.1


Summary of computational transaction
Raw Inputview raw input (R code)
Raw Outputview raw output of R engine
Computing time4 seconds
R Server'Gwilym Jenkins' @ jenkins.wessa.net

\begin{tabular}{lllllllll}
\hline
Summary of computational transaction \tabularnewline
Raw Input & view raw input (R code)  \tabularnewline
Raw Output & view raw output of R engine  \tabularnewline
Computing time & 4 seconds \tabularnewline
R Server & 'Gwilym Jenkins' @ jenkins.wessa.net \tabularnewline
\hline
\end{tabular}
%Source: https://freestatistics.org/blog/index.php?pk=147146&T=0

[TABLE]
[ROW][C]Summary of computational transaction[/C][/ROW]
[ROW][C]Raw Input[/C][C]view raw input (R code) [/C][/ROW]
[ROW][C]Raw Output[/C][C]view raw output of R engine [/C][/ROW]
[ROW][C]Computing time[/C][C]4 seconds[/C][/ROW]
[ROW][C]R Server[/C][C]'Gwilym Jenkins' @ jenkins.wessa.net[/C][/ROW]
[/TABLE]
Source: https://freestatistics.org/blog/index.php?pk=147146&T=0

Globally Unique Identifier (entire table): ba.freestatistics.org/blog/index.php?pk=147146&T=0

As an alternative you can also use a QR Code:  

The GUIDs for individual cells are displayed in the table below:

Summary of computational transaction
Raw Inputview raw input (R code)
Raw Outputview raw output of R engine
Computing time4 seconds
R Server'Gwilym Jenkins' @ jenkins.wessa.net


Multiple Linear Regression - Estimated Regression Equation
IPCN[t] = + 3.05577629606795 + 1.17944461455352TIP[t] -2.12462514013892M1[t] + 0.608831066388448M2[t] + 5.9761607661264M3[t] + 2.56150132861621M4[t] -6.82861542337741M5[t] -12.0520433749389M6[t] -13.3159361355758M7[t] + 8.51911770861693M8[t] + 19.8702928802582M9[t] -8.10532647440436M10[t] + 0.441248635997603M11[t] -0.28951804087561t + e[t]

\begin{tabular}{lllllllll}
\hline
Multiple Linear Regression - Estimated Regression Equation \tabularnewline
IPCN[t] =  +  3.05577629606795 +  1.17944461455352TIP[t] -2.12462514013892M1[t] +  0.608831066388448M2[t] +  5.9761607661264M3[t] +  2.56150132861621M4[t] -6.82861542337741M5[t] -12.0520433749389M6[t] -13.3159361355758M7[t] +  8.51911770861693M8[t] +  19.8702928802582M9[t] -8.10532647440436M10[t] +  0.441248635997603M11[t] -0.28951804087561t  + e[t] \tabularnewline
\hline
\end{tabular}
%Source: https://freestatistics.org/blog/index.php?pk=147146&T=1

[TABLE]
[ROW][C]Multiple Linear Regression - Estimated Regression Equation[/C][/ROW]
[ROW][C]IPCN[t] =  +  3.05577629606795 +  1.17944461455352TIP[t] -2.12462514013892M1[t] +  0.608831066388448M2[t] +  5.9761607661264M3[t] +  2.56150132861621M4[t] -6.82861542337741M5[t] -12.0520433749389M6[t] -13.3159361355758M7[t] +  8.51911770861693M8[t] +  19.8702928802582M9[t] -8.10532647440436M10[t] +  0.441248635997603M11[t] -0.28951804087561t  + e[t][/C][/ROW]
[/TABLE]
Source: https://freestatistics.org/blog/index.php?pk=147146&T=1

Globally Unique Identifier (entire table): ba.freestatistics.org/blog/index.php?pk=147146&T=1

As an alternative you can also use a QR Code:  

The GUIDs for individual cells are displayed in the table below:

Multiple Linear Regression - Estimated Regression Equation
IPCN[t] = + 3.05577629606795 + 1.17944461455352TIP[t] -2.12462514013892M1[t] + 0.608831066388448M2[t] + 5.9761607661264M3[t] + 2.56150132861621M4[t] -6.82861542337741M5[t] -12.0520433749389M6[t] -13.3159361355758M7[t] + 8.51911770861693M8[t] + 19.8702928802582M9[t] -8.10532647440436M10[t] + 0.441248635997603M11[t] -0.28951804087561t + e[t]


Multiple Linear Regression - Ordinary Least Squares
VariableParameterS.D.T-STATH0: parameter = 02-tail p-value1-tail p-value
(Intercept)3.0557762960679515.0705680.20280.8401940.420097
TIP1.179444614553520.1511327.804100
M1-2.124625140138924.307528-0.49320.6241430.312072
M20.6088310663884484.2145670.14450.8857560.442878
M35.97616076612644.2465721.40730.165920.08296
M42.561501328616214.2906810.5970.5533780.276689
M5-6.828615423377414.219926-1.61820.1123150.056158
M6-12.05204337493894.55013-2.64870.0109670.005484
M7-13.31593613557584.439011-2.99980.0043120.002156
M88.519117708616934.25956920.0512980.025649
M919.87029288025824.726964.20360.0001175.8e-05
M10-8.105326474404364.411878-1.83720.0725130.036257
M110.4412486359976034.1861860.10540.9165020.458251
t-0.289518040875610.055948-5.17485e-062e-06

\begin{tabular}{lllllllll}
\hline
Multiple Linear Regression - Ordinary Least Squares \tabularnewline
Variable & Parameter & S.D. & T-STATH0: parameter = 0 & 2-tail p-value & 1-tail p-value \tabularnewline
(Intercept) & 3.05577629606795 & 15.070568 & 0.2028 & 0.840194 & 0.420097 \tabularnewline
TIP & 1.17944461455352 & 0.151132 & 7.8041 & 0 & 0 \tabularnewline
M1 & -2.12462514013892 & 4.307528 & -0.4932 & 0.624143 & 0.312072 \tabularnewline
M2 & 0.608831066388448 & 4.214567 & 0.1445 & 0.885756 & 0.442878 \tabularnewline
M3 & 5.9761607661264 & 4.246572 & 1.4073 & 0.16592 & 0.08296 \tabularnewline
M4 & 2.56150132861621 & 4.290681 & 0.597 & 0.553378 & 0.276689 \tabularnewline
M5 & -6.82861542337741 & 4.219926 & -1.6182 & 0.112315 & 0.056158 \tabularnewline
M6 & -12.0520433749389 & 4.55013 & -2.6487 & 0.010967 & 0.005484 \tabularnewline
M7 & -13.3159361355758 & 4.439011 & -2.9998 & 0.004312 & 0.002156 \tabularnewline
M8 & 8.51911770861693 & 4.259569 & 2 & 0.051298 & 0.025649 \tabularnewline
M9 & 19.8702928802582 & 4.72696 & 4.2036 & 0.000117 & 5.8e-05 \tabularnewline
M10 & -8.10532647440436 & 4.411878 & -1.8372 & 0.072513 & 0.036257 \tabularnewline
M11 & 0.441248635997603 & 4.186186 & 0.1054 & 0.916502 & 0.458251 \tabularnewline
t & -0.28951804087561 & 0.055948 & -5.1748 & 5e-06 & 2e-06 \tabularnewline
\hline
\end{tabular}
%Source: https://freestatistics.org/blog/index.php?pk=147146&T=2

[TABLE]
[ROW][C]Multiple Linear Regression - Ordinary Least Squares[/C][/ROW]
[ROW][C]Variable[/C][C]Parameter[/C][C]S.D.[/C][C]T-STATH0: parameter = 0[/C][C]2-tail p-value[/C][C]1-tail p-value[/C][/ROW]
[ROW][C](Intercept)[/C][C]3.05577629606795[/C][C]15.070568[/C][C]0.2028[/C][C]0.840194[/C][C]0.420097[/C][/ROW]
[ROW][C]TIP[/C][C]1.17944461455352[/C][C]0.151132[/C][C]7.8041[/C][C]0[/C][C]0[/C][/ROW]
[ROW][C]M1[/C][C]-2.12462514013892[/C][C]4.307528[/C][C]-0.4932[/C][C]0.624143[/C][C]0.312072[/C][/ROW]
[ROW][C]M2[/C][C]0.608831066388448[/C][C]4.214567[/C][C]0.1445[/C][C]0.885756[/C][C]0.442878[/C][/ROW]
[ROW][C]M3[/C][C]5.9761607661264[/C][C]4.246572[/C][C]1.4073[/C][C]0.16592[/C][C]0.08296[/C][/ROW]
[ROW][C]M4[/C][C]2.56150132861621[/C][C]4.290681[/C][C]0.597[/C][C]0.553378[/C][C]0.276689[/C][/ROW]
[ROW][C]M5[/C][C]-6.82861542337741[/C][C]4.219926[/C][C]-1.6182[/C][C]0.112315[/C][C]0.056158[/C][/ROW]
[ROW][C]M6[/C][C]-12.0520433749389[/C][C]4.55013[/C][C]-2.6487[/C][C]0.010967[/C][C]0.005484[/C][/ROW]
[ROW][C]M7[/C][C]-13.3159361355758[/C][C]4.439011[/C][C]-2.9998[/C][C]0.004312[/C][C]0.002156[/C][/ROW]
[ROW][C]M8[/C][C]8.51911770861693[/C][C]4.259569[/C][C]2[/C][C]0.051298[/C][C]0.025649[/C][/ROW]
[ROW][C]M9[/C][C]19.8702928802582[/C][C]4.72696[/C][C]4.2036[/C][C]0.000117[/C][C]5.8e-05[/C][/ROW]
[ROW][C]M10[/C][C]-8.10532647440436[/C][C]4.411878[/C][C]-1.8372[/C][C]0.072513[/C][C]0.036257[/C][/ROW]
[ROW][C]M11[/C][C]0.441248635997603[/C][C]4.186186[/C][C]0.1054[/C][C]0.916502[/C][C]0.458251[/C][/ROW]
[ROW][C]t[/C][C]-0.28951804087561[/C][C]0.055948[/C][C]-5.1748[/C][C]5e-06[/C][C]2e-06[/C][/ROW]
[/TABLE]
Source: https://freestatistics.org/blog/index.php?pk=147146&T=2

Globally Unique Identifier (entire table): ba.freestatistics.org/blog/index.php?pk=147146&T=2

As an alternative you can also use a QR Code:  

The GUIDs for individual cells are displayed in the table below:

Multiple Linear Regression - Ordinary Least Squares
VariableParameterS.D.T-STATH0: parameter = 02-tail p-value1-tail p-value
(Intercept)3.0557762960679515.0705680.20280.8401940.420097
TIP1.179444614553520.1511327.804100
M1-2.124625140138924.307528-0.49320.6241430.312072
M20.6088310663884484.2145670.14450.8857560.442878
M35.97616076612644.2465721.40730.165920.08296
M42.561501328616214.2906810.5970.5533780.276689
M5-6.828615423377414.219926-1.61820.1123150.056158
M6-12.05204337493894.55013-2.64870.0109670.005484
M7-13.31593613557584.439011-2.99980.0043120.002156
M88.519117708616934.25956920.0512980.025649
M919.87029288025824.726964.20360.0001175.8e-05
M10-8.105326474404364.411878-1.83720.0725130.036257
M110.4412486359976034.1861860.10540.9165020.458251
t-0.289518040875610.055948-5.17485e-062e-06


Multiple Linear Regression - Regression Statistics
Multiple R0.796926733449986
R-squared0.635092218487265
Adjusted R-squared0.534160278919912
F-TEST (value)6.29228191997108
F-TEST (DF numerator)13
F-TEST (DF denominator)47
p-value1.18025310580361e-06
Multiple Linear Regression - Residual Statistics
Residual Standard Deviation6.61842757381282
Sum Squared Residuals2058.76842684088

\begin{tabular}{lllllllll}
\hline
Multiple Linear Regression - Regression Statistics \tabularnewline
Multiple R & 0.796926733449986 \tabularnewline
R-squared & 0.635092218487265 \tabularnewline
Adjusted R-squared & 0.534160278919912 \tabularnewline
F-TEST (value) & 6.29228191997108 \tabularnewline
F-TEST (DF numerator) & 13 \tabularnewline
F-TEST (DF denominator) & 47 \tabularnewline
p-value & 1.18025310580361e-06 \tabularnewline
Multiple Linear Regression - Residual Statistics \tabularnewline
Residual Standard Deviation & 6.61842757381282 \tabularnewline
Sum Squared Residuals & 2058.76842684088 \tabularnewline
\hline
\end{tabular}
%Source: https://freestatistics.org/blog/index.php?pk=147146&T=3

[TABLE]
[ROW][C]Multiple Linear Regression - Regression Statistics[/C][/ROW]
[ROW][C]Multiple R[/C][C]0.796926733449986[/C][/ROW]
[ROW][C]R-squared[/C][C]0.635092218487265[/C][/ROW]
[ROW][C]Adjusted R-squared[/C][C]0.534160278919912[/C][/ROW]
[ROW][C]F-TEST (value)[/C][C]6.29228191997108[/C][/ROW]
[ROW][C]F-TEST (DF numerator)[/C][C]13[/C][/ROW]
[ROW][C]F-TEST (DF denominator)[/C][C]47[/C][/ROW]
[ROW][C]p-value[/C][C]1.18025310580361e-06[/C][/ROW]
[ROW][C]Multiple Linear Regression - Residual Statistics[/C][/ROW]
[ROW][C]Residual Standard Deviation[/C][C]6.61842757381282[/C][/ROW]
[ROW][C]Sum Squared Residuals[/C][C]2058.76842684088[/C][/ROW]
[/TABLE]
Source: https://freestatistics.org/blog/index.php?pk=147146&T=3

Globally Unique Identifier (entire table): ba.freestatistics.org/blog/index.php?pk=147146&T=3

As an alternative you can also use a QR Code:  

The GUIDs for individual cells are displayed in the table below:

Multiple Linear Regression - Regression Statistics
Multiple R0.796926733449986
R-squared0.635092218487265
Adjusted R-squared0.534160278919912
F-TEST (value)6.29228191997108
F-TEST (DF numerator)13
F-TEST (DF denominator)47
p-value1.18025310580361e-06
Multiple Linear Regression - Residual Statistics
Residual Standard Deviation6.61842757381282
Sum Squared Residuals2058.76842684088


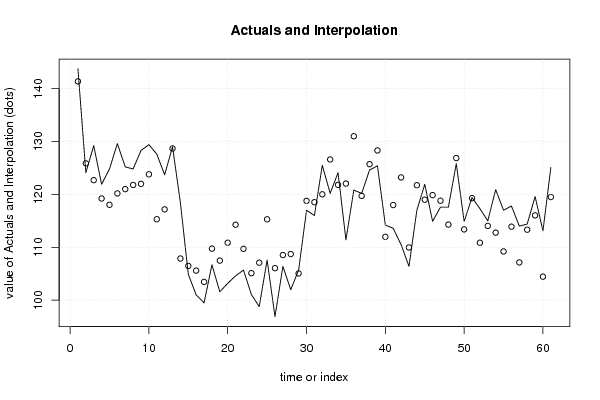
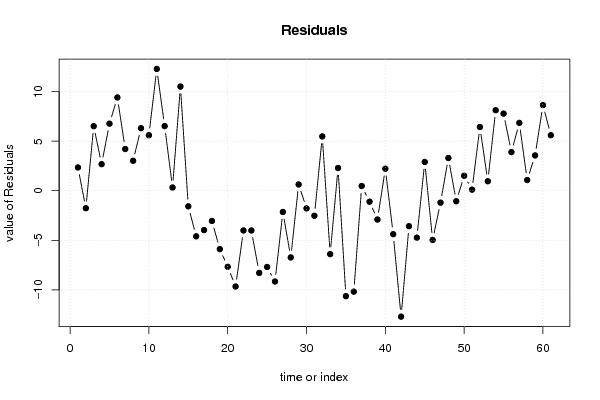
Multiple Linear Regression - Actuals, Interpolation, and Residuals
Time or IndexActualsInterpolationForecastResidualsPrediction Error
1143.7141.3493756312892.35062436871112
2124.1125.865755655727-1.76575565572701
3129.2122.6874550127156.5125449872853
4121.9119.219166457242.68083354276041
5124.8118.0315328891566.76846711084427
6129.6120.1849768913179.41502310868342
7125.2120.9904553189114.20954468108896
8124.8121.7777659060863.02223409391382
9128.3121.9885325829596.31146741704061
10129.4123.7992328585365.6007671414639
11127.6115.30817640140212.2918235985976
12123.7117.1721878765476.52781212345303
13129128.6754911472640.324508852735983
14118.4107.88437040621110.5156295937887
15104.9106.475236685029-1.57523668502931
16101105.601726281572-4.60172628157198
1799.5103.470537021845-3.97053702184528
18106.7109.752037174943-3.05203717494345
19101.6107.490959604699-5.89095960469877
20103.2110.873048343892-7.67304834389165
21104.6114.268315480059-9.66831548005939
22105.7109.710014837047-4.01001483704707
23101.1105.11112560794-4.01112560794002
2498.8107.09308154454-8.29308154453991
25107.6115.293939894507-7.69393989450709
2696.9106.061376376079-9.16137637607897
27106.4108.544409882924-2.14440988292355
28102108.732399632564-6.73239963256439
29105.7105.0679323739180.632067626081871
30117118.779933598704-1.7799335987035
31116118.5239118732-2.52391187319978
32125.5120.0188892291075.48111077089296
33120.2126.598656824569-6.39865682456929
34124.1121.8044672586462.29553274135372
35111.4122.041300949209-10.6413009492086
36120.8130.981980111674-10.1819801116743
37120.2119.7220023215080.477997678491618
38124.6125.704274330821-1.10427433082072
39125.4128.305252299121-2.90525229912066
40114.2111.9810174450122.21898255498785
41113.6117.987996025705-4.38799602570479
42110.5123.207996025705-12.7079960257048
43106.4109.978083540112-3.57808354011231
44117121.734229042635-4.73422904263523
45121.9118.9963841831252.90361581687537
46114.9119.863528767059-4.96352876705852
47117.6118.802973381612-1.20297338161205
48117.6114.2979839381683.30201606183244
49125.8126.862787361983-1.06278736198278
50114.9113.3842232311621.51577676883804
51119.4119.2876461202120.112353879788226
52117.3110.8656901836126.43430981638811
53115114.0420016893760.957998310623937
54120.9112.7750563093328.12494369066833
55117109.2165896630787.7834103369219
56117.8113.896067478283.90393252172012
57114107.1481109292876.85188907071269
58114.4113.3227562787121.07724372128797
59119.6116.0364236598373.56357634016315
60113.1104.4547665290718.64523347092878
61125.1119.4964036434495.60359635655116

\begin{tabular}{lllllllll}
\hline
Multiple Linear Regression - Actuals, Interpolation, and Residuals \tabularnewline
Time or Index & Actuals & InterpolationForecast & ResidualsPrediction Error \tabularnewline
1 & 143.7 & 141.349375631289 & 2.35062436871112 \tabularnewline
2 & 124.1 & 125.865755655727 & -1.76575565572701 \tabularnewline
3 & 129.2 & 122.687455012715 & 6.5125449872853 \tabularnewline
4 & 121.9 & 119.21916645724 & 2.68083354276041 \tabularnewline
5 & 124.8 & 118.031532889156 & 6.76846711084427 \tabularnewline
6 & 129.6 & 120.184976891317 & 9.41502310868342 \tabularnewline
7 & 125.2 & 120.990455318911 & 4.20954468108896 \tabularnewline
8 & 124.8 & 121.777765906086 & 3.02223409391382 \tabularnewline
9 & 128.3 & 121.988532582959 & 6.31146741704061 \tabularnewline
10 & 129.4 & 123.799232858536 & 5.6007671414639 \tabularnewline
11 & 127.6 & 115.308176401402 & 12.2918235985976 \tabularnewline
12 & 123.7 & 117.172187876547 & 6.52781212345303 \tabularnewline
13 & 129 & 128.675491147264 & 0.324508852735983 \tabularnewline
14 & 118.4 & 107.884370406211 & 10.5156295937887 \tabularnewline
15 & 104.9 & 106.475236685029 & -1.57523668502931 \tabularnewline
16 & 101 & 105.601726281572 & -4.60172628157198 \tabularnewline
17 & 99.5 & 103.470537021845 & -3.97053702184528 \tabularnewline
18 & 106.7 & 109.752037174943 & -3.05203717494345 \tabularnewline
19 & 101.6 & 107.490959604699 & -5.89095960469877 \tabularnewline
20 & 103.2 & 110.873048343892 & -7.67304834389165 \tabularnewline
21 & 104.6 & 114.268315480059 & -9.66831548005939 \tabularnewline
22 & 105.7 & 109.710014837047 & -4.01001483704707 \tabularnewline
23 & 101.1 & 105.11112560794 & -4.01112560794002 \tabularnewline
24 & 98.8 & 107.09308154454 & -8.29308154453991 \tabularnewline
25 & 107.6 & 115.293939894507 & -7.69393989450709 \tabularnewline
26 & 96.9 & 106.061376376079 & -9.16137637607897 \tabularnewline
27 & 106.4 & 108.544409882924 & -2.14440988292355 \tabularnewline
28 & 102 & 108.732399632564 & -6.73239963256439 \tabularnewline
29 & 105.7 & 105.067932373918 & 0.632067626081871 \tabularnewline
30 & 117 & 118.779933598704 & -1.7799335987035 \tabularnewline
31 & 116 & 118.5239118732 & -2.52391187319978 \tabularnewline
32 & 125.5 & 120.018889229107 & 5.48111077089296 \tabularnewline
33 & 120.2 & 126.598656824569 & -6.39865682456929 \tabularnewline
34 & 124.1 & 121.804467258646 & 2.29553274135372 \tabularnewline
35 & 111.4 & 122.041300949209 & -10.6413009492086 \tabularnewline
36 & 120.8 & 130.981980111674 & -10.1819801116743 \tabularnewline
37 & 120.2 & 119.722002321508 & 0.477997678491618 \tabularnewline
38 & 124.6 & 125.704274330821 & -1.10427433082072 \tabularnewline
39 & 125.4 & 128.305252299121 & -2.90525229912066 \tabularnewline
40 & 114.2 & 111.981017445012 & 2.21898255498785 \tabularnewline
41 & 113.6 & 117.987996025705 & -4.38799602570479 \tabularnewline
42 & 110.5 & 123.207996025705 & -12.7079960257048 \tabularnewline
43 & 106.4 & 109.978083540112 & -3.57808354011231 \tabularnewline
44 & 117 & 121.734229042635 & -4.73422904263523 \tabularnewline
45 & 121.9 & 118.996384183125 & 2.90361581687537 \tabularnewline
46 & 114.9 & 119.863528767059 & -4.96352876705852 \tabularnewline
47 & 117.6 & 118.802973381612 & -1.20297338161205 \tabularnewline
48 & 117.6 & 114.297983938168 & 3.30201606183244 \tabularnewline
49 & 125.8 & 126.862787361983 & -1.06278736198278 \tabularnewline
50 & 114.9 & 113.384223231162 & 1.51577676883804 \tabularnewline
51 & 119.4 & 119.287646120212 & 0.112353879788226 \tabularnewline
52 & 117.3 & 110.865690183612 & 6.43430981638811 \tabularnewline
53 & 115 & 114.042001689376 & 0.957998310623937 \tabularnewline
54 & 120.9 & 112.775056309332 & 8.12494369066833 \tabularnewline
55 & 117 & 109.216589663078 & 7.7834103369219 \tabularnewline
56 & 117.8 & 113.89606747828 & 3.90393252172012 \tabularnewline
57 & 114 & 107.148110929287 & 6.85188907071269 \tabularnewline
58 & 114.4 & 113.322756278712 & 1.07724372128797 \tabularnewline
59 & 119.6 & 116.036423659837 & 3.56357634016315 \tabularnewline
60 & 113.1 & 104.454766529071 & 8.64523347092878 \tabularnewline
61 & 125.1 & 119.496403643449 & 5.60359635655116 \tabularnewline
\hline
\end{tabular}
%Source: https://freestatistics.org/blog/index.php?pk=147146&T=4

[TABLE]
[ROW][C]Multiple Linear Regression - Actuals, Interpolation, and Residuals[/C][/ROW]
[ROW][C]Time or Index[/C][C]Actuals[/C][C]InterpolationForecast[/C][C]ResidualsPrediction Error[/C][/ROW]
[ROW][C]1[/C][C]143.7[/C][C]141.349375631289[/C][C]2.35062436871112[/C][/ROW]
[ROW][C]2[/C][C]124.1[/C][C]125.865755655727[/C][C]-1.76575565572701[/C][/ROW]
[ROW][C]3[/C][C]129.2[/C][C]122.687455012715[/C][C]6.5125449872853[/C][/ROW]
[ROW][C]4[/C][C]121.9[/C][C]119.21916645724[/C][C]2.68083354276041[/C][/ROW]
[ROW][C]5[/C][C]124.8[/C][C]118.031532889156[/C][C]6.76846711084427[/C][/ROW]
[ROW][C]6[/C][C]129.6[/C][C]120.184976891317[/C][C]9.41502310868342[/C][/ROW]
[ROW][C]7[/C][C]125.2[/C][C]120.990455318911[/C][C]4.20954468108896[/C][/ROW]
[ROW][C]8[/C][C]124.8[/C][C]121.777765906086[/C][C]3.02223409391382[/C][/ROW]
[ROW][C]9[/C][C]128.3[/C][C]121.988532582959[/C][C]6.31146741704061[/C][/ROW]
[ROW][C]10[/C][C]129.4[/C][C]123.799232858536[/C][C]5.6007671414639[/C][/ROW]
[ROW][C]11[/C][C]127.6[/C][C]115.308176401402[/C][C]12.2918235985976[/C][/ROW]
[ROW][C]12[/C][C]123.7[/C][C]117.172187876547[/C][C]6.52781212345303[/C][/ROW]
[ROW][C]13[/C][C]129[/C][C]128.675491147264[/C][C]0.324508852735983[/C][/ROW]
[ROW][C]14[/C][C]118.4[/C][C]107.884370406211[/C][C]10.5156295937887[/C][/ROW]
[ROW][C]15[/C][C]104.9[/C][C]106.475236685029[/C][C]-1.57523668502931[/C][/ROW]
[ROW][C]16[/C][C]101[/C][C]105.601726281572[/C][C]-4.60172628157198[/C][/ROW]
[ROW][C]17[/C][C]99.5[/C][C]103.470537021845[/C][C]-3.97053702184528[/C][/ROW]
[ROW][C]18[/C][C]106.7[/C][C]109.752037174943[/C][C]-3.05203717494345[/C][/ROW]
[ROW][C]19[/C][C]101.6[/C][C]107.490959604699[/C][C]-5.89095960469877[/C][/ROW]
[ROW][C]20[/C][C]103.2[/C][C]110.873048343892[/C][C]-7.67304834389165[/C][/ROW]
[ROW][C]21[/C][C]104.6[/C][C]114.268315480059[/C][C]-9.66831548005939[/C][/ROW]
[ROW][C]22[/C][C]105.7[/C][C]109.710014837047[/C][C]-4.01001483704707[/C][/ROW]
[ROW][C]23[/C][C]101.1[/C][C]105.11112560794[/C][C]-4.01112560794002[/C][/ROW]
[ROW][C]24[/C][C]98.8[/C][C]107.09308154454[/C][C]-8.29308154453991[/C][/ROW]
[ROW][C]25[/C][C]107.6[/C][C]115.293939894507[/C][C]-7.69393989450709[/C][/ROW]
[ROW][C]26[/C][C]96.9[/C][C]106.061376376079[/C][C]-9.16137637607897[/C][/ROW]
[ROW][C]27[/C][C]106.4[/C][C]108.544409882924[/C][C]-2.14440988292355[/C][/ROW]
[ROW][C]28[/C][C]102[/C][C]108.732399632564[/C][C]-6.73239963256439[/C][/ROW]
[ROW][C]29[/C][C]105.7[/C][C]105.067932373918[/C][C]0.632067626081871[/C][/ROW]
[ROW][C]30[/C][C]117[/C][C]118.779933598704[/C][C]-1.7799335987035[/C][/ROW]
[ROW][C]31[/C][C]116[/C][C]118.5239118732[/C][C]-2.52391187319978[/C][/ROW]
[ROW][C]32[/C][C]125.5[/C][C]120.018889229107[/C][C]5.48111077089296[/C][/ROW]
[ROW][C]33[/C][C]120.2[/C][C]126.598656824569[/C][C]-6.39865682456929[/C][/ROW]
[ROW][C]34[/C][C]124.1[/C][C]121.804467258646[/C][C]2.29553274135372[/C][/ROW]
[ROW][C]35[/C][C]111.4[/C][C]122.041300949209[/C][C]-10.6413009492086[/C][/ROW]
[ROW][C]36[/C][C]120.8[/C][C]130.981980111674[/C][C]-10.1819801116743[/C][/ROW]
[ROW][C]37[/C][C]120.2[/C][C]119.722002321508[/C][C]0.477997678491618[/C][/ROW]
[ROW][C]38[/C][C]124.6[/C][C]125.704274330821[/C][C]-1.10427433082072[/C][/ROW]
[ROW][C]39[/C][C]125.4[/C][C]128.305252299121[/C][C]-2.90525229912066[/C][/ROW]
[ROW][C]40[/C][C]114.2[/C][C]111.981017445012[/C][C]2.21898255498785[/C][/ROW]
[ROW][C]41[/C][C]113.6[/C][C]117.987996025705[/C][C]-4.38799602570479[/C][/ROW]
[ROW][C]42[/C][C]110.5[/C][C]123.207996025705[/C][C]-12.7079960257048[/C][/ROW]
[ROW][C]43[/C][C]106.4[/C][C]109.978083540112[/C][C]-3.57808354011231[/C][/ROW]
[ROW][C]44[/C][C]117[/C][C]121.734229042635[/C][C]-4.73422904263523[/C][/ROW]
[ROW][C]45[/C][C]121.9[/C][C]118.996384183125[/C][C]2.90361581687537[/C][/ROW]
[ROW][C]46[/C][C]114.9[/C][C]119.863528767059[/C][C]-4.96352876705852[/C][/ROW]
[ROW][C]47[/C][C]117.6[/C][C]118.802973381612[/C][C]-1.20297338161205[/C][/ROW]
[ROW][C]48[/C][C]117.6[/C][C]114.297983938168[/C][C]3.30201606183244[/C][/ROW]
[ROW][C]49[/C][C]125.8[/C][C]126.862787361983[/C][C]-1.06278736198278[/C][/ROW]
[ROW][C]50[/C][C]114.9[/C][C]113.384223231162[/C][C]1.51577676883804[/C][/ROW]
[ROW][C]51[/C][C]119.4[/C][C]119.287646120212[/C][C]0.112353879788226[/C][/ROW]
[ROW][C]52[/C][C]117.3[/C][C]110.865690183612[/C][C]6.43430981638811[/C][/ROW]
[ROW][C]53[/C][C]115[/C][C]114.042001689376[/C][C]0.957998310623937[/C][/ROW]
[ROW][C]54[/C][C]120.9[/C][C]112.775056309332[/C][C]8.12494369066833[/C][/ROW]
[ROW][C]55[/C][C]117[/C][C]109.216589663078[/C][C]7.7834103369219[/C][/ROW]
[ROW][C]56[/C][C]117.8[/C][C]113.89606747828[/C][C]3.90393252172012[/C][/ROW]
[ROW][C]57[/C][C]114[/C][C]107.148110929287[/C][C]6.85188907071269[/C][/ROW]
[ROW][C]58[/C][C]114.4[/C][C]113.322756278712[/C][C]1.07724372128797[/C][/ROW]
[ROW][C]59[/C][C]119.6[/C][C]116.036423659837[/C][C]3.56357634016315[/C][/ROW]
[ROW][C]60[/C][C]113.1[/C][C]104.454766529071[/C][C]8.64523347092878[/C][/ROW]
[ROW][C]61[/C][C]125.1[/C][C]119.496403643449[/C][C]5.60359635655116[/C][/ROW]
[/TABLE]
Source: https://freestatistics.org/blog/index.php?pk=147146&T=4

Globally Unique Identifier (entire table): ba.freestatistics.org/blog/index.php?pk=147146&T=4

As an alternative you can also use a QR Code:  

The GUIDs for individual cells are displayed in the table below:

Multiple Linear Regression - Actuals, Interpolation, and Residuals
Time or IndexActualsInterpolationForecastResidualsPrediction Error
1143.7141.3493756312892.35062436871112
2124.1125.865755655727-1.76575565572701
3129.2122.6874550127156.5125449872853
4121.9119.219166457242.68083354276041
5124.8118.0315328891566.76846711084427
6129.6120.1849768913179.41502310868342
7125.2120.9904553189114.20954468108896
8124.8121.7777659060863.02223409391382
9128.3121.9885325829596.31146741704061
10129.4123.7992328585365.6007671414639
11127.6115.30817640140212.2918235985976
12123.7117.1721878765476.52781212345303
13129128.6754911472640.324508852735983
14118.4107.88437040621110.5156295937887
15104.9106.475236685029-1.57523668502931
16101105.601726281572-4.60172628157198
1799.5103.470537021845-3.97053702184528
18106.7109.752037174943-3.05203717494345
19101.6107.490959604699-5.89095960469877
20103.2110.873048343892-7.67304834389165
21104.6114.268315480059-9.66831548005939
22105.7109.710014837047-4.01001483704707
23101.1105.11112560794-4.01112560794002
2498.8107.09308154454-8.29308154453991
25107.6115.293939894507-7.69393989450709
2696.9106.061376376079-9.16137637607897
27106.4108.544409882924-2.14440988292355
28102108.732399632564-6.73239963256439
29105.7105.0679323739180.632067626081871
30117118.779933598704-1.7799335987035
31116118.5239118732-2.52391187319978
32125.5120.0188892291075.48111077089296
33120.2126.598656824569-6.39865682456929
34124.1121.8044672586462.29553274135372
35111.4122.041300949209-10.6413009492086
36120.8130.981980111674-10.1819801116743
37120.2119.7220023215080.477997678491618
38124.6125.704274330821-1.10427433082072
39125.4128.305252299121-2.90525229912066
40114.2111.9810174450122.21898255498785
41113.6117.987996025705-4.38799602570479
42110.5123.207996025705-12.7079960257048
43106.4109.978083540112-3.57808354011231
44117121.734229042635-4.73422904263523
45121.9118.9963841831252.90361581687537
46114.9119.863528767059-4.96352876705852
47117.6118.802973381612-1.20297338161205
48117.6114.2979839381683.30201606183244
49125.8126.862787361983-1.06278736198278
50114.9113.3842232311621.51577676883804
51119.4119.2876461202120.112353879788226
52117.3110.8656901836126.43430981638811
53115114.0420016893760.957998310623937
54120.9112.7750563093328.12494369066833
55117109.2165896630787.7834103369219
56117.8113.896067478283.90393252172012
57114107.1481109292876.85188907071269
58114.4113.3227562787121.07724372128797
59119.6116.0364236598373.56357634016315
60113.1104.4547665290718.64523347092878
61125.1119.4964036434495.60359635655116


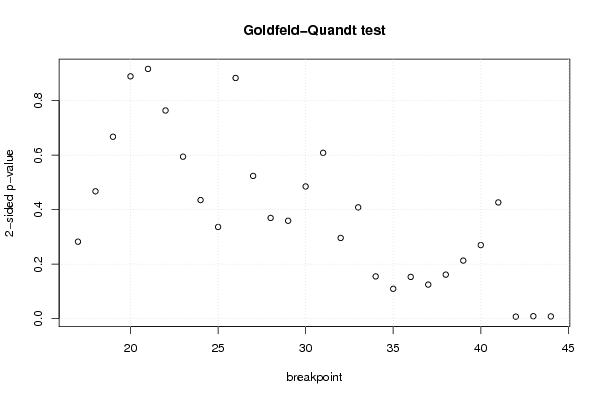
Goldfeld-Quandt test for Heteroskedasticity
p-valuesAlternative Hypothesis
breakpoint indexgreater2-sidedless
170.8587520757764840.2824958484470320.141247924223516
180.7662111691854370.4675776616291260.233788830814563
190.6661133739333280.6677732521333450.333886626066672
200.5551965431095130.8896069137809750.444803456890487
210.4583389447806740.9166778895613480.541661055219326
220.3820901144233040.7641802288466090.617909885576696
230.2972552620063920.5945105240127840.702744737993608
240.2177040445251630.4354080890503260.782295955474837
250.1682707425245720.3365414850491450.831729257475428
260.4417660499793990.8835320999587990.558233950020601
270.7380229121779270.5239541756441450.261977087822073
280.8150748734345920.3698502531308170.184925126565408
290.820328384392880.3593432312142390.17967161560712
300.7573574858638070.4852850282723860.242642514136193
310.6956146008098250.6087707983803510.304385399190175
320.8518414037445020.2963171925109950.148158596255498
330.7956950673835090.4086098652329810.204304932616491
340.9224635051964570.1550729896070870.0775364948035434
350.9451968201376020.1096063597247970.0548031798623984
360.9233367367247040.1533265265505920.0766632632752961
370.9375105166917940.1249789666164120.0624894833082061
380.9192068263267890.1615863473464230.0807931736732114
390.8934514026238570.2130971947522850.106548597376142
400.8649888099512180.2700223800975640.135011190048782
410.7866703067519020.4266593864961970.213329693248098
420.9963160121995760.007367975600848260.00368398780042413
430.9954617760675510.009076447864897530.00453822393244877
440.9958779373852850.008244125229429250.00412206261471463

\begin{tabular}{lllllllll}
\hline
Goldfeld-Quandt test for Heteroskedasticity \tabularnewline
p-values & Alternative Hypothesis \tabularnewline
breakpoint index & greater & 2-sided & less \tabularnewline
17 & 0.858752075776484 & 0.282495848447032 & 0.141247924223516 \tabularnewline
18 & 0.766211169185437 & 0.467577661629126 & 0.233788830814563 \tabularnewline
19 & 0.666113373933328 & 0.667773252133345 & 0.333886626066672 \tabularnewline
20 & 0.555196543109513 & 0.889606913780975 & 0.444803456890487 \tabularnewline
21 & 0.458338944780674 & 0.916677889561348 & 0.541661055219326 \tabularnewline
22 & 0.382090114423304 & 0.764180228846609 & 0.617909885576696 \tabularnewline
23 & 0.297255262006392 & 0.594510524012784 & 0.702744737993608 \tabularnewline
24 & 0.217704044525163 & 0.435408089050326 & 0.782295955474837 \tabularnewline
25 & 0.168270742524572 & 0.336541485049145 & 0.831729257475428 \tabularnewline
26 & 0.441766049979399 & 0.883532099958799 & 0.558233950020601 \tabularnewline
27 & 0.738022912177927 & 0.523954175644145 & 0.261977087822073 \tabularnewline
28 & 0.815074873434592 & 0.369850253130817 & 0.184925126565408 \tabularnewline
29 & 0.82032838439288 & 0.359343231214239 & 0.17967161560712 \tabularnewline
30 & 0.757357485863807 & 0.485285028272386 & 0.242642514136193 \tabularnewline
31 & 0.695614600809825 & 0.608770798380351 & 0.304385399190175 \tabularnewline
32 & 0.851841403744502 & 0.296317192510995 & 0.148158596255498 \tabularnewline
33 & 0.795695067383509 & 0.408609865232981 & 0.204304932616491 \tabularnewline
34 & 0.922463505196457 & 0.155072989607087 & 0.0775364948035434 \tabularnewline
35 & 0.945196820137602 & 0.109606359724797 & 0.0548031798623984 \tabularnewline
36 & 0.923336736724704 & 0.153326526550592 & 0.0766632632752961 \tabularnewline
37 & 0.937510516691794 & 0.124978966616412 & 0.0624894833082061 \tabularnewline
38 & 0.919206826326789 & 0.161586347346423 & 0.0807931736732114 \tabularnewline
39 & 0.893451402623857 & 0.213097194752285 & 0.106548597376142 \tabularnewline
40 & 0.864988809951218 & 0.270022380097564 & 0.135011190048782 \tabularnewline
41 & 0.786670306751902 & 0.426659386496197 & 0.213329693248098 \tabularnewline
42 & 0.996316012199576 & 0.00736797560084826 & 0.00368398780042413 \tabularnewline
43 & 0.995461776067551 & 0.00907644786489753 & 0.00453822393244877 \tabularnewline
44 & 0.995877937385285 & 0.00824412522942925 & 0.00412206261471463 \tabularnewline
\hline
\end{tabular}
%Source: https://freestatistics.org/blog/index.php?pk=147146&T=5

[TABLE]
[ROW][C]Goldfeld-Quandt test for Heteroskedasticity[/C][/ROW]
[ROW][C]p-values[/C][C]Alternative Hypothesis[/C][/ROW]
[ROW][C]breakpoint index[/C][C]greater[/C][C]2-sided[/C][C]less[/C][/ROW]
[ROW][C]17[/C][C]0.858752075776484[/C][C]0.282495848447032[/C][C]0.141247924223516[/C][/ROW]
[ROW][C]18[/C][C]0.766211169185437[/C][C]0.467577661629126[/C][C]0.233788830814563[/C][/ROW]
[ROW][C]19[/C][C]0.666113373933328[/C][C]0.667773252133345[/C][C]0.333886626066672[/C][/ROW]
[ROW][C]20[/C][C]0.555196543109513[/C][C]0.889606913780975[/C][C]0.444803456890487[/C][/ROW]
[ROW][C]21[/C][C]0.458338944780674[/C][C]0.916677889561348[/C][C]0.541661055219326[/C][/ROW]
[ROW][C]22[/C][C]0.382090114423304[/C][C]0.764180228846609[/C][C]0.617909885576696[/C][/ROW]
[ROW][C]23[/C][C]0.297255262006392[/C][C]0.594510524012784[/C][C]0.702744737993608[/C][/ROW]
[ROW][C]24[/C][C]0.217704044525163[/C][C]0.435408089050326[/C][C]0.782295955474837[/C][/ROW]
[ROW][C]25[/C][C]0.168270742524572[/C][C]0.336541485049145[/C][C]0.831729257475428[/C][/ROW]
[ROW][C]26[/C][C]0.441766049979399[/C][C]0.883532099958799[/C][C]0.558233950020601[/C][/ROW]
[ROW][C]27[/C][C]0.738022912177927[/C][C]0.523954175644145[/C][C]0.261977087822073[/C][/ROW]
[ROW][C]28[/C][C]0.815074873434592[/C][C]0.369850253130817[/C][C]0.184925126565408[/C][/ROW]
[ROW][C]29[/C][C]0.82032838439288[/C][C]0.359343231214239[/C][C]0.17967161560712[/C][/ROW]
[ROW][C]30[/C][C]0.757357485863807[/C][C]0.485285028272386[/C][C]0.242642514136193[/C][/ROW]
[ROW][C]31[/C][C]0.695614600809825[/C][C]0.608770798380351[/C][C]0.304385399190175[/C][/ROW]
[ROW][C]32[/C][C]0.851841403744502[/C][C]0.296317192510995[/C][C]0.148158596255498[/C][/ROW]
[ROW][C]33[/C][C]0.795695067383509[/C][C]0.408609865232981[/C][C]0.204304932616491[/C][/ROW]
[ROW][C]34[/C][C]0.922463505196457[/C][C]0.155072989607087[/C][C]0.0775364948035434[/C][/ROW]
[ROW][C]35[/C][C]0.945196820137602[/C][C]0.109606359724797[/C][C]0.0548031798623984[/C][/ROW]
[ROW][C]36[/C][C]0.923336736724704[/C][C]0.153326526550592[/C][C]0.0766632632752961[/C][/ROW]
[ROW][C]37[/C][C]0.937510516691794[/C][C]0.124978966616412[/C][C]0.0624894833082061[/C][/ROW]
[ROW][C]38[/C][C]0.919206826326789[/C][C]0.161586347346423[/C][C]0.0807931736732114[/C][/ROW]
[ROW][C]39[/C][C]0.893451402623857[/C][C]0.213097194752285[/C][C]0.106548597376142[/C][/ROW]
[ROW][C]40[/C][C]0.864988809951218[/C][C]0.270022380097564[/C][C]0.135011190048782[/C][/ROW]
[ROW][C]41[/C][C]0.786670306751902[/C][C]0.426659386496197[/C][C]0.213329693248098[/C][/ROW]
[ROW][C]42[/C][C]0.996316012199576[/C][C]0.00736797560084826[/C][C]0.00368398780042413[/C][/ROW]
[ROW][C]43[/C][C]0.995461776067551[/C][C]0.00907644786489753[/C][C]0.00453822393244877[/C][/ROW]
[ROW][C]44[/C][C]0.995877937385285[/C][C]0.00824412522942925[/C][C]0.00412206261471463[/C][/ROW]
[/TABLE]
Source: https://freestatistics.org/blog/index.php?pk=147146&T=5

Globally Unique Identifier (entire table): ba.freestatistics.org/blog/index.php?pk=147146&T=5

As an alternative you can also use a QR Code:  

The GUIDs for individual cells are displayed in the table below:

Goldfeld-Quandt test for Heteroskedasticity
p-valuesAlternative Hypothesis
breakpoint indexgreater2-sidedless
170.8587520757764840.2824958484470320.141247924223516
180.7662111691854370.4675776616291260.233788830814563
190.6661133739333280.6677732521333450.333886626066672
200.5551965431095130.8896069137809750.444803456890487
210.4583389447806740.9166778895613480.541661055219326
220.3820901144233040.7641802288466090.617909885576696
230.2972552620063920.5945105240127840.702744737993608
240.2177040445251630.4354080890503260.782295955474837
250.1682707425245720.3365414850491450.831729257475428
260.4417660499793990.8835320999587990.558233950020601
270.7380229121779270.5239541756441450.261977087822073
280.8150748734345920.3698502531308170.184925126565408
290.820328384392880.3593432312142390.17967161560712
300.7573574858638070.4852850282723860.242642514136193
310.6956146008098250.6087707983803510.304385399190175
320.8518414037445020.2963171925109950.148158596255498
330.7956950673835090.4086098652329810.204304932616491
340.9224635051964570.1550729896070870.0775364948035434
350.9451968201376020.1096063597247970.0548031798623984
360.9233367367247040.1533265265505920.0766632632752961
370.9375105166917940.1249789666164120.0624894833082061
380.9192068263267890.1615863473464230.0807931736732114
390.8934514026238570.2130971947522850.106548597376142
400.8649888099512180.2700223800975640.135011190048782
410.7866703067519020.4266593864961970.213329693248098
420.9963160121995760.007367975600848260.00368398780042413
430.9954617760675510.009076447864897530.00453822393244877
440.9958779373852850.008244125229429250.00412206261471463


Meta Analysis of Goldfeld-Quandt test for Heteroskedasticity
Description# significant tests% significant testsOK/NOK
1% type I error level30.107142857142857NOK
5% type I error level30.107142857142857NOK
10% type I error level30.107142857142857NOK

\begin{tabular}{lllllllll}
\hline
Meta Analysis of Goldfeld-Quandt test for Heteroskedasticity \tabularnewline
Description & # significant tests & % significant tests & OK/NOK \tabularnewline
1% type I error level & 3 & 0.107142857142857 & NOK \tabularnewline
5% type I error level & 3 & 0.107142857142857 & NOK \tabularnewline
10% type I error level & 3 & 0.107142857142857 & NOK \tabularnewline
\hline
\end{tabular}
%Source: https://freestatistics.org/blog/index.php?pk=147146&T=6

[TABLE]
[ROW][C]Meta Analysis of Goldfeld-Quandt test for Heteroskedasticity[/C][/ROW]
[ROW][C]Description[/C][C]# significant tests[/C][C]% significant tests[/C][C]OK/NOK[/C][/ROW]
[ROW][C]1% type I error level[/C][C]3[/C][C]0.107142857142857[/C][C]NOK[/C][/ROW]
[ROW][C]5% type I error level[/C][C]3[/C][C]0.107142857142857[/C][C]NOK[/C][/ROW]
[ROW][C]10% type I error level[/C][C]3[/C][C]0.107142857142857[/C][C]NOK[/C][/ROW]
[/TABLE]
Source: https://freestatistics.org/blog/index.php?pk=147146&T=6

Globally Unique Identifier (entire table): ba.freestatistics.org/blog/index.php?pk=147146&T=6

As an alternative you can also use a QR Code:  

The GUIDs for individual cells are displayed in the table below:

Meta Analysis of Goldfeld-Quandt test for Heteroskedasticity
Description# significant tests% significant testsOK/NOK
1% type I error level30.107142857142857NOK
5% type I error level30.107142857142857NOK
10% type I error level30.107142857142857NOK


Parameters (Session):
par1 = 2 ; par2 = Include Monthly Dummies ; par3 = Linear Trend ;
Parameters (R input):
par1 = 2 ; par2 = Include Monthly Dummies ; par3 = Linear Trend ;
R code (references can be found in the software module):
library(lattice)
library(lmtest)
n25 <- 25 #minimum number of obs. for Goldfeld-Quandt test
par1 <- as.numeric(par1)
x <- t(y)
k <- length(x[1,])
n <- length(x[,1])
x1 <- cbind(x[,par1], x[,1:k!=par1])
mycolnames <- c(colnames(x)[par1], colnames(x)[1:k!=par1])
colnames(x1) <- mycolnames #colnames(x)[par1]
x <- x1
if (par3 == 'First Differences'){
x2 <- array(0, dim=c(n-1,k), dimnames=list(1:(n-1), paste('(1-B)',colnames(x),sep='')))
for (i in 1:n-1) {
for (j in 1:k) {
x2[i,j] <- x[i+1,j] - x[i,j]
}
}
x <- x2
}
if (par2 == 'Include Monthly Dummies'){
x2 <- array(0, dim=c(n,11), dimnames=list(1:n, paste('M', seq(1:11), sep ='')))
for (i in 1:11){
x2[seq(i,n,12),i] <- 1
}
x <- cbind(x, x2)
}
if (par2 == 'Include Quarterly Dummies'){
x2 <- array(0, dim=c(n,3), dimnames=list(1:n, paste('Q', seq(1:3), sep ='')))
for (i in 1:3){
x2[seq(i,n,4),i] <- 1
}
x <- cbind(x, x2)
}
k <- length(x[1,])
if (par3 == 'Linear Trend'){
x <- cbind(x, c(1:n))
colnames(x)[k+1] <- 't'
}
x
k <- length(x[1,])
df <- as.data.frame(x)
(mylm <- lm(df))
(mysum <- summary(mylm))
if (n > n25) {
kp3 <- k + 3
nmkm3 <- n - k - 3
gqarr <- array(NA, dim=c(nmkm3-kp3+1,3))
numgqtests <- 0
numsignificant1 <- 0
numsignificant5 <- 0
numsignificant10 <- 0
for (mypoint in kp3:nmkm3) {
j <- 0
numgqtests <- numgqtests + 1
for (myalt in c('greater', 'two.sided', 'less')) {
j <- j + 1
gqarr[mypoint-kp3+1,j] <- gqtest(mylm, point=mypoint, alternative=myalt)$p.value
}
if (gqarr[mypoint-kp3+1,2] < 0.01) numsignificant1 <- numsignificant1 + 1
if (gqarr[mypoint-kp3+1,2] < 0.05) numsignificant5 <- numsignificant5 + 1
if (gqarr[mypoint-kp3+1,2] < 0.10) numsignificant10 <- numsignificant10 + 1
}
gqarr
}
bitmap(file='test0.png')
plot(x[,1], type='l', main='Actuals and Interpolation', ylab='value of Actuals and Interpolation (dots)', xlab='time or index')
points(x[,1]-mysum$resid)
grid()
dev.off()
bitmap(file='test1.png')
plot(mysum$resid, type='b', pch=19, main='Residuals', ylab='value of Residuals', xlab='time or index')
grid()
dev.off()
bitmap(file='test2.png')
hist(mysum$resid, main='Residual Histogram', xlab='values of Residuals')
grid()
dev.off()
bitmap(file='test3.png')
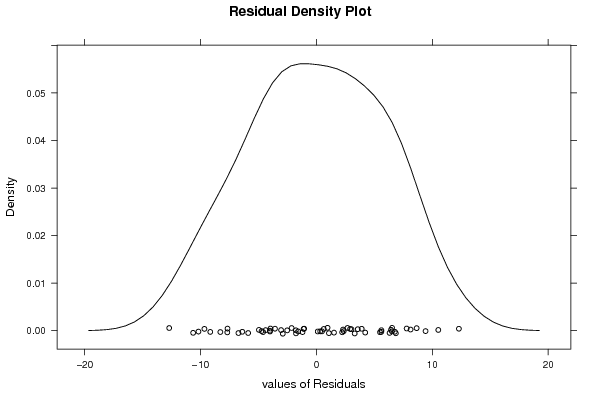
densityplot(~mysum$resid,col='black',main='Residual Density Plot', xlab='values of Residuals')
dev.off()
bitmap(file='test4.png')
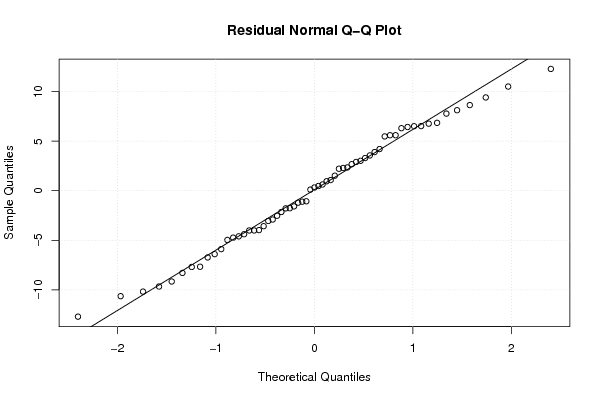
qqnorm(mysum$resid, main='Residual Normal Q-Q Plot')
qqline(mysum$resid)
grid()
dev.off()
(myerror <- as.ts(mysum$resid))
bitmap(file='test5.png')
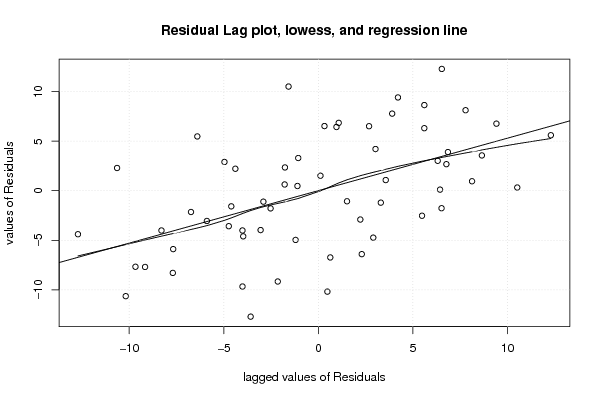
dum <- cbind(lag(myerror,k=1),myerror)
dum
dum1 <- dum[2:length(myerror),]
dum1
z <- as.data.frame(dum1)
z
plot(z,main=paste('Residual Lag plot, lowess, and regression line'), ylab='values of Residuals', xlab='lagged values of Residuals')
lines(lowess(z))
abline(lm(z))
grid()
dev.off()
bitmap(file='test6.png')
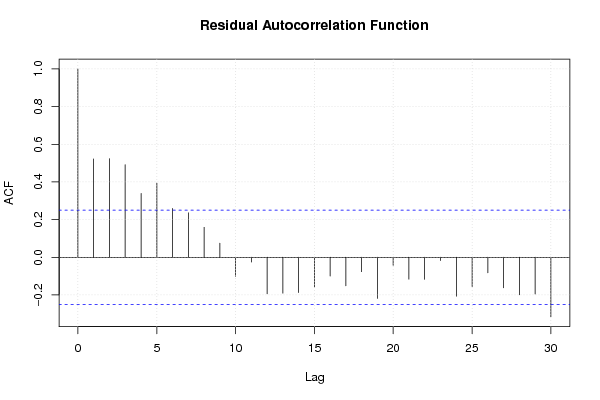
acf(mysum$resid, lag.max=length(mysum$resid)/2, main='Residual Autocorrelation Function')
grid()
dev.off()
bitmap(file='test7.png')
pacf(mysum$resid, lag.max=length(mysum$resid)/2, main='Residual Partial Autocorrelation Function')
grid()
dev.off()
bitmap(file='test8.png')
opar <- par(mfrow = c(2,2), oma = c(0, 0, 1.1, 0))
plot(mylm, las = 1, sub='Residual Diagnostics')
par(opar)
dev.off()
if (n > n25) {
bitmap(file='test9.png')
plot(kp3:nmkm3,gqarr[,2], main='Goldfeld-Quandt test',ylab='2-sided p-value',xlab='breakpoint')
grid()
dev.off()
}
load(file='createtable')
a<-table.start()
a<-table.row.start(a)
a<-table.element(a, 'Multiple Linear Regression - Estimated Regression Equation', 1, TRUE)
a<-table.row.end(a)
myeq <- colnames(x)[1]
myeq <- paste(myeq, '[t] = ', sep='')
for (i in 1:k){
if (mysum$coefficients[i,1] > 0) myeq <- paste(myeq, '+', '')
myeq <- paste(myeq, mysum$coefficients[i,1], sep=' ')
if (rownames(mysum$coefficients)[i] != '(Intercept)') {
myeq <- paste(myeq, rownames(mysum$coefficients)[i], sep='')
if (rownames(mysum$coefficients)[i] != 't') myeq <- paste(myeq, '[t]', sep='')
}
}
myeq <- paste(myeq, ' + e[t]')
a<-table.row.start(a)
a<-table.element(a, myeq)
a<-table.row.end(a)
a<-table.end(a)
table.save(a,file='mytable1.tab')
a<-table.start()
a<-table.row.start(a)
a<-table.element(a,hyperlink('ols1.htm','Multiple Linear Regression - Ordinary Least Squares',''), 6, TRUE)
a<-table.row.end(a)
a<-table.row.start(a)
a<-table.element(a,'Variable',header=TRUE)
a<-table.element(a,'Parameter',header=TRUE)
a<-table.element(a,'S.D.',header=TRUE)
a<-table.element(a,'T-STAT
H0: parameter = 0',header=TRUE)
a<-table.element(a,'2-tail p-value',header=TRUE)
a<-table.element(a,'1-tail p-value',header=TRUE)
a<-table.row.end(a)
for (i in 1:k){
a<-table.row.start(a)
a<-table.element(a,rownames(mysum$coefficients)[i],header=TRUE)
a<-table.element(a,mysum$coefficients[i,1])
a<-table.element(a, round(mysum$coefficients[i,2],6))
a<-table.element(a, round(mysum$coefficients[i,3],4))
a<-table.element(a, round(mysum$coefficients[i,4],6))
a<-table.element(a, round(mysum$coefficients[i,4]/2,6))
a<-table.row.end(a)
}
a<-table.end(a)
table.save(a,file='mytable2.tab')
a<-table.start()
a<-table.row.start(a)
a<-table.element(a, 'Multiple Linear Regression - Regression Statistics', 2, TRUE)
a<-table.row.end(a)
a<-table.row.start(a)
a<-table.element(a, 'Multiple R',1,TRUE)
a<-table.element(a, sqrt(mysum$r.squared))
a<-table.row.end(a)
a<-table.row.start(a)
a<-table.element(a, 'R-squared',1,TRUE)
a<-table.element(a, mysum$r.squared)
a<-table.row.end(a)
a<-table.row.start(a)
a<-table.element(a, 'Adjusted R-squared',1,TRUE)
a<-table.element(a, mysum$adj.r.squared)
a<-table.row.end(a)
a<-table.row.start(a)
a<-table.element(a, 'F-TEST (value)',1,TRUE)
a<-table.element(a, mysum$fstatistic[1])
a<-table.row.end(a)
a<-table.row.start(a)
a<-table.element(a, 'F-TEST (DF numerator)',1,TRUE)
a<-table.element(a, mysum$fstatistic[2])
a<-table.row.end(a)
a<-table.row.start(a)
a<-table.element(a, 'F-TEST (DF denominator)',1,TRUE)
a<-table.element(a, mysum$fstatistic[3])
a<-table.row.end(a)
a<-table.row.start(a)
a<-table.element(a, 'p-value',1,TRUE)
a<-table.element(a, 1-pf(mysum$fstatistic[1],mysum$fstatistic[2],mysum$fstatistic[3]))
a<-table.row.end(a)
a<-table.row.start(a)
a<-table.element(a, 'Multiple Linear Regression - Residual Statistics', 2, TRUE)
a<-table.row.end(a)
a<-table.row.start(a)
a<-table.element(a, 'Residual Standard Deviation',1,TRUE)
a<-table.element(a, mysum$sigma)
a<-table.row.end(a)
a<-table.row.start(a)
a<-table.element(a, 'Sum Squared Residuals',1,TRUE)
a<-table.element(a, sum(myerror*myerror))
a<-table.row.end(a)
a<-table.end(a)
table.save(a,file='mytable3.tab')
a<-table.start()
a<-table.row.start(a)
a<-table.element(a, 'Multiple Linear Regression - Actuals, Interpolation, and Residuals', 4, TRUE)
a<-table.row.end(a)
a<-table.row.start(a)
a<-table.element(a, 'Time or Index', 1, TRUE)
a<-table.element(a, 'Actuals', 1, TRUE)
a<-table.element(a, 'Interpolation
Forecast', 1, TRUE)
a<-table.element(a, 'Residuals
Prediction Error', 1, TRUE)
a<-table.row.end(a)
for (i in 1:n) {
a<-table.row.start(a)
a<-table.element(a,i, 1, TRUE)
a<-table.element(a,x[i])
a<-table.element(a,x[i]-mysum$resid[i])
a<-table.element(a,mysum$resid[i])
a<-table.row.end(a)
}
a<-table.end(a)
table.save(a,file='mytable4.tab')
if (n > n25) {
a<-table.start()
a<-table.row.start(a)
a<-table.element(a,'Goldfeld-Quandt test for Heteroskedasticity',4,TRUE)
a<-table.row.end(a)
a<-table.row.start(a)
a<-table.element(a,'p-values',header=TRUE)
a<-table.element(a,'Alternative Hypothesis',3,header=TRUE)
a<-table.row.end(a)
a<-table.row.start(a)
a<-table.element(a,'breakpoint index',header=TRUE)
a<-table.element(a,'greater',header=TRUE)
a<-table.element(a,'2-sided',header=TRUE)
a<-table.element(a,'less',header=TRUE)
a<-table.row.end(a)
for (mypoint in kp3:nmkm3) {
a<-table.row.start(a)
a<-table.element(a,mypoint,header=TRUE)
a<-table.element(a,gqarr[mypoint-kp3+1,1])
a<-table.element(a,gqarr[mypoint-kp3+1,2])
a<-table.element(a,gqarr[mypoint-kp3+1,3])
a<-table.row.end(a)
}
a<-table.end(a)
table.save(a,file='mytable5.tab')
a<-table.start()
a<-table.row.start(a)
a<-table.element(a,'Meta Analysis of Goldfeld-Quandt test for Heteroskedasticity',4,TRUE)
a<-table.row.end(a)
a<-table.row.start(a)
a<-table.element(a,'Description',header=TRUE)
a<-table.element(a,'# significant tests',header=TRUE)
a<-table.element(a,'% significant tests',header=TRUE)
a<-table.element(a,'OK/NOK',header=TRUE)
a<-table.row.end(a)
a<-table.row.start(a)
a<-table.element(a,'1% type I error level',header=TRUE)
a<-table.element(a,numsignificant1)
a<-table.element(a,numsignificant1/numgqtests)
if (numsignificant1/numgqtests < 0.01) dum <- 'OK' else dum <- 'NOK'
a<-table.element(a,dum)
a<-table.row.end(a)
a<-table.row.start(a)
a<-table.element(a,'5% type I error level',header=TRUE)
a<-table.element(a,numsignificant5)
a<-table.element(a,numsignificant5/numgqtests)
if (numsignificant5/numgqtests < 0.05) dum <- 'OK' else dum <- 'NOK'
a<-table.element(a,dum)
a<-table.row.end(a)
a<-table.row.start(a)
a<-table.element(a,'10% type I error level',header=TRUE)
a<-table.element(a,numsignificant10)
a<-table.element(a,numsignificant10/numgqtests)
if (numsignificant10/numgqtests < 0.1) dum <- 'OK' else dum <- 'NOK'
a<-table.element(a,dum)
a<-table.row.end(a)
a<-table.end(a)
table.save(a,file='mytable6.tab')
}