| Multiple Linear Regression - Estimated Regression Equation |
| IPCN[t] = + 74.5328022479259 + 0.402196719336294TIP[t] + e[t] |
| Multiple Linear Regression - Ordinary Least Squares | |||||
| Variable | Parameter | S.D. | T-STAT H0: parameter = 0 | 2-tail p-value | 1-tail p-value |
| (Intercept) | 74.5328022479259 | 11.890321 | 6.2684 | 0 | 0 |
| TIP | 0.402196719336294 | 0.113781 | 3.5348 | 0.000801 | 4e-04 |
| Multiple Linear Regression - Regression Statistics | |
| Multiple R | 0.418053628312164 |
| R-squared | 0.174768836144965 |
| Adjusted R-squared | 0.160781867266066 |
| F-TEST (value) | 12.4951186821203 |
| F-TEST (DF numerator) | 1 |
| F-TEST (DF denominator) | 59 |
| p-value | 0.000800827803737358 |
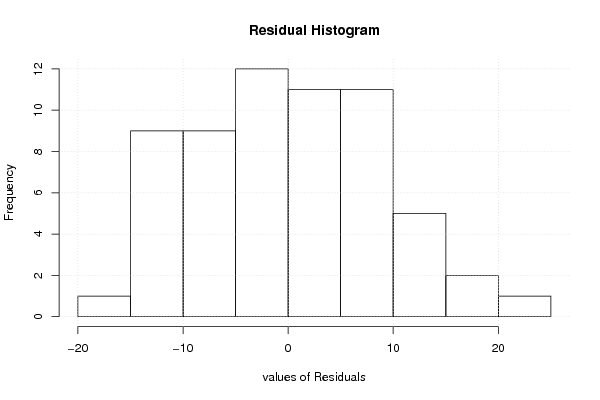
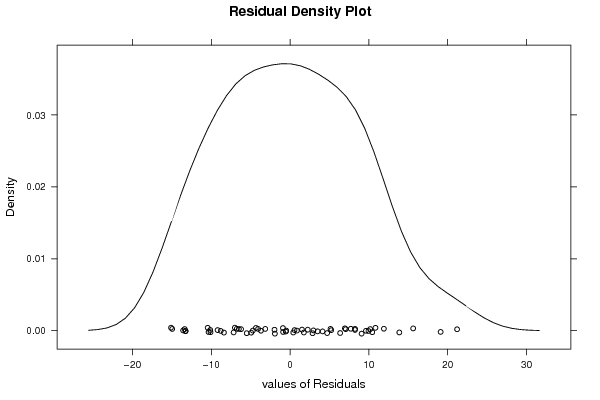
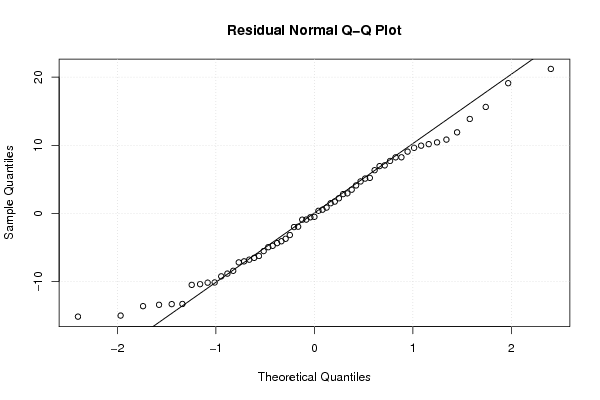
| Multiple Linear Regression - Residual Statistics | |
| Residual Standard Deviation | 8.88329309896968 |
| Sum Squared Residuals | 4655.86088064994 |
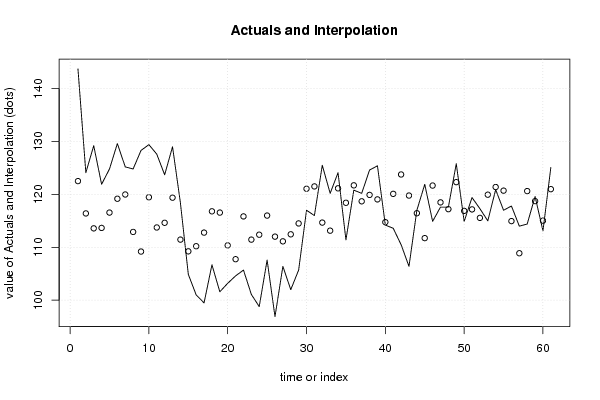
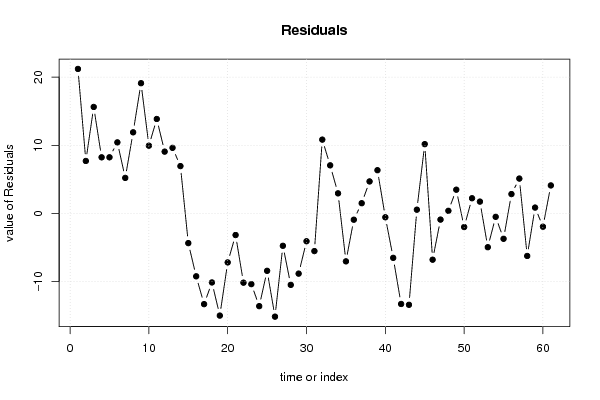
| Multiple Linear Regression - Actuals, Interpolation, and Residuals | |||
| Time or Index | Actuals | Interpolation Forecast | Residuals Prediction Error |
| 1 | 143.7 | 122.514870864746 | 21.1851291352542 |
| 2 | 124.1 | 116.401480730834 | 7.69851926916589 |
| 3 | 129.2 | 113.58610369548 | 15.6138963045199 |
| 4 | 121.9 | 113.666543039347 | 8.2334569606527 |
| 5 | 124.8 | 116.562359418569 | 8.23764058143137 |
| 6 | 129.6 | 119.176638094255 | 10.4233619057455 |
| 7 | 125.2 | 119.981031532927 | 5.21896846707288 |
| 8 | 124.8 | 112.902369272608 | 11.8976307273916 |
| 9 | 128.3 | 109.202159454714 | 19.0978405452856 |
| 10 | 129.4 | 119.45817579779 | 9.94182420221006 |
| 11 | 127.6 | 113.746982383215 | 13.8530176167854 |
| 12 | 123.7 | 114.631815165754 | 9.06818483424559 |
| 13 | 129 | 119.377736453923 | 9.62226354607732 |
| 14 | 118.4 | 111.454461082998 | 6.94553891700232 |
| 15 | 104.9 | 109.242379126648 | -4.34237912664807 |
| 16 | 101 | 110.207651253055 | -9.20765125305518 |
| 17 | 99.5 | 112.781710256807 | -13.2817102568075 |
| 18 | 106.7 | 116.80367745017 | -10.1036774501704 |
| 19 | 101.6 | 116.562359418569 | -14.9623594185686 |
| 20 | 103.2 | 110.36852994079 | -7.16852994078969 |
| 21 | 104.6 | 107.754251265104 | -3.15425126510379 |
| 22 | 105.7 | 115.838405323763 | -10.1384053237633 |
| 23 | 101.1 | 111.454461082998 | -10.3544610829977 |
| 24 | 98.8 | 112.379513537471 | -13.5795135374712 |
| 25 | 107.6 | 115.999284011498 | -8.39928401149782 |
| 26 | 96.9 | 112.017536490069 | -15.1175364900685 |
| 27 | 106.4 | 111.132703707529 | -4.73270370752865 |
| 28 | 102 | 112.459952881338 | -10.4599528813384 |
| 29 | 105.7 | 114.511156149954 | -8.81115614995352 |
| 30 | 117 | 121.066962675135 | -4.06696267513512 |
| 31 | 116 | 121.509379066405 | -5.50937906640504 |
| 32 | 125.5 | 114.672034837688 | 10.827965162312 |
| 33 | 120.2 | 113.14368730421 | 7.05631269578988 |
| 34 | 124.1 | 121.147402019002 | 2.95259798099761 |
| 35 | 111.4 | 118.412464327516 | -7.01246432751557 |
| 36 | 120.8 | 121.710477426073 | -0.910477426073194 |
| 37 | 120.2 | 118.694002031051 | 1.50599796894902 |
| 38 | 124.6 | 119.90059218906 | 4.69940781094013 |
| 39 | 125.4 | 119.055979078454 | 6.34402092154635 |
| 40 | 114.2 | 114.752474181555 | -0.552474181555299 |
| 41 | 113.6 | 120.101690548728 | -6.50169054872802 |
| 42 | 110.5 | 123.761680694688 | -13.2616806946883 |
| 43 | 106.4 | 119.779933173259 | -13.379933173259 |
| 44 | 117 | 116.441700402768 | 0.558299597232261 |
| 45 | 121.9 | 111.735998786533 | 10.1640012134669 |
| 46 | 114.9 | 121.67025775414 | -6.77025775413956 |
| 47 | 117.6 | 118.492903671383 | -0.892903671382842 |
| 48 | 117.6 | 117.205874169507 | 0.3941258304933 |
| 49 | 125.8 | 122.313772505078 | 3.48622749492237 |
| 50 | 114.9 | 116.884116794038 | -1.98411679403765 |
| 51 | 119.4 | 117.165654497573 | 2.23434550242694 |
| 52 | 117.3 | 115.556867620228 | 1.74313237977211 |
| 53 | 115 | 119.940811860994 | -4.9408118609935 |
| 54 | 120.9 | 121.388720050604 | -0.488720050604151 |
| 55 | 117 | 120.704985627732 | -3.70498562773246 |
| 56 | 117.8 | 114.953572541223 | 2.84642745877655 |
| 57 | 114 | 108.880402079245 | 5.11959792075459 |
| 58 | 114.4 | 120.624546283865 | -6.22454628386519 |
| 59 | 119.6 | 118.734221702985 | 0.865778297015377 |
| 60 | 113.1 | 115.034011885091 | -1.93401188509072 |
| 61 | 125.1 | 120.986523331268 | 4.11347666873213 |
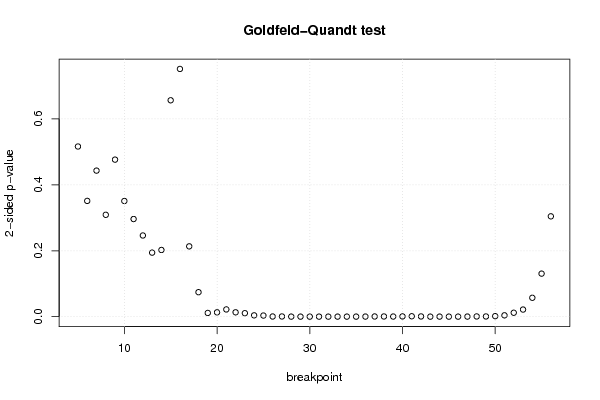
| Goldfeld-Quandt test for Heteroskedasticity | |||
| p-values | Alternative Hypothesis | ||
| breakpoint index | greater | 2-sided | less |
| 5 | 0.258210275909624 | 0.516420551819248 | 0.741789724090376 |
| 6 | 0.175646505371268 | 0.351293010742537 | 0.824353494628732 |
| 7 | 0.221595173518763 | 0.443190347037525 | 0.778404826481237 |
| 8 | 0.154581111564152 | 0.309162223128304 | 0.845418888435848 |
| 9 | 0.238294726071315 | 0.476589452142629 | 0.761705273928685 |
| 10 | 0.175504867996472 | 0.351009735992944 | 0.824495132003528 |
| 11 | 0.148164462931078 | 0.296328925862157 | 0.851835537068922 |
| 12 | 0.123180231042969 | 0.246360462085939 | 0.876819768957031 |
| 13 | 0.0971507371412609 | 0.194301474282522 | 0.902849262858739 |
| 14 | 0.101199532761339 | 0.202399065522678 | 0.898800467238661 |
| 15 | 0.328374290965267 | 0.656748581930534 | 0.671625709034733 |
| 16 | 0.624102328709323 | 0.751795342581354 | 0.375897671290677 |
| 17 | 0.893287352915714 | 0.213425294168571 | 0.106712647084285 |
| 18 | 0.962857364240216 | 0.0742852715195677 | 0.0371426357597838 |
| 19 | 0.99437911515229 | 0.0112417696954199 | 0.00562088484770996 |
| 20 | 0.99341450093747 | 0.0131709981250595 | 0.00658549906252975 |
| 21 | 0.989026340218462 | 0.0219473195630753 | 0.0109736597815376 |
| 22 | 0.993399960785171 | 0.0132000784296579 | 0.00660003921482896 |
| 23 | 0.994736391342808 | 0.0105272173143831 | 0.00526360865719156 |
| 24 | 0.998005238421603 | 0.00398952315679373 | 0.00199476157839687 |
| 25 | 0.998309136789 | 0.00338172642200076 | 0.00169086321100038 |
| 26 | 0.999749820004858 | 0.000500359990283535 | 0.000250179995141768 |
| 27 | 0.999701535094102 | 0.000596929811797022 | 0.000298464905898511 |
| 28 | 0.99993311640444 | 0.000133767191119823 | 6.68835955599117e-05 |
| 29 | 0.999980878884691 | 3.8242230617063e-05 | 1.91211153085315e-05 |
| 30 | 0.999969760874629 | 6.04782507424046e-05 | 3.02391253712023e-05 |
| 31 | 0.999954572625126 | 9.08547497476208e-05 | 4.54273748738104e-05 |
| 32 | 0.999968828926029 | 6.2342147942317e-05 | 3.11710739711585e-05 |
| 33 | 0.999947305687001 | 0.000105388625997411 | 5.26943129987054e-05 |
| 34 | 0.999930364547004 | 0.000139270905990984 | 6.96354529954921e-05 |
| 35 | 0.999928580924822 | 0.000142838150356891 | 7.14190751784453e-05 |
| 36 | 0.999862282249914 | 0.000275435500172246 | 0.000137717750086123 |
| 37 | 0.999723068790192 | 0.000553862419616285 | 0.000276931209808143 |
| 38 | 0.999718951522808 | 0.000562096954383119 | 0.00028104847719156 |
| 39 | 0.999811135185262 | 0.000377729629477007 | 0.000188864814738503 |
| 40 | 0.999611972085859 | 0.000776055828281622 | 0.000388027914140811 |
| 41 | 0.999387734065016 | 0.00122453186996829 | 0.000612265934984147 |
| 42 | 0.999664240829459 | 0.000671518341082161 | 0.00033575917054108 |
| 43 | 0.999981122503169 | 3.77549936623977e-05 | 1.88774968311988e-05 |
| 44 | 0.999944345663046 | 0.000111308673908576 | 5.56543369542878e-05 |
| 45 | 0.99996781531953 | 6.4369360939292e-05 | 3.2184680469646e-05 |
| 46 | 0.999965302188892 | 6.93956222168686e-05 | 3.46978111084343e-05 |
| 47 | 0.999889499470067 | 0.000221001059865496 | 0.000110500529932748 |
| 48 | 0.99965609807406 | 0.000687803851879366 | 0.000343901925939683 |
| 49 | 0.999695759601139 | 0.000608480797721564 | 0.000304240398860782 |
| 50 | 0.999211462278141 | 0.00157707544371795 | 0.000788537721858973 |
| 51 | 0.997940695374344 | 0.00411860925131169 | 0.00205930462565585 |
| 52 | 0.994045677640912 | 0.0119086447181752 | 0.00595432235908761 |
| 53 | 0.989184180795619 | 0.0216316384087616 | 0.0108158192043808 |
| 54 | 0.971330525849403 | 0.0573389483011936 | 0.0286694741505968 |
| 55 | 0.934710359749481 | 0.130579280501038 | 0.065289640250519 |
| 56 | 0.847754332401897 | 0.304491335196206 | 0.152245667598103 |
| Meta Analysis of Goldfeld-Quandt test for Heteroskedasticity | |||
| Description | # significant tests | % significant tests | OK/NOK |
| 1% type I error level | 28 | 0.538461538461538 | NOK |
| 5% type I error level | 35 | 0.673076923076923 | NOK |
| 10% type I error level | 37 | 0.711538461538462 | NOK |