| Multiple Linear Regression - Estimated Regression Equation |
| Levensverwachting[t] = + 43.2565967257155 + 3.65526546336868e-11GDP[t] -6.94535406275099e-05Inkomen[t] + 2.50930862776786e-06Populatie[t] + e[t] |
| Multiple Linear Regression - Ordinary Least Squares | |||||
| Variable | Parameter | S.D. | T-STAT H0: parameter = 0 | 2-tail p-value | 1-tail p-value |
| (Intercept) | 43.2565967257155 | 5.540451 | 7.8074 | 0 | 0 |
| GDP | 3.65526546336868e-11 | 0 | 0.5931 | 0.555479 | 0.277739 |
| Inkomen | -6.94535406275099e-05 | 0.000677 | -0.1026 | 0.918642 | 0.459321 |
| Populatie | 2.50930862776786e-06 | 1e-06 | 3.7398 | 0.000435 | 0.000217 |
| Multiple Linear Regression - Regression Statistics | |
| Multiple R | 0.978685976143453 |
| R-squared | 0.957826239899863 |
| Adjusted R-squared | 0.95556693132307 |
| F-TEST (value) | 423.946622315507 |
| F-TEST (DF numerator) | 3 |
| F-TEST (DF denominator) | 56 |
| p-value | 0 |
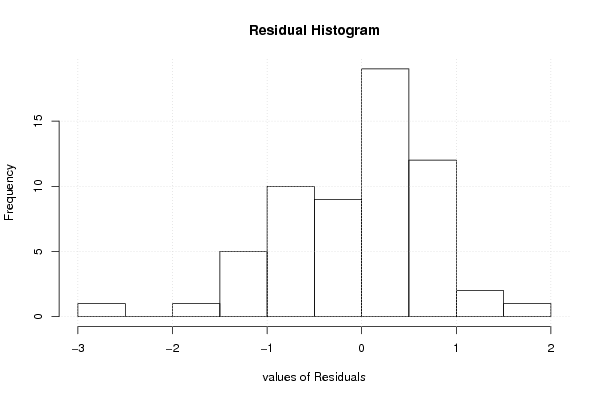
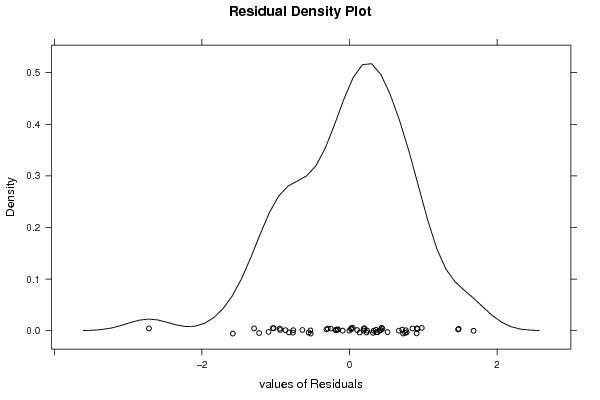
| Multiple Linear Regression - Residual Statistics | |
| Residual Standard Deviation | 0.833482795613895 |
| Sum Squared Residuals | 38.9028399527239 |
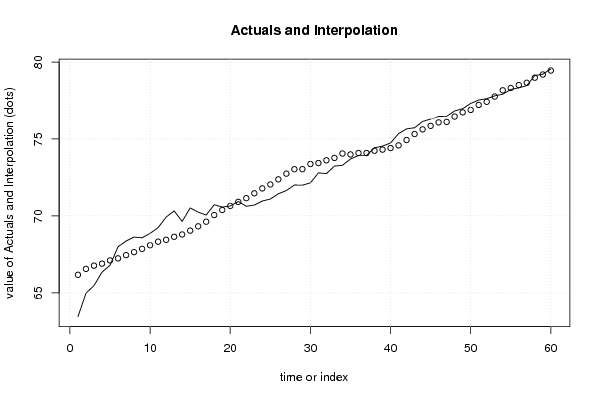
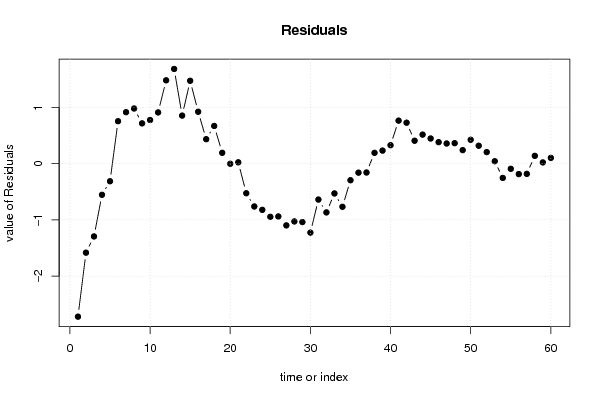
| Multiple Linear Regression - Actuals, Interpolation, and Residuals | |||
| Time or Index | Actuals | Interpolation Forecast | Residuals Prediction Error |
| 1 | 63.46 | 66.1782557571827 | -2.71825575718273 |
| 2 | 64.98 | 66.561836664185 | -1.58183666418495 |
| 3 | 65.48 | 66.7734992285879 | -1.29349922858791 |
| 4 | 66.35 | 66.9037976738865 | -0.553797673886495 |
| 5 | 66.8 | 67.1129358784063 | -0.312935878406271 |
| 6 | 68 | 67.2468661057622 | 0.753133894237807 |
| 7 | 68.37 | 67.4564446522476 | 0.913555347752436 |
| 8 | 68.63 | 67.6508384736407 | 0.979161526359252 |
| 9 | 68.58 | 67.8650866606344 | 0.714913339365593 |
| 10 | 68.87 | 68.0958258351286 | 0.77417416487138 |
| 11 | 69.24 | 68.3304139060273 | 0.909586093972645 |
| 12 | 69.93 | 68.450436992824 | 1.479563007176 |
| 13 | 70.33 | 68.6483283807786 | 1.68167161922136 |
| 14 | 69.65 | 68.7970330991551 | 0.852966900844919 |
| 15 | 70.52 | 69.0483386994639 | 1.47166130053612 |
| 16 | 70.25 | 69.3285929730512 | 0.921407026948752 |
| 17 | 70.06 | 69.6262144254342 | 0.433785574565784 |
| 18 | 70.73 | 70.0609155375691 | 0.669084462430864 |
| 19 | 70.58 | 70.3876852751304 | 0.192314724869614 |
| 20 | 70.65 | 70.6518506662578 | -0.00185066625780684 |
| 21 | 70.94 | 70.9167203383054 | 0.0232796616946301 |
| 22 | 70.63 | 71.1563059881824 | -0.526305988182401 |
| 23 | 70.71 | 71.4714597730719 | -0.761459773071902 |
| 24 | 70.97 | 71.7907089292388 | -0.820708929238818 |
| 25 | 71.1 | 72.0450098130539 | -0.945009813053896 |
| 26 | 71.44 | 72.3786194918063 | -0.93861949180627 |
| 27 | 71.65 | 72.7471789511621 | -1.09717895116211 |
| 28 | 72.01 | 73.037073980754 | -1.02707398075404 |
| 29 | 72 | 73.0383432459794 | -1.0383432459794 |
| 30 | 72.15 | 73.3753179327312 | -1.2253179327312 |
| 31 | 72.8 | 73.4383120856899 | -0.638312085689926 |
| 32 | 72.75 | 73.6165692444928 | -0.866569244492783 |
| 33 | 73.24 | 73.7697580451796 | -0.529758045179636 |
| 34 | 73.29 | 74.0563693468458 | -0.766369346845795 |
| 35 | 73.7 | 73.9952167286723 | -0.295216728672326 |
| 36 | 73.93 | 74.0904718841867 | -0.160471884186659 |
| 37 | 73.93 | 74.0876648935933 | -0.157664893593337 |
| 38 | 74.43 | 74.2381295801677 | 0.191870419832294 |
| 39 | 74.54 | 74.3087160367795 | 0.231283963220542 |
| 40 | 74.74 | 74.412571847283 | 0.327428152717036 |
| 41 | 75.35 | 74.5863127821811 | 0.76368721781888 |
| 42 | 75.66 | 74.9329664125652 | 0.72703358743477 |
| 43 | 75.73 | 75.3235408575495 | 0.406459142450478 |
| 44 | 76.14 | 75.6245995053152 | 0.515400494684838 |
| 45 | 76.3 | 75.853834374884 | 0.446165625115987 |
| 46 | 76.46 | 76.0790488852074 | 0.380951114792615 |
| 47 | 76.47 | 76.1126265834534 | 0.357373416546611 |
| 48 | 76.82 | 76.4569852606522 | 0.363014739347742 |
| 49 | 76.97 | 76.7305473469275 | 0.239452653072533 |
| 50 | 77.31 | 76.8861804756232 | 0.423819524376797 |
| 51 | 77.53 | 77.2124088739967 | 0.317591126003339 |
| 52 | 77.62 | 77.4157537934312 | 0.204246206568822 |
| 53 | 77.8 | 77.7577827600525 | 0.0422172399475031 |
| 54 | 77.91 | 78.1641707087825 | -0.254170708782534 |
| 55 | 78.22 | 78.3118776800259 | -0.0918776800258541 |
| 56 | 78.32 | 78.5062002477853 | -0.186200247785306 |
| 57 | 78.47 | 78.6517591807116 | -0.181759180711597 |
| 58 | 79.12 | 78.9818080268602 | 0.138191973139823 |
| 59 | 79.21 | 79.1884235085727 | 0.0215764914273455 |
| 60 | 79.55 | 79.4474577128932 | 0.102542287106828 |
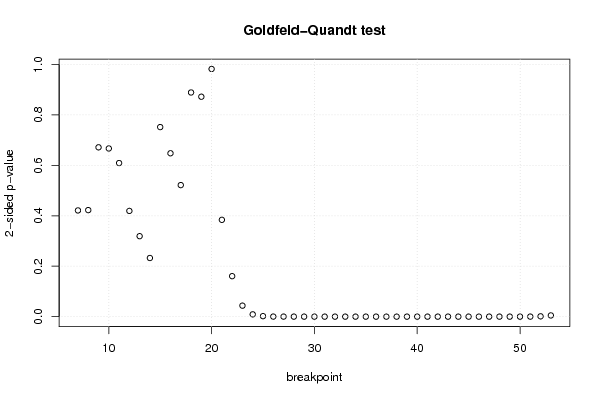
| Goldfeld-Quandt test for Heteroskedasticity | |||
| p-values | Alternative Hypothesis | ||
| breakpoint index | greater | 2-sided | less |
| 7 | 0.210634322794315 | 0.421268645588631 | 0.789365677205685 |
| 8 | 0.211318799212606 | 0.422637598425212 | 0.788681200787394 |
| 9 | 0.335806579914062 | 0.671613159828124 | 0.664193420085938 |
| 10 | 0.333496421622947 | 0.666992843245895 | 0.666503578377053 |
| 11 | 0.304618348973158 | 0.609236697946317 | 0.695381651026842 |
| 12 | 0.209717425526333 | 0.419434851052665 | 0.790282574473667 |
| 13 | 0.159575149056346 | 0.319150298112691 | 0.840424850943654 |
| 14 | 0.116314340079668 | 0.232628680159335 | 0.883685659920332 |
| 15 | 0.375918492854871 | 0.751836985709741 | 0.624081507145129 |
| 16 | 0.323984190947725 | 0.647968381895449 | 0.676015809052275 |
| 17 | 0.260868995940161 | 0.521737991880322 | 0.739131004059839 |
| 18 | 0.444531124158793 | 0.889062248317585 | 0.555468875841207 |
| 19 | 0.436102495328479 | 0.872204990656957 | 0.563897504671521 |
| 20 | 0.491203818292635 | 0.982407636585269 | 0.508796181707366 |
| 21 | 0.807961106000281 | 0.384077787999438 | 0.192038893999719 |
| 22 | 0.919732188251463 | 0.160535623497075 | 0.0802678117485373 |
| 23 | 0.978206513287936 | 0.0435869734241285 | 0.0217934867120642 |
| 24 | 0.9954648255974 | 0.00907034880519992 | 0.00453517440259996 |
| 25 | 0.998996800189037 | 0.00200639962192668 | 0.00100319981096334 |
| 26 | 0.999866004814076 | 0.000267990371847573 | 0.000133995185923786 |
| 27 | 0.999908122520965 | 0.000183754958070291 | 9.18774790351456e-05 |
| 28 | 0.999945117546637 | 0.00010976490672671 | 5.48824533633548e-05 |
| 29 | 0.999974684804789 | 5.06303904221633e-05 | 2.53151952110816e-05 |
| 30 | 0.999989360740956 | 2.12785180888439e-05 | 1.0639259044422e-05 |
| 31 | 0.999995558613252 | 8.88277349585421e-06 | 4.44138674792711e-06 |
| 32 | 0.999996478393501 | 7.0432129986481e-06 | 3.52160649932405e-06 |
| 33 | 0.999996531768061 | 6.93646387827516e-06 | 3.46823193913758e-06 |
| 34 | 0.999999873141448 | 2.53717103215468e-07 | 1.26858551607734e-07 |
| 35 | 0.999999907990568 | 1.84018863294789e-07 | 9.20094316473946e-08 |
| 36 | 0.999999919933207 | 1.60133586850199e-07 | 8.00667934250997e-08 |
| 37 | 0.999999965190341 | 6.96193185231712e-08 | 3.48096592615856e-08 |
| 38 | 0.999999950286197 | 9.94276066007613e-08 | 4.97138033003806e-08 |
| 39 | 0.999999962069934 | 7.58601318561072e-08 | 3.79300659280536e-08 |
| 40 | 0.999999996747835 | 6.50432914889813e-09 | 3.25216457444907e-09 |
| 41 | 0.999999994293136 | 1.14137272937713e-08 | 5.70686364688565e-09 |
| 42 | 0.999999973283605 | 5.3432789412154e-08 | 2.6716394706077e-08 |
| 43 | 0.999999982199562 | 3.5600875848794e-08 | 1.7800437924397e-08 |
| 44 | 0.999999958949393 | 8.2101214163033e-08 | 4.10506070815165e-08 |
| 45 | 0.999999891274611 | 2.1745077709666e-07 | 1.0872538854833e-07 |
| 46 | 0.999999624611831 | 7.50776337342971e-07 | 3.75388168671485e-07 |
| 47 | 0.999999083414876 | 1.83317024805705e-06 | 9.16585124028524e-07 |
| 48 | 0.999996663974165 | 6.672051670925e-06 | 3.3360258354625e-06 |
| 49 | 0.999998079492816 | 3.84101436699146e-06 | 1.92050718349573e-06 |
| 50 | 0.99999143126825 | 1.71374634997697e-05 | 8.56873174988486e-06 |
| 51 | 0.999922692245893 | 0.000154615508214316 | 7.73077541071578e-05 |
| 52 | 0.999338256046163 | 0.00132348790767409 | 0.000661743953837044 |
| 53 | 0.997603112650733 | 0.00479377469853417 | 0.00239688734926708 |
| Meta Analysis of Goldfeld-Quandt test for Heteroskedasticity | |||
| Description | # significant tests | % significant tests | OK/NOK |
| 1% type I error level | 30 | 0.638297872340426 | NOK |
| 5% type I error level | 31 | 0.659574468085106 | NOK |
| 10% type I error level | 31 | 0.659574468085106 | NOK |