| Multiple Linear Regression - Estimated Regression Equation |
| doctor[t] = -77.1180198794039 + 3.12904649550141death[t] + 0.0325065912039845hospital[t] + 16.2481033907153income[t] -0.0758510688606824population[t] + e[t] |
| Multiple Linear Regression - Ordinary Least Squares | |||||
| Variable | Parameter | S.D. | T-STAT H0: parameter = 0 | 2-tail p-value | 1-tail p-value |
| (Intercept) | -77.1180198794039 | 54.135332 | -1.4245 | 0.160759 | 0.08038 |
| death | 3.12904649550141 | 2.935178 | 1.0661 | 0.291734 | 0.145867 |
| hospital | 0.0325065912039845 | 0.014199 | 2.2894 | 0.026498 | 0.013249 |
| income | 16.2481033907153 | 4.330207 | 3.7523 | 0.000473 | 0.000236 |
| population | -0.0758510688606824 | 0.103823 | -0.7306 | 0.468587 | 0.234294 |
| Multiple Linear Regression - Regression Statistics | |
| Multiple R | 0.549532412033932 |
| R-squared | 0.301985871875831 |
| Adjusted R-squared | 0.243818027865484 |
| F-TEST (value) | 5.19162910391025 |
| F-TEST (DF numerator) | 4 |
| F-TEST (DF denominator) | 48 |
| p-value | 0.00147595090210906 |
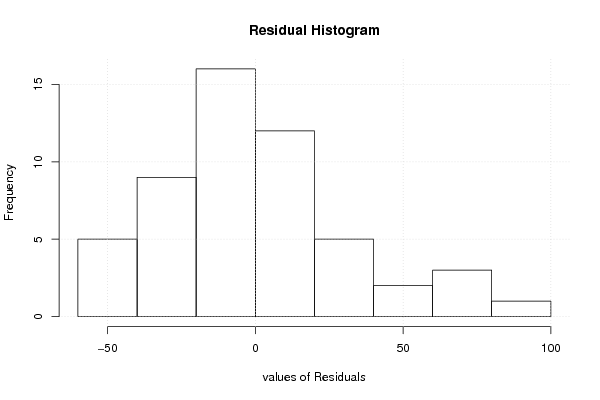
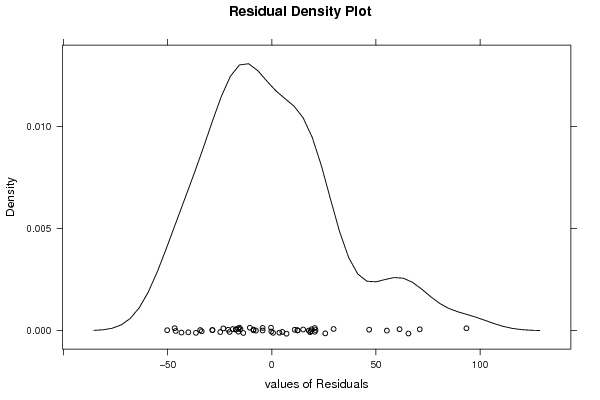
| Multiple Linear Regression - Residual Statistics | |
| Residual Standard Deviation | 32.945707638151 |
| Sum Squared Residuals | 52100.1432853689 |
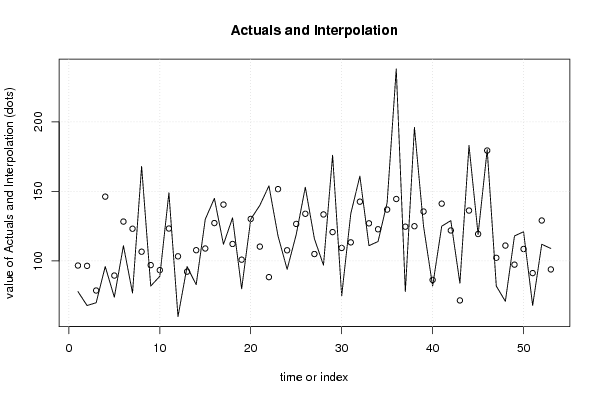
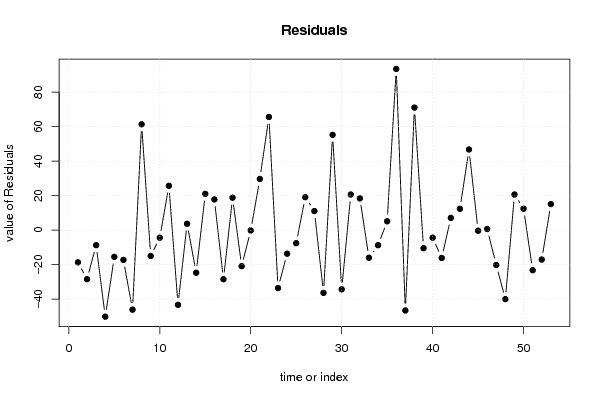
| Multiple Linear Regression - Actuals, Interpolation, and Residuals | |||
| Time or Index | Actuals | Interpolation Forecast | Residuals Prediction Error |
| 1 | 78 | 96.7362045267615 | -18.7362045267615 |
| 2 | 68 | 96.4934095976297 | -28.4934095976298 |
| 3 | 70 | 78.7873702651068 | -8.78737026510675 |
| 4 | 96 | 146.232864483285 | -50.232864483285 |
| 5 | 74 | 89.5378388455167 | -15.5378388455167 |
| 6 | 111 | 128.319240892541 | -17.3192408925413 |
| 7 | 77 | 123.18118401686 | -46.1811840168596 |
| 8 | 168 | 106.661655774997 | 61.3383442250031 |
| 9 | 82 | 97.0382816007865 | -15.0382816007865 |
| 10 | 89 | 93.4225433453052 | -4.42254334530517 |
| 11 | 149 | 123.321541981618 | 25.6784580183817 |
| 12 | 60 | 103.372327345172 | -43.3723273451716 |
| 13 | 96 | 92.3358769861383 | 3.66412301386169 |
| 14 | 83 | 107.755009907471 | -24.7550099074708 |
| 15 | 130 | 108.98438969752 | 21.0156103024796 |
| 16 | 145 | 127.245984458825 | 17.7540155411751 |
| 17 | 112 | 140.530572911847 | -28.5305729118473 |
| 18 | 131 | 112.221858294428 | 18.7781417055716 |
| 19 | 80 | 100.938386659496 | -20.9383866594958 |
| 20 | 130 | 130.227268576279 | -0.227268576279427 |
| 21 | 140 | 110.334631143262 | 29.6653688567381 |
| 22 | 154 | 88.4059934113659 | 65.5940065886341 |
| 23 | 118 | 151.668600946328 | -33.6686009463283 |
| 24 | 94 | 107.706059499251 | -13.7060594992507 |
| 25 | 119 | 126.627829761037 | -7.627829761037 |
| 26 | 153 | 133.931405382296 | 19.0685946177038 |
| 27 | 116 | 104.999455869888 | 11.0005441301123 |
| 28 | 97 | 133.440144043255 | -36.4401440432553 |
| 29 | 176 | 120.762142724719 | 55.2378572752809 |
| 30 | 75 | 109.384243862228 | -34.3842438622277 |
| 31 | 134 | 113.391406315257 | 20.6085936847434 |
| 32 | 161 | 142.615724373831 | 18.3842756261692 |
| 33 | 111 | 127.059613373902 | -16.0596133739018 |
| 34 | 114 | 122.799396700485 | -8.79939670048477 |
| 35 | 142 | 136.932462436317 | 5.0675375636827 |
| 36 | 238 | 144.541279791688 | 93.4587202083121 |
| 37 | 78 | 124.646013399789 | -46.6460133997892 |
| 38 | 196 | 124.977866646922 | 71.0221333530775 |
| 39 | 125 | 135.540119459146 | -10.5401194591457 |
| 40 | 82 | 86.4203464602864 | -4.42034646028639 |
| 41 | 125 | 141.191817081663 | -16.1918170816629 |
| 42 | 129 | 121.933424865963 | 7.06657513403676 |
| 43 | 84 | 71.6488901906957 | 12.3511098093043 |
| 44 | 183 | 136.252247312875 | 46.7477526871248 |
| 45 | 119 | 119.388279282816 | -0.388279282816178 |
| 46 | 180 | 179.384884618527 | 0.615115381473365 |
| 47 | 82 | 102.272455915147 | -20.2724559151468 |
| 48 | 71 | 111.077213689144 | -40.077213689144 |
| 49 | 118 | 97.3711799825691 | 20.6288200174309 |
| 50 | 121 | 108.616257289241 | 12.3837427107592 |
| 51 | 68 | 91.2962559984634 | -23.2962559984634 |
| 52 | 112 | 129.101286060171 | -17.1012860601705 |
| 53 | 109 | 93.9372619438886 | 15.0627380561114 |
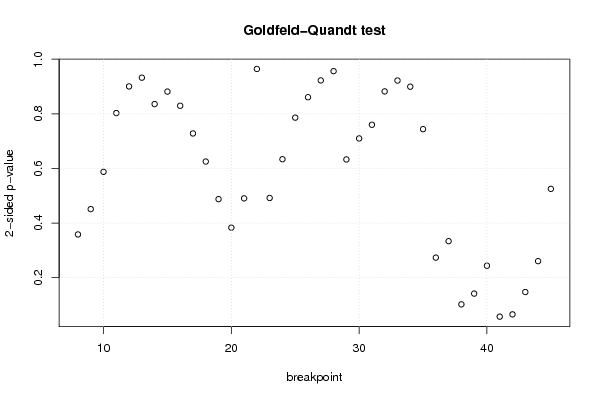
| Goldfeld-Quandt test for Heteroskedasticity | |||
| p-values | Alternative Hypothesis | ||
| breakpoint index | greater | 2-sided | less |
| 8 | 0.820907835520447 | 0.358184328959106 | 0.179092164479553 |
| 9 | 0.7745059752074 | 0.450988049585199 | 0.2254940247926 |
| 10 | 0.706232855285918 | 0.587534289428164 | 0.293767144714082 |
| 11 | 0.598663617066352 | 0.802672765867296 | 0.401336382933648 |
| 12 | 0.549901942544667 | 0.900196114910666 | 0.450098057455333 |
| 13 | 0.466137549878511 | 0.932275099757021 | 0.533862450121489 |
| 14 | 0.417842461638196 | 0.835684923276392 | 0.582157538361804 |
| 15 | 0.440662697476069 | 0.881325394952138 | 0.559337302523931 |
| 16 | 0.414710198502205 | 0.82942039700441 | 0.585289801497795 |
| 17 | 0.364031636744408 | 0.728063273488817 | 0.635968363255592 |
| 18 | 0.312625556326564 | 0.625251112653128 | 0.687374443673436 |
| 19 | 0.243767507635544 | 0.487535015271088 | 0.756232492364456 |
| 20 | 0.191589729540927 | 0.383179459081854 | 0.808410270459073 |
| 21 | 0.245179370312482 | 0.490358740624965 | 0.754820629687518 |
| 22 | 0.517876365812247 | 0.964247268375506 | 0.482123634187753 |
| 23 | 0.754098381234751 | 0.491803237530498 | 0.245901618765249 |
| 24 | 0.683131773596127 | 0.633736452807747 | 0.316868226403874 |
| 25 | 0.607041395809995 | 0.78591720838001 | 0.392958604190005 |
| 26 | 0.569637026241411 | 0.860725947517178 | 0.430362973758589 |
| 27 | 0.538878833566322 | 0.922242332867356 | 0.461121166433678 |
| 28 | 0.521898061369939 | 0.956203877260123 | 0.478101938630061 |
| 29 | 0.683534485242539 | 0.632931029514923 | 0.316465514757461 |
| 30 | 0.645074109973413 | 0.709851780053175 | 0.354925890026587 |
| 31 | 0.620082933240985 | 0.759834133518031 | 0.379917066759016 |
| 32 | 0.558968667648804 | 0.882062664702392 | 0.441031332351196 |
| 33 | 0.539069292637424 | 0.921861414725152 | 0.460930707362576 |
| 34 | 0.449603914825944 | 0.899207829651888 | 0.550396085174056 |
| 35 | 0.371905045863581 | 0.743810091727162 | 0.628094954136419 |
| 36 | 0.863297054972963 | 0.273405890054074 | 0.136702945027037 |
| 37 | 0.833201123987793 | 0.333597752024414 | 0.166798876012207 |
| 38 | 0.948920093771532 | 0.102159812456936 | 0.0510799062284679 |
| 39 | 0.929184218597563 | 0.141631562804873 | 0.0708157814024366 |
| 40 | 0.878164584587402 | 0.243670830825196 | 0.121835415412598 |
| 41 | 0.971384721526785 | 0.05723055694643 | 0.028615278473215 |
| 42 | 0.967175403461871 | 0.0656491930762582 | 0.0328245965381291 |
| 43 | 0.92630425438821 | 0.147391491223581 | 0.0736957456117904 |
| 44 | 0.869708845527459 | 0.260582308945082 | 0.130291154472541 |
| 45 | 0.737399340849104 | 0.525201318301793 | 0.262600659150896 |
| Meta Analysis of Goldfeld-Quandt test for Heteroskedasticity | |||
| Description | # significant tests | % significant tests | OK/NOK |
| 1% type I error level | 0 | 0 | OK |
| 5% type I error level | 0 | 0 | OK |
| 10% type I error level | 2 | 0.0526315789473684 | OK |