Free Statistics
of Irreproducible Research!
Description of Statistical Computation | |||||||||||||||||||||||||||||||||||||||||||||
|---|---|---|---|---|---|---|---|---|---|---|---|---|---|---|---|---|---|---|---|---|---|---|---|---|---|---|---|---|---|---|---|---|---|---|---|---|---|---|---|---|---|---|---|---|---|
| Author's title | |||||||||||||||||||||||||||||||||||||||||||||
| Author | *The author of this computation has been verified* | ||||||||||||||||||||||||||||||||||||||||||||
| R Software Module | rwasp_univariatedataseries.wasp | ||||||||||||||||||||||||||||||||||||||||||||
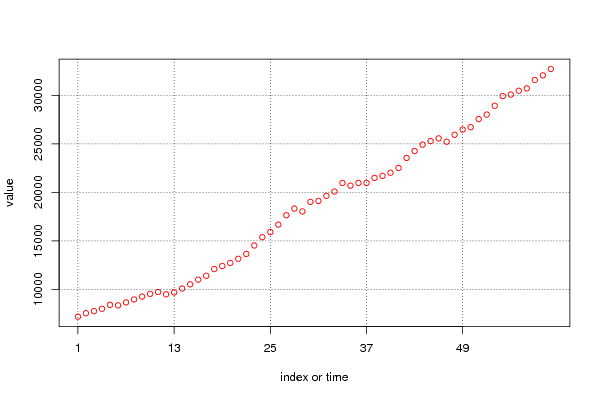
| Title produced by software | Univariate Data Series | ||||||||||||||||||||||||||||||||||||||||||||
| Date of computation | Thu, 24 Nov 2011 10:55:51 -0500 | ||||||||||||||||||||||||||||||||||||||||||||
| Cite this page as follows | Statistical Computations at FreeStatistics.org, Office for Research Development and Education, URL https://freestatistics.org/blog/index.php?v=date/2011/Nov/24/t1322150169zcfjr0m9a808fg9.htm/, Retrieved Sat, 20 Apr 2024 01:21:23 +0000 | ||||||||||||||||||||||||||||||||||||||||||||
| Statistical Computations at FreeStatistics.org, Office for Research Development and Education, URL https://freestatistics.org/blog/index.php?pk=147015, Retrieved Sat, 20 Apr 2024 01:21:23 +0000 | |||||||||||||||||||||||||||||||||||||||||||||
| QR Codes: | |||||||||||||||||||||||||||||||||||||||||||||
|
| |||||||||||||||||||||||||||||||||||||||||||||
| Original text written by user: | |||||||||||||||||||||||||||||||||||||||||||||
| IsPrivate? | No (this computation is public) | ||||||||||||||||||||||||||||||||||||||||||||
| User-defined keywords | |||||||||||||||||||||||||||||||||||||||||||||
| Estimated Impact | 78 | ||||||||||||||||||||||||||||||||||||||||||||
Tree of Dependent Computations | |||||||||||||||||||||||||||||||||||||||||||||
| Family? (F = Feedback message, R = changed R code, M = changed R Module, P = changed Parameters, D = changed Data) | |||||||||||||||||||||||||||||||||||||||||||||
| - [Univariate Data Series] [Arabica Price in ...] [2008-01-05 23:14:31] [74be16979710d4c4e7c6647856088456] - RMPD [Univariate Data Series] [Data Co2 uitstoot] [2011-11-10 23:08:26] [15a5dd358825f04074b70fc847ec6454] - R PD [Univariate Data Series] [Gemiddelde levens...] [2011-11-24 15:49:30] [15a5dd358825f04074b70fc847ec6454] - R PD [Univariate Data Series] [GDP in $2005] [2011-11-24 15:52:40] [15a5dd358825f04074b70fc847ec6454] - PD [Univariate Data Series] [Totale populatie ] [2011-11-24 15:54:48] [15a5dd358825f04074b70fc847ec6454] - PD [Univariate Data Series] [Gemiddeld jaarlij...] [2011-11-24 15:55:51] [614dd89c388120cee0dd25886939832b] [Current] | |||||||||||||||||||||||||||||||||||||||||||||
| Feedback Forum | |||||||||||||||||||||||||||||||||||||||||||||
Post a new message | |||||||||||||||||||||||||||||||||||||||||||||
Dataset | |||||||||||||||||||||||||||||||||||||||||||||
| Dataseries X: | |||||||||||||||||||||||||||||||||||||||||||||
7175,79 7533,41 7749,11 7990,47 8393,42 8343,11 8645,37 8950,31 9244,73 9529,4 9714,96 9477,27 9675,47 10076,6 10512,51 10991,21 11396,13 12089,41 12406,29 12720,18 13149,04 13647,2 14520,74 15379,71 15899,66 16672,14 17639,58 18325,17 18032,12 19019,94 19117,97 19645,54 20090,12 20969,62 20696,13 20979,85 20979,01 21498,94 21708,75 22024,75 22525,56 23555,82 24269,23 24925,91 25293,57 25575,57 25229,6 25947,3 26480,95 26725,5 27561,2 28030,61 28937,15 29940,2 30092,08 30485,88 30736,53 31600,02 32077 32738,41 | |||||||||||||||||||||||||||||||||||||||||||||
Tables (Output of Computation) | |||||||||||||||||||||||||||||||||||||||||||||
| |||||||||||||||||||||||||||||||||||||||||||||
Figures (Output of Computation) | |||||||||||||||||||||||||||||||||||||||||||||
Input Parameters & R Code | |||||||||||||||||||||||||||||||||||||||||||||
| Parameters (Session): | |||||||||||||||||||||||||||||||||||||||||||||
| par1 = Gemiddeld jaarlijks inkomen per persoon (in $2005) ; par2 = www.gapminder.org ; par3 = Gemiddeld jaarlijks inkomen per persoon (in $2005) ; par4 = 12 ; | |||||||||||||||||||||||||||||||||||||||||||||
| Parameters (R input): | |||||||||||||||||||||||||||||||||||||||||||||
| par1 = Gemiddeld jaarlijks inkomen per persoon (in $2005) ; par2 = www.gapminder.org ; par3 = Gemiddeld jaarlijks inkomen per persoon (in $2005) ; par4 = 12 ; | |||||||||||||||||||||||||||||||||||||||||||||
| R code (references can be found in the software module): | |||||||||||||||||||||||||||||||||||||||||||||
if (par4 != 'No season') { | |||||||||||||||||||||||||||||||||||||||||||||