Free Statistics
of Irreproducible Research!
Description of Statistical Computation | |||||||||||||||||||||||||||||||||||||||||
|---|---|---|---|---|---|---|---|---|---|---|---|---|---|---|---|---|---|---|---|---|---|---|---|---|---|---|---|---|---|---|---|---|---|---|---|---|---|---|---|---|---|
| Author's title | |||||||||||||||||||||||||||||||||||||||||
| Author | *Unverified author* | ||||||||||||||||||||||||||||||||||||||||
| R Software Module | rwasp_univariatedataseries.wasp | ||||||||||||||||||||||||||||||||||||||||
| Title produced by software | Univariate Data Series | ||||||||||||||||||||||||||||||||||||||||
| Date of computation | Thu, 24 Nov 2011 10:52:37 -0500 | ||||||||||||||||||||||||||||||||||||||||
| Cite this page as follows | Statistical Computations at FreeStatistics.org, Office for Research Development and Education, URL https://freestatistics.org/blog/index.php?v=date/2011/Nov/24/t1322149983lzyl4wwdc14wsip.htm/, Retrieved Thu, 25 Apr 2024 04:46:51 +0000 | ||||||||||||||||||||||||||||||||||||||||
| Statistical Computations at FreeStatistics.org, Office for Research Development and Education, URL https://freestatistics.org/blog/index.php?pk=147009, Retrieved Thu, 25 Apr 2024 04:46:51 +0000 | |||||||||||||||||||||||||||||||||||||||||
| QR Codes: | |||||||||||||||||||||||||||||||||||||||||
|
| |||||||||||||||||||||||||||||||||||||||||
| Original text written by user: | |||||||||||||||||||||||||||||||||||||||||
| IsPrivate? | No (this computation is public) | ||||||||||||||||||||||||||||||||||||||||
| User-defined keywords | |||||||||||||||||||||||||||||||||||||||||
| Estimated Impact | 108 | ||||||||||||||||||||||||||||||||||||||||
Tree of Dependent Computations | |||||||||||||||||||||||||||||||||||||||||
| Family? (F = Feedback message, R = changed R code, M = changed R Module, P = changed Parameters, D = changed Data) | |||||||||||||||||||||||||||||||||||||||||
| - [Univariate Explorative Data Analysis] [Run Sequence gebo...] [2008-12-12 13:32:37] [76963dc1903f0f612b6153510a3818cf] - R D [Univariate Explorative Data Analysis] [Run Sequence gebo...] [2008-12-17 12:14:40] [76963dc1903f0f612b6153510a3818cf] - [Univariate Explorative Data Analysis] [Run Sequence Plot...] [2008-12-22 18:19:51] [1ce0d16c8f4225c977b42c8fa93bc163] - RMP [Univariate Data Series] [Identifying Integ...] [2009-11-22 12:08:06] [b98453cac15ba1066b407e146608df68] - PD [Univariate Data Series] [WS 8, maandelijks...] [2010-11-28 09:47:18] [d946de7cca328fbcf207448a112523ab] - PD [Univariate Data Series] [WS 8, maandelijks...] [2010-11-28 12:21:51] [d946de7cca328fbcf207448a112523ab] - PD [Univariate Data Series] [Workshop 8, maand...] [2010-11-28 19:48:13] [d946de7cca328fbcf207448a112523ab] - R PD [Univariate Data Series] [] [2011-11-24 15:52:37] [d41d8cd98f00b204e9800998ecf8427e] [Current] | |||||||||||||||||||||||||||||||||||||||||
| Feedback Forum | |||||||||||||||||||||||||||||||||||||||||
Post a new message | |||||||||||||||||||||||||||||||||||||||||
Dataset | |||||||||||||||||||||||||||||||||||||||||
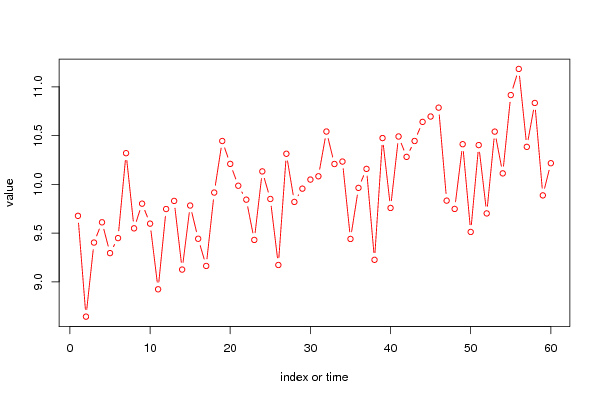
| Dataseries X: | |||||||||||||||||||||||||||||||||||||||||
9,676 8.642 9.402 9.610 9.294 9.448 10.319 9.548 9.801 9.596 8.923 9.746 9.829 9.125 9.782 9.441 9.162 9.915 10.444 10.209 9.985 9.842 9.429 10.132 9.849 9.172 10.313 9.819 9.955 10.048 10.082 10.541 10.208 10.233 9.439 9.963 10.158 9.225 10.474 9.757 10.490 10.281 10.444 10.640 10.695 10.786 9.832 9.747 10.411 9.511 10.402 9.701 10.540 10.112 10.915 11.183 10.384 10.834 9.886 10.216 | |||||||||||||||||||||||||||||||||||||||||
Tables (Output of Computation) | |||||||||||||||||||||||||||||||||||||||||
| |||||||||||||||||||||||||||||||||||||||||
Figures (Output of Computation) | |||||||||||||||||||||||||||||||||||||||||
Input Parameters & R Code | |||||||||||||||||||||||||||||||||||||||||
| Parameters (Session): | |||||||||||||||||||||||||||||||||||||||||
| par1 = Maandelijkse geboortecijfer ; par2 = http://statbel.fgov.be/nl/modules/publications/statistiques/bevolking/downloads/levendgeborenen_geboortemaand.jsp ; par3 = Maandelijkse geboortecijfer ; par4 = 12 ; | |||||||||||||||||||||||||||||||||||||||||
| Parameters (R input): | |||||||||||||||||||||||||||||||||||||||||
| par1 = Maandelijkse geboortecijfer ; par2 = http://statbel.fgov.be/nl/modules/publications/statistiques/bevolking/downloads/levendgeborenen_geboortemaand.jsp ; par3 = Maandelijkse geboortecijfer ; par4 = 12 ; | |||||||||||||||||||||||||||||||||||||||||
| R code (references can be found in the software module): | |||||||||||||||||||||||||||||||||||||||||
bitmap(file='test1.png') | |||||||||||||||||||||||||||||||||||||||||