| Multiple Linear Regression - Estimated Regression Equation |
| Life[t] = + 4.61327584386358 -0.117117672476001Gender[t] -0.0999050687479881Stress[t] -0.819158374021549Depression[t] + 0.227568905682385Effort[t] + 0.0518301959846751Focus[t] -0.000858554732945232Sleep[t] -0.112410064463305Belong[t] + e[t] |
| Multiple Linear Regression - Ordinary Least Squares | |||||
| Variable | Parameter | S.D. | T-STAT H0: parameter = 0 | 2-tail p-value | 1-tail p-value |
| (Intercept) | 4.61327584386358 | 0.46128 | 10.001 | 0 | 0 |
| Gender | -0.117117672476001 | 0.179048 | -0.6541 | 0.516226 | 0.258113 |
| Stress | -0.0999050687479881 | 0.102352 | -0.9761 | 0.334017 | 0.167008 |
| Depression | -0.819158374021549 | 0.147813 | -5.5419 | 1e-06 | 1e-06 |
| Effort | 0.227568905682385 | 0.126653 | 1.7968 | 0.078797 | 0.039398 |
| Focus | 0.0518301959846751 | 0.100729 | 0.5146 | 0.609278 | 0.304639 |
| Sleep | -0.000858554732945232 | 0.084797 | -0.0101 | 0.991965 | 0.495982 |
| Belong | -0.112410064463305 | 0.088923 | -1.2641 | 0.212418 | 0.106209 |
| Multiple Linear Regression - Regression Statistics | |
| Multiple R | 0.690977874552319 |
| R-squared | 0.477450423120841 |
| Adjusted R-squared | 0.399623890394157 |
| F-TEST (value) | 6.13480270022545 |
| F-TEST (DF numerator) | 7 |
| F-TEST (DF denominator) | 47 |
| p-value | 4.03512907229953e-05 |
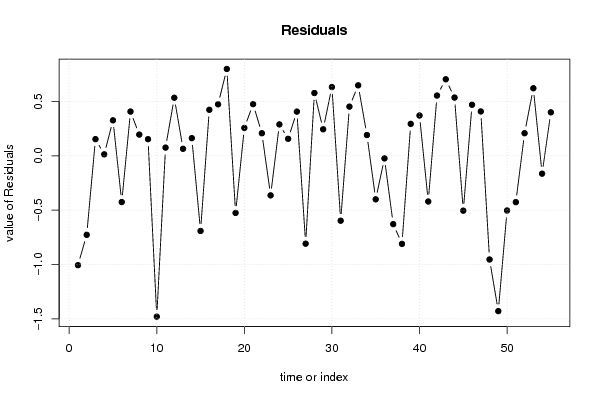
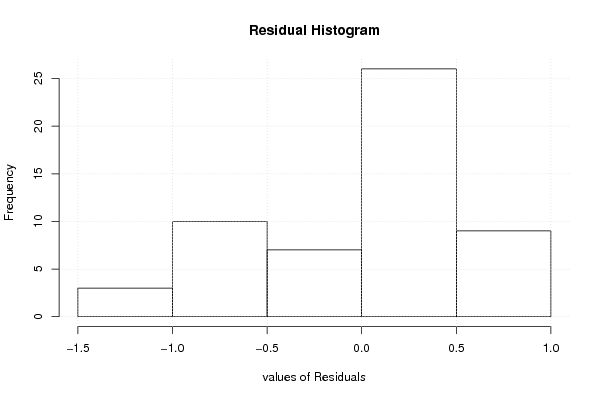
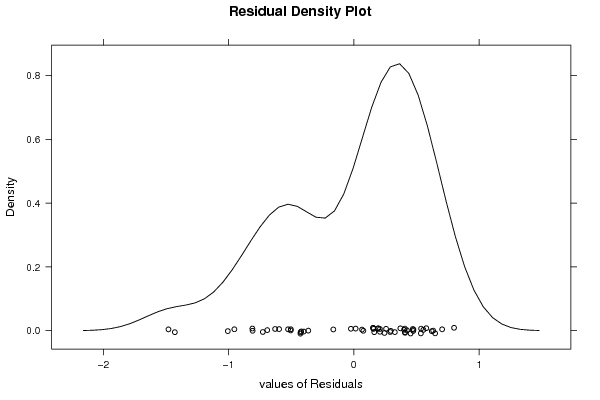
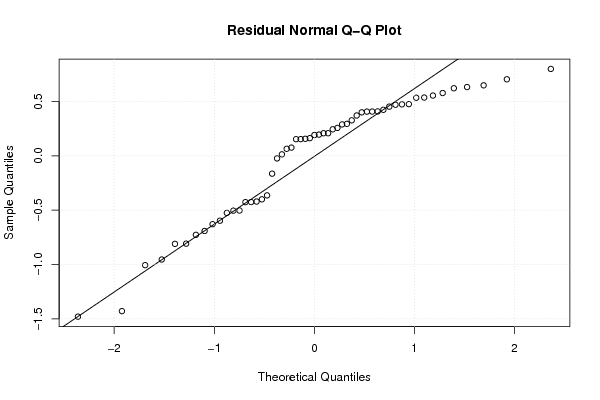
| Multiple Linear Regression - Residual Statistics | |
| Residual Standard Deviation | 0.600524736742799 |
| Sum Squared Residuals | 16.9496080936804 |
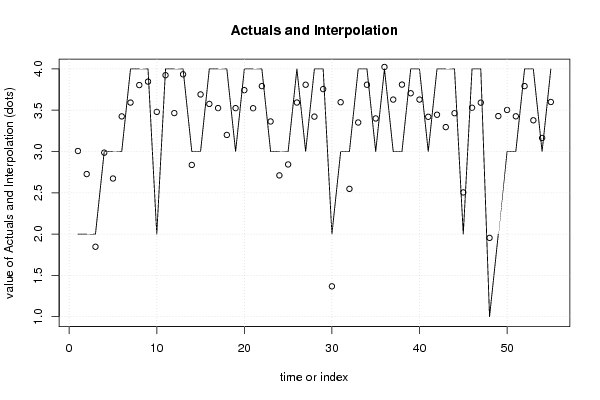
| Multiple Linear Regression - Actuals, Interpolation, and Residuals | |||
| Time or Index | Actuals | Interpolation Forecast | Residuals Prediction Error |
| 1 | 2 | 3.00640457799416 | -1.00640457799416 |
| 2 | 2 | 2.7270054763271 | -0.727005476327104 |
| 3 | 2 | 1.84648806159253 | 0.153511938407469 |
| 4 | 3 | 2.98644319751037 | 0.0135568024896252 |
| 5 | 3 | 2.67336444081815 | 0.326635559181851 |
| 6 | 3 | 3.42543884638393 | -0.425438846383931 |
| 7 | 4 | 3.59266960537872 | 0.407330394621283 |
| 8 | 4 | 3.80474301679898 | 0.195256983201021 |
| 9 | 4 | 3.8468856030582 | 0.153114396941796 |
| 10 | 2 | 3.48001781912438 | -1.48001781912438 |
| 11 | 4 | 3.92451573597237 | 0.0754842640276336 |
| 12 | 4 | 3.46562260138623 | 0.534377398613765 |
| 13 | 4 | 3.93530362222179 | 0.0646963777782074 |
| 14 | 3 | 2.83745670953349 | 0.162543290466512 |
| 15 | 3 | 3.69147439760273 | -0.691474397602729 |
| 16 | 4 | 3.57631555638365 | 0.423684443616351 |
| 17 | 4 | 3.52620246986486 | 0.473797530135135 |
| 18 | 4 | 3.20061871745732 | 0.799381282542678 |
| 19 | 3 | 3.52534391513192 | -0.525343915131919 |
| 20 | 4 | 3.74322521108885 | 0.256774788911146 |
| 21 | 4 | 3.52448536039897 | 0.475514639601026 |
| 22 | 4 | 3.79223802108366 | 0.207761978916337 |
| 23 | 3 | 3.36400042317236 | -0.364000423172357 |
| 24 | 3 | 2.71089314912307 | 0.289106850876933 |
| 25 | 3 | 2.84334397656871 | 0.15665602343129 |
| 26 | 4 | 3.59328643832063 | 0.406713561679368 |
| 27 | 3 | 3.80859207007873 | -0.80859207007873 |
| 28 | 4 | 3.42225533663562 | 0.577744663364382 |
| 29 | 4 | 3.75580958930272 | 0.244190410697279 |
| 30 | 2 | 1.36722927521812 | 0.632770724781879 |
| 31 | 3 | 3.59713549160038 | -0.597135491600383 |
| 32 | 3 | 2.54759082590658 | 0.452409174093418 |
| 33 | 4 | 3.35149542745704 | 0.64850457254296 |
| 34 | 4 | 3.80859207007873 | 0.19140792992127 |
| 35 | 3 | 3.4004288549533 | -0.400428854953298 |
| 36 | 4 | 4.02373598894522 | -0.02373598894522 |
| 37 | 3 | 3.62900430710127 | -0.62900430710127 |
| 38 | 3 | 3.81030917954462 | -0.810309179544621 |
| 39 | 4 | 3.70569650278394 | 0.294303497216064 |
| 40 | 4 | 3.62900430710127 | 0.37099569289873 |
| 41 | 3 | 3.42053822716973 | -0.420538227169728 |
| 42 | 4 | 3.44540022686772 | 0.55459977313228 |
| 43 | 4 | 3.2957330111777 | 0.704266988822296 |
| 44 | 4 | 3.46390549192034 | 0.536094508079656 |
| 45 | 2 | 2.5046582941485 | -0.504658294148504 |
| 46 | 4 | 3.53005152314462 | 0.469948476855384 |
| 47 | 4 | 3.59156932885474 | 0.408430671145259 |
| 48 | 1 | 1.95411113554459 | -0.954111135544589 |
| 49 | 2 | 3.42919416960529 | -1.42919416960529 |
| 50 | 3 | 3.5032306921897 | -0.503230692189703 |
| 51 | 3 | 3.42647051367382 | -0.426470513673816 |
| 52 | 4 | 3.79223802108366 | 0.207761978916337 |
| 53 | 4 | 3.37822252835356 | 0.621777471646436 |
| 54 | 3 | 3.16422012096356 | -0.164220120963557 |
| 55 | 4 | 3.59979053829777 | 0.400209461702231 |
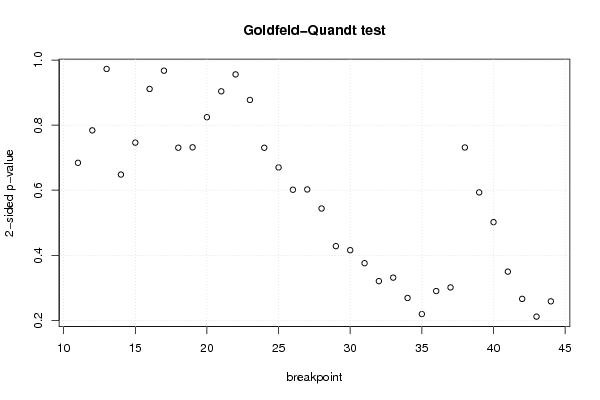
| Goldfeld-Quandt test for Heteroskedasticity | |||
| p-values | Alternative Hypothesis | ||
| breakpoint index | greater | 2-sided | less |
| 11 | 0.342169186758895 | 0.68433837351779 | 0.657830813241105 |
| 12 | 0.607912149594463 | 0.784175700811073 | 0.392087850405537 |
| 13 | 0.486469337687189 | 0.972938675374378 | 0.513530662312811 |
| 14 | 0.675905760965568 | 0.648188478068864 | 0.324094239034432 |
| 15 | 0.626862749673029 | 0.746274500653941 | 0.373137250326971 |
| 16 | 0.544311422085346 | 0.911377155829307 | 0.455688577914654 |
| 17 | 0.483763036959007 | 0.967526073918014 | 0.516236963040993 |
| 18 | 0.634641553928043 | 0.730716892143914 | 0.365358446071957 |
| 19 | 0.633990509542655 | 0.732018980914691 | 0.366009490457345 |
| 20 | 0.587692217824872 | 0.824615564350255 | 0.412307782175127 |
| 21 | 0.547915564002119 | 0.904168871995762 | 0.452084435997881 |
| 22 | 0.478101763307647 | 0.956203526615293 | 0.521898236692353 |
| 23 | 0.438814775903376 | 0.877629551806753 | 0.561185224096624 |
| 24 | 0.365326226140836 | 0.730652452281672 | 0.634673773859164 |
| 25 | 0.33505141225161 | 0.67010282450322 | 0.66494858774839 |
| 26 | 0.30073706120561 | 0.601474122411219 | 0.69926293879439 |
| 27 | 0.301194715939484 | 0.602389431878969 | 0.698805284060515 |
| 28 | 0.271895855278505 | 0.54379171055701 | 0.728104144721495 |
| 29 | 0.214049059305271 | 0.428098118610543 | 0.785950940694729 |
| 30 | 0.207811923537853 | 0.415623847075706 | 0.792188076462147 |
| 31 | 0.187808839734977 | 0.375617679469953 | 0.812191160265023 |
| 32 | 0.160277961345199 | 0.320555922690397 | 0.839722038654801 |
| 33 | 0.165622167260454 | 0.331244334520907 | 0.834377832739546 |
| 34 | 0.134360837645726 | 0.268721675291452 | 0.865639162354274 |
| 35 | 0.109635031472237 | 0.219270062944474 | 0.890364968527763 |
| 36 | 0.145014056337768 | 0.290028112675536 | 0.854985943662232 |
| 37 | 0.150624673157856 | 0.301249346315712 | 0.849375326842144 |
| 38 | 0.365730881194838 | 0.731461762389675 | 0.634269118805162 |
| 39 | 0.296662924314097 | 0.593325848628194 | 0.703337075685903 |
| 40 | 0.250940677352482 | 0.501881354704965 | 0.749059322647518 |
| 41 | 0.174824348922262 | 0.349648697844523 | 0.825175651077738 |
| 42 | 0.132975372067987 | 0.265950744135973 | 0.867024627932013 |
| 43 | 0.105632781618376 | 0.211265563236753 | 0.894367218381624 |
| 44 | 0.129200212206232 | 0.258400424412464 | 0.870799787793768 |
| Meta Analysis of Goldfeld-Quandt test for Heteroskedasticity | |||
| Description | # significant tests | % significant tests | OK/NOK |
| 1% type I error level | 0 | 0 | OK |
| 5% type I error level | 0 | 0 | OK |
| 10% type I error level | 0 | 0 | OK |