| Multiple Linear Regression - Estimated Regression Equation |
| aantal_WNs[t] = + 133767.4 + 838.200000000061M1[t] + 750.4M2[t] + 716.200000000001M3[t] + 654.8M4[t] + 653.000000000001M5[t] + 508.000000000001M6[t] + 422.6M7[t] + 343.000000000001M8[t] + 248.2M9[t] + 153.000000000001M10[t] + 66.6000000000005M11[t] + e[t] |
| Multiple Linear Regression - Ordinary Least Squares | |||||
| Variable | Parameter | S.D. | T-STAT H0: parameter = 0 | 2-tail p-value | 1-tail p-value |
| (Intercept) | 133767.4 | 1668.141325 | 80.1895 | 0 | 0 |
| M1 | 838.200000000061 | 2359.108086 | 0.3553 | 0.723919 | 0.361959 |
| M2 | 750.4 | 2359.108086 | 0.3181 | 0.751799 | 0.3759 |
| M3 | 716.200000000001 | 2359.108086 | 0.3036 | 0.762753 | 0.381376 |
| M4 | 654.8 | 2359.108086 | 0.2776 | 0.78254 | 0.39127 |
| M5 | 653.000000000001 | 2359.108086 | 0.2768 | 0.783123 | 0.391561 |
| M6 | 508.000000000001 | 2359.108086 | 0.2153 | 0.830418 | 0.415209 |
| M7 | 422.6 | 2359.108086 | 0.1791 | 0.858585 | 0.429293 |
| M8 | 343.000000000001 | 2359.108086 | 0.1454 | 0.885009 | 0.442504 |
| M9 | 248.2 | 2359.108086 | 0.1052 | 0.916648 | 0.458324 |
| M10 | 153.000000000001 | 2359.108086 | 0.0649 | 0.948559 | 0.474279 |
| M11 | 66.6000000000005 | 2359.108086 | 0.0282 | 0.977595 | 0.488797 |
| Multiple Linear Regression - Regression Statistics | |
| Multiple R | 0.0813019394731372 |
| R-squared | 0.00661000536209366 |
| Adjusted R-squared | -0.221041868409093 |
| F-TEST (value) | 0.0290355851352991 |
| F-TEST (DF numerator) | 11 |
| F-TEST (DF denominator) | 48 |
| p-value | 0.999999801881925 |
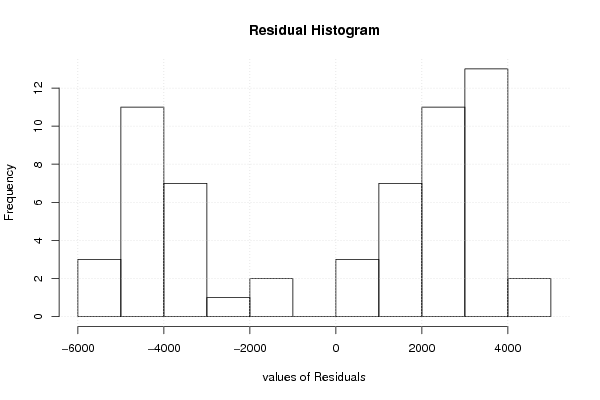
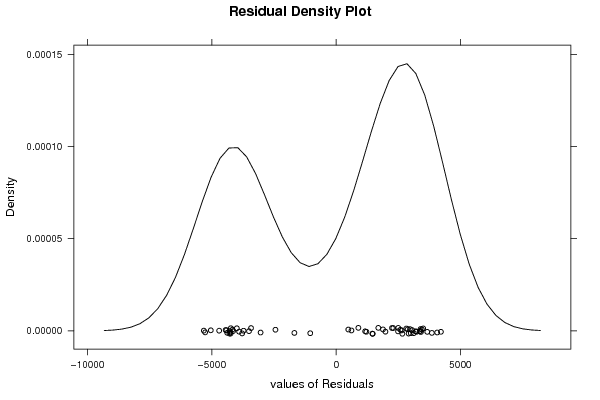
| Multiple Linear Regression - Residual Statistics | |
| Residual Standard Deviation | 3730.07739866078 |
| Sum Squared Residuals | 667846915.2 |
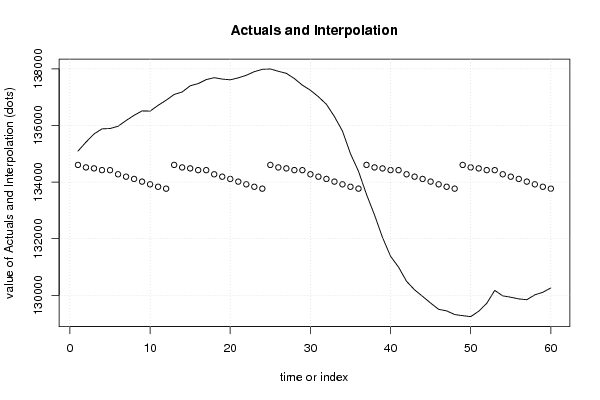
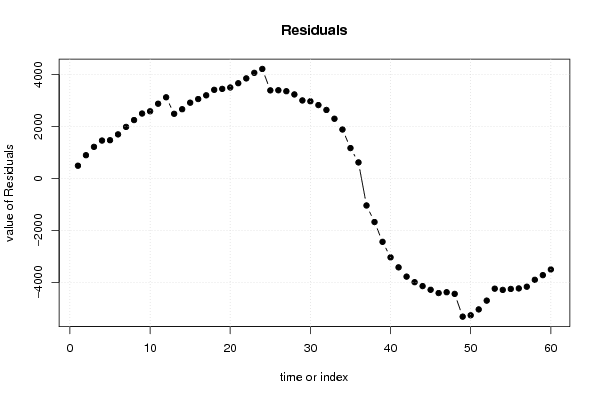
| Multiple Linear Regression - Actuals, Interpolation, and Residuals | |||
| Time or Index | Actuals | Interpolation Forecast | Residuals Prediction Error |
| 1 | 135094 | 134605.6 | 488.400000000243 |
| 2 | 135411 | 134517.8 | 893.200000000001 |
| 3 | 135698 | 134483.6 | 1214.4 |
| 4 | 135880 | 134422.2 | 1457.8 |
| 5 | 135891 | 134420.4 | 1470.6 |
| 6 | 135971 | 134275.4 | 1695.6 |
| 7 | 136173 | 134190 | 1983 |
| 8 | 136358 | 134110.4 | 2247.6 |
| 9 | 136514 | 134015.6 | 2498.4 |
| 10 | 136506 | 133920.4 | 2585.6 |
| 11 | 136711 | 133834 | 2877 |
| 12 | 136891 | 133767.4 | 3123.6 |
| 13 | 137094 | 134605.6 | 2488.39999999994 |
| 14 | 137182 | 134517.8 | 2664.2 |
| 15 | 137400 | 134483.6 | 2916.4 |
| 16 | 137479 | 134422.2 | 3056.8 |
| 17 | 137620 | 134420.4 | 3199.6 |
| 18 | 137687 | 134275.4 | 3411.6 |
| 19 | 137638 | 134190 | 3448 |
| 20 | 137612 | 134110.4 | 3501.6 |
| 21 | 137681 | 134015.6 | 3665.4 |
| 22 | 137772 | 133920.4 | 3851.6 |
| 23 | 137899 | 133834 | 4065 |
| 24 | 137983 | 133767.4 | 4215.6 |
| 25 | 137996 | 134605.6 | 3390.39999999994 |
| 26 | 137913 | 134517.8 | 3395.2 |
| 27 | 137841 | 134483.6 | 3357.4 |
| 28 | 137656 | 134422.2 | 3233.8 |
| 29 | 137423 | 134420.4 | 3002.6 |
| 30 | 137245 | 134275.4 | 2969.6 |
| 31 | 137014 | 134190 | 2824 |
| 32 | 136747 | 134110.4 | 2636.6 |
| 33 | 136313 | 134015.6 | 2297.4 |
| 34 | 135804 | 133920.4 | 1883.6 |
| 35 | 135002 | 133834 | 1168 |
| 36 | 134383 | 133767.4 | 615.600000000001 |
| 37 | 133563 | 134605.6 | -1042.60000000006 |
| 38 | 132837 | 134517.8 | -1680.8 |
| 39 | 132041 | 134483.6 | -2442.6 |
| 40 | 131381 | 134422.2 | -3041.2 |
| 41 | 130995 | 134420.4 | -3425.4 |
| 42 | 130493 | 134275.4 | -3782.4 |
| 43 | 130193 | 134190 | -3997 |
| 44 | 129962 | 134110.4 | -4148.4 |
| 45 | 129726 | 134015.6 | -4289.6 |
| 46 | 129505 | 133920.4 | -4415.4 |
| 47 | 129450 | 133834 | -4384 |
| 48 | 129320 | 133767.4 | -4447.4 |
| 49 | 129281 | 134605.6 | -5324.60000000006 |
| 50 | 129246 | 134517.8 | -5271.8 |
| 51 | 129438 | 134483.6 | -5045.6 |
| 52 | 129715 | 134422.2 | -4707.2 |
| 53 | 130173 | 134420.4 | -4247.4 |
| 54 | 129981 | 134275.4 | -4294.4 |
| 55 | 129932 | 134190 | -4258 |
| 56 | 129873 | 134110.4 | -4237.4 |
| 57 | 129844 | 134015.6 | -4171.6 |
| 58 | 130015 | 133920.4 | -3905.4 |
| 59 | 130108 | 133834 | -3726 |
| 60 | 130260 | 133767.4 | -3507.4 |
| Goldfeld-Quandt test for Heteroskedasticity | |||
| p-values | Alternative Hypothesis | ||
| breakpoint index | greater | 2-sided | less |
| 15 | 0.0385805624763835 | 0.077161124952767 | 0.961419437523616 |
| 16 | 0.0152353332831088 | 0.0304706665662176 | 0.984764666716891 |
| 17 | 0.00667565894006664 | 0.0133513178801333 | 0.993324341059933 |
| 18 | 0.00303858815617252 | 0.00607717631234505 | 0.996961411843827 |
| 19 | 0.00127394664905632 | 0.00254789329811265 | 0.998726053350944 |
| 20 | 0.000506101089184708 | 0.00101220217836942 | 0.999493898910815 |
| 21 | 0.000203923609182141 | 0.000407847218364283 | 0.999796076390818 |
| 22 | 9.14029122269749e-05 | 0.00018280582445395 | 0.999908597087773 |
| 23 | 4.3640236000585e-05 | 8.728047200117e-05 | 0.999956359763999 |
| 24 | 2.24346524770755e-05 | 4.48693049541509e-05 | 0.999977565347523 |
| 25 | 2.33923087397346e-05 | 4.67846174794692e-05 | 0.99997660769126 |
| 26 | 2.17182092864902e-05 | 4.34364185729805e-05 | 0.999978281790713 |
| 27 | 1.94075850044482e-05 | 3.88151700088963e-05 | 0.999980592414996 |
| 28 | 1.75925091905906e-05 | 3.51850183811813e-05 | 0.999982407490809 |
| 29 | 1.61494349028508e-05 | 3.22988698057015e-05 | 0.999983850565097 |
| 30 | 1.88928963067336e-05 | 3.77857926134672e-05 | 0.999981107103693 |
| 31 | 2.94395348604482e-05 | 5.88790697208965e-05 | 0.99997056046514 |
| 32 | 7.0006991335387e-05 | 0.000140013982670774 | 0.999929993008665 |
| 33 | 0.000294408693470374 | 0.000588817386940747 | 0.99970559130653 |
| 34 | 0.00228554994960076 | 0.00457109989920152 | 0.997714450050399 |
| 35 | 0.0270096474542842 | 0.0540192949085684 | 0.972990352545716 |
| 36 | 0.245245448454641 | 0.490490896909283 | 0.754754551545359 |
| 37 | 0.702785253375283 | 0.594429493249435 | 0.297214746624717 |
| 38 | 0.971921535319173 | 0.0561569293616547 | 0.0280784646808273 |
| 39 | 0.998988548933366 | 0.00202290213326814 | 0.00101145106663407 |
| 40 | 0.999925478081012 | 0.000149043837976863 | 7.45219189884314e-05 |
| 41 | 0.999944875282337 | 0.000110249435325945 | 5.51247176629727e-05 |
| 42 | 0.999894746685372 | 0.000210506629255225 | 0.000105253314627613 |
| 43 | 0.999631805216555 | 0.000736389566890558 | 0.000368194783445279 |
| 44 | 0.998323990870071 | 0.00335201825985811 | 0.00167600912992905 |
| 45 | 0.991652682807228 | 0.0166946343855434 | 0.0083473171927717 |
| Meta Analysis of Goldfeld-Quandt test for Heteroskedasticity | |||
| Description | # significant tests | % significant tests | OK/NOK |
| 1% type I error level | 23 | 0.741935483870968 | NOK |
| 5% type I error level | 26 | 0.838709677419355 | NOK |
| 10% type I error level | 29 | 0.935483870967742 | NOK |