Free Statistics

of Irreproducible Research!

Author's title

Author*The author of this computation has been verified*
R Software Modulerwasp_multipleregression.wasp
Title produced by softwareMultiple Regression
Date of computationThu, 24 Nov 2011 10:06:21 -0500
Cite this page as followsStatistical Computations at FreeStatistics.org, Office for Research Development and Education, URL https://freestatistics.org/blog/index.php?v=date/2011/Nov/24/t13221471917hgpp727yh3gok5.htm/, Retrieved Thu, 25 Apr 2024 01:39:41 +0000
Statistical Computations at FreeStatistics.org, Office for Research Development and Education, URL https://freestatistics.org/blog/index.php?pk=146924, Retrieved Thu, 25 Apr 2024 01:39:41 +0000
QR Codes:

Original text written by user:
IsPrivate?No (this computation is public)
User-defined keywords
Estimated Impact84
Family? (F = Feedback message, R = changed R code, M = changed R Module, P = changed Parameters, D = changed Data)
-     [Univariate Data Series] [data set] [2008-12-01 19:54:57] [b98453cac15ba1066b407e146608df68]
- RMPD  [Univariate Data Series] [] [2011-11-24 13:29:35] [22f8bc702946f784836540059d0d9516]
- RMP     [Classical Decomposition] [] [2011-11-24 14:18:49] [22f8bc702946f784836540059d0d9516]
- RMP       [Multiple Regression] [multiple regression] [2011-11-24 14:58:43] [22f8bc702946f784836540059d0d9516]
- R P           [Multiple Regression] [] [2011-11-24 15:06:21] [76a85a4cc6ea7903d92a0f5b9d2872d3] [Current]
Feedback Forum

Post a new message
Dataseries X:
135094
135411
135698
135880
135891
135971
136173
136358
136514
136506
136711
136891
137094
137182
137400
137479
137620
137687
137638
137612
137681
137772
137899
137983
137996
137913
137841
137656
137423
137245
137014
136747
136313
135804
135002
134383
133563
132837
132041
131381
130995
130493
130193
129962
129726
129505
129450
129320
129281
129246
129438
129715
130173
129981
129932
129873
129844
130015
130108
130260


Summary of computational transaction
Raw Inputview raw input (R code)
Raw Outputview raw output of R engine
Computing time4 seconds
R Server'Gwilym Jenkins' @ jenkins.wessa.net

\begin{tabular}{lllllllll}
\hline
Summary of computational transaction \tabularnewline
Raw Input & view raw input (R code)  \tabularnewline
Raw Output & view raw output of R engine  \tabularnewline
Computing time & 4 seconds \tabularnewline
R Server & 'Gwilym Jenkins' @ jenkins.wessa.net \tabularnewline
\hline
\end{tabular}
%Source: https://freestatistics.org/blog/index.php?pk=146924&T=0

[TABLE]
[ROW][C]Summary of computational transaction[/C][/ROW]
[ROW][C]Raw Input[/C][C]view raw input (R code) [/C][/ROW]
[ROW][C]Raw Output[/C][C]view raw output of R engine [/C][/ROW]
[ROW][C]Computing time[/C][C]4 seconds[/C][/ROW]
[ROW][C]R Server[/C][C]'Gwilym Jenkins' @ jenkins.wessa.net[/C][/ROW]
[/TABLE]
Source: https://freestatistics.org/blog/index.php?pk=146924&T=0

Globally Unique Identifier (entire table): ba.freestatistics.org/blog/index.php?pk=146924&T=0

As an alternative you can also use a QR Code:  

The GUIDs for individual cells are displayed in the table below:

Summary of computational transaction
Raw Inputview raw input (R code)
Raw Outputview raw output of R engine
Computing time4 seconds
R Server'Gwilym Jenkins' @ jenkins.wessa.net


Multiple Linear Regression - Estimated Regression Equation
aantal_WNs[t] = + 133767.4 + 838.200000000061M1[t] + 750.4M2[t] + 716.200000000001M3[t] + 654.8M4[t] + 653.000000000001M5[t] + 508.000000000001M6[t] + 422.6M7[t] + 343.000000000001M8[t] + 248.2M9[t] + 153.000000000001M10[t] + 66.6000000000005M11[t] + e[t]

\begin{tabular}{lllllllll}
\hline
Multiple Linear Regression - Estimated Regression Equation \tabularnewline
aantal_WNs[t] =  +  133767.4 +  838.200000000061M1[t] +  750.4M2[t] +  716.200000000001M3[t] +  654.8M4[t] +  653.000000000001M5[t] +  508.000000000001M6[t] +  422.6M7[t] +  343.000000000001M8[t] +  248.2M9[t] +  153.000000000001M10[t] +  66.6000000000005M11[t]  + e[t] \tabularnewline
\hline
\end{tabular}
%Source: https://freestatistics.org/blog/index.php?pk=146924&T=1

[TABLE]
[ROW][C]Multiple Linear Regression - Estimated Regression Equation[/C][/ROW]
[ROW][C]aantal_WNs[t] =  +  133767.4 +  838.200000000061M1[t] +  750.4M2[t] +  716.200000000001M3[t] +  654.8M4[t] +  653.000000000001M5[t] +  508.000000000001M6[t] +  422.6M7[t] +  343.000000000001M8[t] +  248.2M9[t] +  153.000000000001M10[t] +  66.6000000000005M11[t]  + e[t][/C][/ROW]
[/TABLE]
Source: https://freestatistics.org/blog/index.php?pk=146924&T=1

Globally Unique Identifier (entire table): ba.freestatistics.org/blog/index.php?pk=146924&T=1

As an alternative you can also use a QR Code:  

The GUIDs for individual cells are displayed in the table below:

Multiple Linear Regression - Estimated Regression Equation
aantal_WNs[t] = + 133767.4 + 838.200000000061M1[t] + 750.4M2[t] + 716.200000000001M3[t] + 654.8M4[t] + 653.000000000001M5[t] + 508.000000000001M6[t] + 422.6M7[t] + 343.000000000001M8[t] + 248.2M9[t] + 153.000000000001M10[t] + 66.6000000000005M11[t] + e[t]


Multiple Linear Regression - Ordinary Least Squares
VariableParameterS.D.T-STATH0: parameter = 02-tail p-value1-tail p-value
(Intercept)133767.41668.14132580.189500
M1838.2000000000612359.1080860.35530.7239190.361959
M2750.42359.1080860.31810.7517990.3759
M3716.2000000000012359.1080860.30360.7627530.381376
M4654.82359.1080860.27760.782540.39127
M5653.0000000000012359.1080860.27680.7831230.391561
M6508.0000000000012359.1080860.21530.8304180.415209
M7422.62359.1080860.17910.8585850.429293
M8343.0000000000012359.1080860.14540.8850090.442504
M9248.22359.1080860.10520.9166480.458324
M10153.0000000000012359.1080860.06490.9485590.474279
M1166.60000000000052359.1080860.02820.9775950.488797

\begin{tabular}{lllllllll}
\hline
Multiple Linear Regression - Ordinary Least Squares \tabularnewline
Variable & Parameter & S.D. & T-STATH0: parameter = 0 & 2-tail p-value & 1-tail p-value \tabularnewline
(Intercept) & 133767.4 & 1668.141325 & 80.1895 & 0 & 0 \tabularnewline
M1 & 838.200000000061 & 2359.108086 & 0.3553 & 0.723919 & 0.361959 \tabularnewline
M2 & 750.4 & 2359.108086 & 0.3181 & 0.751799 & 0.3759 \tabularnewline
M3 & 716.200000000001 & 2359.108086 & 0.3036 & 0.762753 & 0.381376 \tabularnewline
M4 & 654.8 & 2359.108086 & 0.2776 & 0.78254 & 0.39127 \tabularnewline
M5 & 653.000000000001 & 2359.108086 & 0.2768 & 0.783123 & 0.391561 \tabularnewline
M6 & 508.000000000001 & 2359.108086 & 0.2153 & 0.830418 & 0.415209 \tabularnewline
M7 & 422.6 & 2359.108086 & 0.1791 & 0.858585 & 0.429293 \tabularnewline
M8 & 343.000000000001 & 2359.108086 & 0.1454 & 0.885009 & 0.442504 \tabularnewline
M9 & 248.2 & 2359.108086 & 0.1052 & 0.916648 & 0.458324 \tabularnewline
M10 & 153.000000000001 & 2359.108086 & 0.0649 & 0.948559 & 0.474279 \tabularnewline
M11 & 66.6000000000005 & 2359.108086 & 0.0282 & 0.977595 & 0.488797 \tabularnewline
\hline
\end{tabular}
%Source: https://freestatistics.org/blog/index.php?pk=146924&T=2

[TABLE]
[ROW][C]Multiple Linear Regression - Ordinary Least Squares[/C][/ROW]
[ROW][C]Variable[/C][C]Parameter[/C][C]S.D.[/C][C]T-STATH0: parameter = 0[/C][C]2-tail p-value[/C][C]1-tail p-value[/C][/ROW]
[ROW][C](Intercept)[/C][C]133767.4[/C][C]1668.141325[/C][C]80.1895[/C][C]0[/C][C]0[/C][/ROW]
[ROW][C]M1[/C][C]838.200000000061[/C][C]2359.108086[/C][C]0.3553[/C][C]0.723919[/C][C]0.361959[/C][/ROW]
[ROW][C]M2[/C][C]750.4[/C][C]2359.108086[/C][C]0.3181[/C][C]0.751799[/C][C]0.3759[/C][/ROW]
[ROW][C]M3[/C][C]716.200000000001[/C][C]2359.108086[/C][C]0.3036[/C][C]0.762753[/C][C]0.381376[/C][/ROW]
[ROW][C]M4[/C][C]654.8[/C][C]2359.108086[/C][C]0.2776[/C][C]0.78254[/C][C]0.39127[/C][/ROW]
[ROW][C]M5[/C][C]653.000000000001[/C][C]2359.108086[/C][C]0.2768[/C][C]0.783123[/C][C]0.391561[/C][/ROW]
[ROW][C]M6[/C][C]508.000000000001[/C][C]2359.108086[/C][C]0.2153[/C][C]0.830418[/C][C]0.415209[/C][/ROW]
[ROW][C]M7[/C][C]422.6[/C][C]2359.108086[/C][C]0.1791[/C][C]0.858585[/C][C]0.429293[/C][/ROW]
[ROW][C]M8[/C][C]343.000000000001[/C][C]2359.108086[/C][C]0.1454[/C][C]0.885009[/C][C]0.442504[/C][/ROW]
[ROW][C]M9[/C][C]248.2[/C][C]2359.108086[/C][C]0.1052[/C][C]0.916648[/C][C]0.458324[/C][/ROW]
[ROW][C]M10[/C][C]153.000000000001[/C][C]2359.108086[/C][C]0.0649[/C][C]0.948559[/C][C]0.474279[/C][/ROW]
[ROW][C]M11[/C][C]66.6000000000005[/C][C]2359.108086[/C][C]0.0282[/C][C]0.977595[/C][C]0.488797[/C][/ROW]
[/TABLE]
Source: https://freestatistics.org/blog/index.php?pk=146924&T=2

Globally Unique Identifier (entire table): ba.freestatistics.org/blog/index.php?pk=146924&T=2

As an alternative you can also use a QR Code:  

The GUIDs for individual cells are displayed in the table below:

Multiple Linear Regression - Ordinary Least Squares
VariableParameterS.D.T-STATH0: parameter = 02-tail p-value1-tail p-value
(Intercept)133767.41668.14132580.189500
M1838.2000000000612359.1080860.35530.7239190.361959
M2750.42359.1080860.31810.7517990.3759
M3716.2000000000012359.1080860.30360.7627530.381376
M4654.82359.1080860.27760.782540.39127
M5653.0000000000012359.1080860.27680.7831230.391561
M6508.0000000000012359.1080860.21530.8304180.415209
M7422.62359.1080860.17910.8585850.429293
M8343.0000000000012359.1080860.14540.8850090.442504
M9248.22359.1080860.10520.9166480.458324
M10153.0000000000012359.1080860.06490.9485590.474279
M1166.60000000000052359.1080860.02820.9775950.488797


Multiple Linear Regression - Regression Statistics
Multiple R0.0813019394731372
R-squared0.00661000536209366
Adjusted R-squared-0.221041868409093
F-TEST (value)0.0290355851352991
F-TEST (DF numerator)11
F-TEST (DF denominator)48
p-value0.999999801881925
Multiple Linear Regression - Residual Statistics
Residual Standard Deviation3730.07739866078
Sum Squared Residuals667846915.2

\begin{tabular}{lllllllll}
\hline
Multiple Linear Regression - Regression Statistics \tabularnewline
Multiple R & 0.0813019394731372 \tabularnewline
R-squared & 0.00661000536209366 \tabularnewline
Adjusted R-squared & -0.221041868409093 \tabularnewline
F-TEST (value) & 0.0290355851352991 \tabularnewline
F-TEST (DF numerator) & 11 \tabularnewline
F-TEST (DF denominator) & 48 \tabularnewline
p-value & 0.999999801881925 \tabularnewline
Multiple Linear Regression - Residual Statistics \tabularnewline
Residual Standard Deviation & 3730.07739866078 \tabularnewline
Sum Squared Residuals & 667846915.2 \tabularnewline
\hline
\end{tabular}
%Source: https://freestatistics.org/blog/index.php?pk=146924&T=3

[TABLE]
[ROW][C]Multiple Linear Regression - Regression Statistics[/C][/ROW]
[ROW][C]Multiple R[/C][C]0.0813019394731372[/C][/ROW]
[ROW][C]R-squared[/C][C]0.00661000536209366[/C][/ROW]
[ROW][C]Adjusted R-squared[/C][C]-0.221041868409093[/C][/ROW]
[ROW][C]F-TEST (value)[/C][C]0.0290355851352991[/C][/ROW]
[ROW][C]F-TEST (DF numerator)[/C][C]11[/C][/ROW]
[ROW][C]F-TEST (DF denominator)[/C][C]48[/C][/ROW]
[ROW][C]p-value[/C][C]0.999999801881925[/C][/ROW]
[ROW][C]Multiple Linear Regression - Residual Statistics[/C][/ROW]
[ROW][C]Residual Standard Deviation[/C][C]3730.07739866078[/C][/ROW]
[ROW][C]Sum Squared Residuals[/C][C]667846915.2[/C][/ROW]
[/TABLE]
Source: https://freestatistics.org/blog/index.php?pk=146924&T=3

Globally Unique Identifier (entire table): ba.freestatistics.org/blog/index.php?pk=146924&T=3

As an alternative you can also use a QR Code:  

The GUIDs for individual cells are displayed in the table below:

Multiple Linear Regression - Regression Statistics
Multiple R0.0813019394731372
R-squared0.00661000536209366
Adjusted R-squared-0.221041868409093
F-TEST (value)0.0290355851352991
F-TEST (DF numerator)11
F-TEST (DF denominator)48
p-value0.999999801881925
Multiple Linear Regression - Residual Statistics
Residual Standard Deviation3730.07739866078
Sum Squared Residuals667846915.2


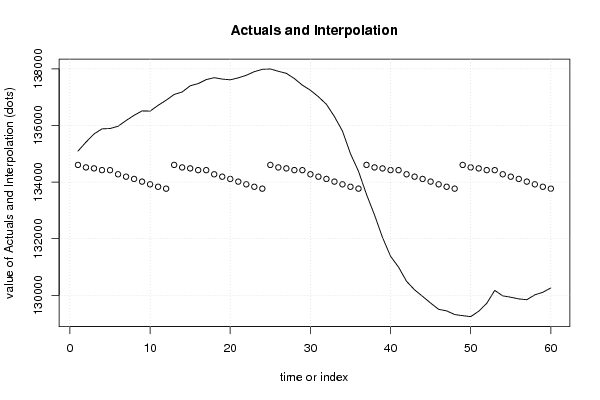
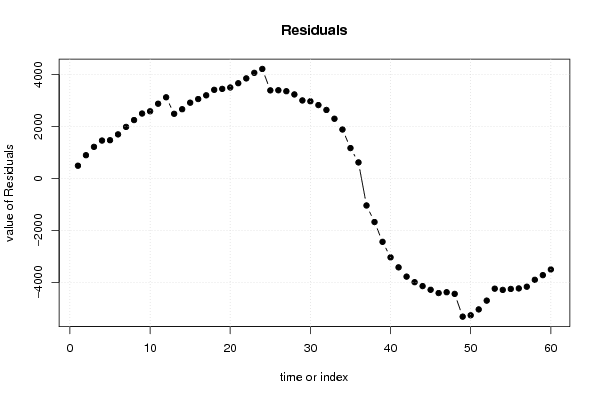
Multiple Linear Regression - Actuals, Interpolation, and Residuals
Time or IndexActualsInterpolationForecastResidualsPrediction Error
1135094134605.6488.400000000243
2135411134517.8893.200000000001
3135698134483.61214.4
4135880134422.21457.8
5135891134420.41470.6
6135971134275.41695.6
71361731341901983
8136358134110.42247.6
9136514134015.62498.4
10136506133920.42585.6
111367111338342877
12136891133767.43123.6
13137094134605.62488.39999999994
14137182134517.82664.2
15137400134483.62916.4
16137479134422.23056.8
17137620134420.43199.6
18137687134275.43411.6
191376381341903448
20137612134110.43501.6
21137681134015.63665.4
22137772133920.43851.6
231378991338344065
24137983133767.44215.6
25137996134605.63390.39999999994
26137913134517.83395.2
27137841134483.63357.4
28137656134422.23233.8
29137423134420.43002.6
30137245134275.42969.6
311370141341902824
32136747134110.42636.6
33136313134015.62297.4
34135804133920.41883.6
351350021338341168
36134383133767.4615.600000000001
37133563134605.6-1042.60000000006
38132837134517.8-1680.8
39132041134483.6-2442.6
40131381134422.2-3041.2
41130995134420.4-3425.4
42130493134275.4-3782.4
43130193134190-3997
44129962134110.4-4148.4
45129726134015.6-4289.6
46129505133920.4-4415.4
47129450133834-4384
48129320133767.4-4447.4
49129281134605.6-5324.60000000006
50129246134517.8-5271.8
51129438134483.6-5045.6
52129715134422.2-4707.2
53130173134420.4-4247.4
54129981134275.4-4294.4
55129932134190-4258
56129873134110.4-4237.4
57129844134015.6-4171.6
58130015133920.4-3905.4
59130108133834-3726
60130260133767.4-3507.4

\begin{tabular}{lllllllll}
\hline
Multiple Linear Regression - Actuals, Interpolation, and Residuals \tabularnewline
Time or Index & Actuals & InterpolationForecast & ResidualsPrediction Error \tabularnewline
1 & 135094 & 134605.6 & 488.400000000243 \tabularnewline
2 & 135411 & 134517.8 & 893.200000000001 \tabularnewline
3 & 135698 & 134483.6 & 1214.4 \tabularnewline
4 & 135880 & 134422.2 & 1457.8 \tabularnewline
5 & 135891 & 134420.4 & 1470.6 \tabularnewline
6 & 135971 & 134275.4 & 1695.6 \tabularnewline
7 & 136173 & 134190 & 1983 \tabularnewline
8 & 136358 & 134110.4 & 2247.6 \tabularnewline
9 & 136514 & 134015.6 & 2498.4 \tabularnewline
10 & 136506 & 133920.4 & 2585.6 \tabularnewline
11 & 136711 & 133834 & 2877 \tabularnewline
12 & 136891 & 133767.4 & 3123.6 \tabularnewline
13 & 137094 & 134605.6 & 2488.39999999994 \tabularnewline
14 & 137182 & 134517.8 & 2664.2 \tabularnewline
15 & 137400 & 134483.6 & 2916.4 \tabularnewline
16 & 137479 & 134422.2 & 3056.8 \tabularnewline
17 & 137620 & 134420.4 & 3199.6 \tabularnewline
18 & 137687 & 134275.4 & 3411.6 \tabularnewline
19 & 137638 & 134190 & 3448 \tabularnewline
20 & 137612 & 134110.4 & 3501.6 \tabularnewline
21 & 137681 & 134015.6 & 3665.4 \tabularnewline
22 & 137772 & 133920.4 & 3851.6 \tabularnewline
23 & 137899 & 133834 & 4065 \tabularnewline
24 & 137983 & 133767.4 & 4215.6 \tabularnewline
25 & 137996 & 134605.6 & 3390.39999999994 \tabularnewline
26 & 137913 & 134517.8 & 3395.2 \tabularnewline
27 & 137841 & 134483.6 & 3357.4 \tabularnewline
28 & 137656 & 134422.2 & 3233.8 \tabularnewline
29 & 137423 & 134420.4 & 3002.6 \tabularnewline
30 & 137245 & 134275.4 & 2969.6 \tabularnewline
31 & 137014 & 134190 & 2824 \tabularnewline
32 & 136747 & 134110.4 & 2636.6 \tabularnewline
33 & 136313 & 134015.6 & 2297.4 \tabularnewline
34 & 135804 & 133920.4 & 1883.6 \tabularnewline
35 & 135002 & 133834 & 1168 \tabularnewline
36 & 134383 & 133767.4 & 615.600000000001 \tabularnewline
37 & 133563 & 134605.6 & -1042.60000000006 \tabularnewline
38 & 132837 & 134517.8 & -1680.8 \tabularnewline
39 & 132041 & 134483.6 & -2442.6 \tabularnewline
40 & 131381 & 134422.2 & -3041.2 \tabularnewline
41 & 130995 & 134420.4 & -3425.4 \tabularnewline
42 & 130493 & 134275.4 & -3782.4 \tabularnewline
43 & 130193 & 134190 & -3997 \tabularnewline
44 & 129962 & 134110.4 & -4148.4 \tabularnewline
45 & 129726 & 134015.6 & -4289.6 \tabularnewline
46 & 129505 & 133920.4 & -4415.4 \tabularnewline
47 & 129450 & 133834 & -4384 \tabularnewline
48 & 129320 & 133767.4 & -4447.4 \tabularnewline
49 & 129281 & 134605.6 & -5324.60000000006 \tabularnewline
50 & 129246 & 134517.8 & -5271.8 \tabularnewline
51 & 129438 & 134483.6 & -5045.6 \tabularnewline
52 & 129715 & 134422.2 & -4707.2 \tabularnewline
53 & 130173 & 134420.4 & -4247.4 \tabularnewline
54 & 129981 & 134275.4 & -4294.4 \tabularnewline
55 & 129932 & 134190 & -4258 \tabularnewline
56 & 129873 & 134110.4 & -4237.4 \tabularnewline
57 & 129844 & 134015.6 & -4171.6 \tabularnewline
58 & 130015 & 133920.4 & -3905.4 \tabularnewline
59 & 130108 & 133834 & -3726 \tabularnewline
60 & 130260 & 133767.4 & -3507.4 \tabularnewline
\hline
\end{tabular}
%Source: https://freestatistics.org/blog/index.php?pk=146924&T=4

[TABLE]
[ROW][C]Multiple Linear Regression - Actuals, Interpolation, and Residuals[/C][/ROW]
[ROW][C]Time or Index[/C][C]Actuals[/C][C]InterpolationForecast[/C][C]ResidualsPrediction Error[/C][/ROW]
[ROW][C]1[/C][C]135094[/C][C]134605.6[/C][C]488.400000000243[/C][/ROW]
[ROW][C]2[/C][C]135411[/C][C]134517.8[/C][C]893.200000000001[/C][/ROW]
[ROW][C]3[/C][C]135698[/C][C]134483.6[/C][C]1214.4[/C][/ROW]
[ROW][C]4[/C][C]135880[/C][C]134422.2[/C][C]1457.8[/C][/ROW]
[ROW][C]5[/C][C]135891[/C][C]134420.4[/C][C]1470.6[/C][/ROW]
[ROW][C]6[/C][C]135971[/C][C]134275.4[/C][C]1695.6[/C][/ROW]
[ROW][C]7[/C][C]136173[/C][C]134190[/C][C]1983[/C][/ROW]
[ROW][C]8[/C][C]136358[/C][C]134110.4[/C][C]2247.6[/C][/ROW]
[ROW][C]9[/C][C]136514[/C][C]134015.6[/C][C]2498.4[/C][/ROW]
[ROW][C]10[/C][C]136506[/C][C]133920.4[/C][C]2585.6[/C][/ROW]
[ROW][C]11[/C][C]136711[/C][C]133834[/C][C]2877[/C][/ROW]
[ROW][C]12[/C][C]136891[/C][C]133767.4[/C][C]3123.6[/C][/ROW]
[ROW][C]13[/C][C]137094[/C][C]134605.6[/C][C]2488.39999999994[/C][/ROW]
[ROW][C]14[/C][C]137182[/C][C]134517.8[/C][C]2664.2[/C][/ROW]
[ROW][C]15[/C][C]137400[/C][C]134483.6[/C][C]2916.4[/C][/ROW]
[ROW][C]16[/C][C]137479[/C][C]134422.2[/C][C]3056.8[/C][/ROW]
[ROW][C]17[/C][C]137620[/C][C]134420.4[/C][C]3199.6[/C][/ROW]
[ROW][C]18[/C][C]137687[/C][C]134275.4[/C][C]3411.6[/C][/ROW]
[ROW][C]19[/C][C]137638[/C][C]134190[/C][C]3448[/C][/ROW]
[ROW][C]20[/C][C]137612[/C][C]134110.4[/C][C]3501.6[/C][/ROW]
[ROW][C]21[/C][C]137681[/C][C]134015.6[/C][C]3665.4[/C][/ROW]
[ROW][C]22[/C][C]137772[/C][C]133920.4[/C][C]3851.6[/C][/ROW]
[ROW][C]23[/C][C]137899[/C][C]133834[/C][C]4065[/C][/ROW]
[ROW][C]24[/C][C]137983[/C][C]133767.4[/C][C]4215.6[/C][/ROW]
[ROW][C]25[/C][C]137996[/C][C]134605.6[/C][C]3390.39999999994[/C][/ROW]
[ROW][C]26[/C][C]137913[/C][C]134517.8[/C][C]3395.2[/C][/ROW]
[ROW][C]27[/C][C]137841[/C][C]134483.6[/C][C]3357.4[/C][/ROW]
[ROW][C]28[/C][C]137656[/C][C]134422.2[/C][C]3233.8[/C][/ROW]
[ROW][C]29[/C][C]137423[/C][C]134420.4[/C][C]3002.6[/C][/ROW]
[ROW][C]30[/C][C]137245[/C][C]134275.4[/C][C]2969.6[/C][/ROW]
[ROW][C]31[/C][C]137014[/C][C]134190[/C][C]2824[/C][/ROW]
[ROW][C]32[/C][C]136747[/C][C]134110.4[/C][C]2636.6[/C][/ROW]
[ROW][C]33[/C][C]136313[/C][C]134015.6[/C][C]2297.4[/C][/ROW]
[ROW][C]34[/C][C]135804[/C][C]133920.4[/C][C]1883.6[/C][/ROW]
[ROW][C]35[/C][C]135002[/C][C]133834[/C][C]1168[/C][/ROW]
[ROW][C]36[/C][C]134383[/C][C]133767.4[/C][C]615.600000000001[/C][/ROW]
[ROW][C]37[/C][C]133563[/C][C]134605.6[/C][C]-1042.60000000006[/C][/ROW]
[ROW][C]38[/C][C]132837[/C][C]134517.8[/C][C]-1680.8[/C][/ROW]
[ROW][C]39[/C][C]132041[/C][C]134483.6[/C][C]-2442.6[/C][/ROW]
[ROW][C]40[/C][C]131381[/C][C]134422.2[/C][C]-3041.2[/C][/ROW]
[ROW][C]41[/C][C]130995[/C][C]134420.4[/C][C]-3425.4[/C][/ROW]
[ROW][C]42[/C][C]130493[/C][C]134275.4[/C][C]-3782.4[/C][/ROW]
[ROW][C]43[/C][C]130193[/C][C]134190[/C][C]-3997[/C][/ROW]
[ROW][C]44[/C][C]129962[/C][C]134110.4[/C][C]-4148.4[/C][/ROW]
[ROW][C]45[/C][C]129726[/C][C]134015.6[/C][C]-4289.6[/C][/ROW]
[ROW][C]46[/C][C]129505[/C][C]133920.4[/C][C]-4415.4[/C][/ROW]
[ROW][C]47[/C][C]129450[/C][C]133834[/C][C]-4384[/C][/ROW]
[ROW][C]48[/C][C]129320[/C][C]133767.4[/C][C]-4447.4[/C][/ROW]
[ROW][C]49[/C][C]129281[/C][C]134605.6[/C][C]-5324.60000000006[/C][/ROW]
[ROW][C]50[/C][C]129246[/C][C]134517.8[/C][C]-5271.8[/C][/ROW]
[ROW][C]51[/C][C]129438[/C][C]134483.6[/C][C]-5045.6[/C][/ROW]
[ROW][C]52[/C][C]129715[/C][C]134422.2[/C][C]-4707.2[/C][/ROW]
[ROW][C]53[/C][C]130173[/C][C]134420.4[/C][C]-4247.4[/C][/ROW]
[ROW][C]54[/C][C]129981[/C][C]134275.4[/C][C]-4294.4[/C][/ROW]
[ROW][C]55[/C][C]129932[/C][C]134190[/C][C]-4258[/C][/ROW]
[ROW][C]56[/C][C]129873[/C][C]134110.4[/C][C]-4237.4[/C][/ROW]
[ROW][C]57[/C][C]129844[/C][C]134015.6[/C][C]-4171.6[/C][/ROW]
[ROW][C]58[/C][C]130015[/C][C]133920.4[/C][C]-3905.4[/C][/ROW]
[ROW][C]59[/C][C]130108[/C][C]133834[/C][C]-3726[/C][/ROW]
[ROW][C]60[/C][C]130260[/C][C]133767.4[/C][C]-3507.4[/C][/ROW]
[/TABLE]
Source: https://freestatistics.org/blog/index.php?pk=146924&T=4

Globally Unique Identifier (entire table): ba.freestatistics.org/blog/index.php?pk=146924&T=4

As an alternative you can also use a QR Code:  

The GUIDs for individual cells are displayed in the table below:

Multiple Linear Regression - Actuals, Interpolation, and Residuals
Time or IndexActualsInterpolationForecastResidualsPrediction Error
1135094134605.6488.400000000243
2135411134517.8893.200000000001
3135698134483.61214.4
4135880134422.21457.8
5135891134420.41470.6
6135971134275.41695.6
71361731341901983
8136358134110.42247.6
9136514134015.62498.4
10136506133920.42585.6
111367111338342877
12136891133767.43123.6
13137094134605.62488.39999999994
14137182134517.82664.2
15137400134483.62916.4
16137479134422.23056.8
17137620134420.43199.6
18137687134275.43411.6
191376381341903448
20137612134110.43501.6
21137681134015.63665.4
22137772133920.43851.6
231378991338344065
24137983133767.44215.6
25137996134605.63390.39999999994
26137913134517.83395.2
27137841134483.63357.4
28137656134422.23233.8
29137423134420.43002.6
30137245134275.42969.6
311370141341902824
32136747134110.42636.6
33136313134015.62297.4
34135804133920.41883.6
351350021338341168
36134383133767.4615.600000000001
37133563134605.6-1042.60000000006
38132837134517.8-1680.8
39132041134483.6-2442.6
40131381134422.2-3041.2
41130995134420.4-3425.4
42130493134275.4-3782.4
43130193134190-3997
44129962134110.4-4148.4
45129726134015.6-4289.6
46129505133920.4-4415.4
47129450133834-4384
48129320133767.4-4447.4
49129281134605.6-5324.60000000006
50129246134517.8-5271.8
51129438134483.6-5045.6
52129715134422.2-4707.2
53130173134420.4-4247.4
54129981134275.4-4294.4
55129932134190-4258
56129873134110.4-4237.4
57129844134015.6-4171.6
58130015133920.4-3905.4
59130108133834-3726
60130260133767.4-3507.4


Goldfeld-Quandt test for Heteroskedasticity
p-valuesAlternative Hypothesis
breakpoint indexgreater2-sidedless
150.03858056247638350.0771611249527670.961419437523616
160.01523533328310880.03047066656621760.984764666716891
170.006675658940066640.01335131788013330.993324341059933
180.003038588156172520.006077176312345050.996961411843827
190.001273946649056320.002547893298112650.998726053350944
200.0005061010891847080.001012202178369420.999493898910815
210.0002039236091821410.0004078472183642830.999796076390818
229.14029122269749e-050.000182805824453950.999908597087773
234.3640236000585e-058.728047200117e-050.999956359763999
242.24346524770755e-054.48693049541509e-050.999977565347523
252.33923087397346e-054.67846174794692e-050.99997660769126
262.17182092864902e-054.34364185729805e-050.999978281790713
271.94075850044482e-053.88151700088963e-050.999980592414996
281.75925091905906e-053.51850183811813e-050.999982407490809
291.61494349028508e-053.22988698057015e-050.999983850565097
301.88928963067336e-053.77857926134672e-050.999981107103693
312.94395348604482e-055.88790697208965e-050.99997056046514
327.0006991335387e-050.0001400139826707740.999929993008665
330.0002944086934703740.0005888173869407470.99970559130653
340.002285549949600760.004571099899201520.997714450050399
350.02700964745428420.05401929490856840.972990352545716
360.2452454484546410.4904908969092830.754754551545359
370.7027852533752830.5944294932494350.297214746624717
380.9719215353191730.05615692936165470.0280784646808273
390.9989885489333660.002022902133268140.00101145106663407
400.9999254780810120.0001490438379768637.45219189884314e-05
410.9999448752823370.0001102494353259455.51247176629727e-05
420.9998947466853720.0002105066292552250.000105253314627613
430.9996318052165550.0007363895668905580.000368194783445279
440.9983239908700710.003352018259858110.00167600912992905
450.9916526828072280.01669463438554340.0083473171927717

\begin{tabular}{lllllllll}
\hline
Goldfeld-Quandt test for Heteroskedasticity \tabularnewline
p-values & Alternative Hypothesis \tabularnewline
breakpoint index & greater & 2-sided & less \tabularnewline
15 & 0.0385805624763835 & 0.077161124952767 & 0.961419437523616 \tabularnewline
16 & 0.0152353332831088 & 0.0304706665662176 & 0.984764666716891 \tabularnewline
17 & 0.00667565894006664 & 0.0133513178801333 & 0.993324341059933 \tabularnewline
18 & 0.00303858815617252 & 0.00607717631234505 & 0.996961411843827 \tabularnewline
19 & 0.00127394664905632 & 0.00254789329811265 & 0.998726053350944 \tabularnewline
20 & 0.000506101089184708 & 0.00101220217836942 & 0.999493898910815 \tabularnewline
21 & 0.000203923609182141 & 0.000407847218364283 & 0.999796076390818 \tabularnewline
22 & 9.14029122269749e-05 & 0.00018280582445395 & 0.999908597087773 \tabularnewline
23 & 4.3640236000585e-05 & 8.728047200117e-05 & 0.999956359763999 \tabularnewline
24 & 2.24346524770755e-05 & 4.48693049541509e-05 & 0.999977565347523 \tabularnewline
25 & 2.33923087397346e-05 & 4.67846174794692e-05 & 0.99997660769126 \tabularnewline
26 & 2.17182092864902e-05 & 4.34364185729805e-05 & 0.999978281790713 \tabularnewline
27 & 1.94075850044482e-05 & 3.88151700088963e-05 & 0.999980592414996 \tabularnewline
28 & 1.75925091905906e-05 & 3.51850183811813e-05 & 0.999982407490809 \tabularnewline
29 & 1.61494349028508e-05 & 3.22988698057015e-05 & 0.999983850565097 \tabularnewline
30 & 1.88928963067336e-05 & 3.77857926134672e-05 & 0.999981107103693 \tabularnewline
31 & 2.94395348604482e-05 & 5.88790697208965e-05 & 0.99997056046514 \tabularnewline
32 & 7.0006991335387e-05 & 0.000140013982670774 & 0.999929993008665 \tabularnewline
33 & 0.000294408693470374 & 0.000588817386940747 & 0.99970559130653 \tabularnewline
34 & 0.00228554994960076 & 0.00457109989920152 & 0.997714450050399 \tabularnewline
35 & 0.0270096474542842 & 0.0540192949085684 & 0.972990352545716 \tabularnewline
36 & 0.245245448454641 & 0.490490896909283 & 0.754754551545359 \tabularnewline
37 & 0.702785253375283 & 0.594429493249435 & 0.297214746624717 \tabularnewline
38 & 0.971921535319173 & 0.0561569293616547 & 0.0280784646808273 \tabularnewline
39 & 0.998988548933366 & 0.00202290213326814 & 0.00101145106663407 \tabularnewline
40 & 0.999925478081012 & 0.000149043837976863 & 7.45219189884314e-05 \tabularnewline
41 & 0.999944875282337 & 0.000110249435325945 & 5.51247176629727e-05 \tabularnewline
42 & 0.999894746685372 & 0.000210506629255225 & 0.000105253314627613 \tabularnewline
43 & 0.999631805216555 & 0.000736389566890558 & 0.000368194783445279 \tabularnewline
44 & 0.998323990870071 & 0.00335201825985811 & 0.00167600912992905 \tabularnewline
45 & 0.991652682807228 & 0.0166946343855434 & 0.0083473171927717 \tabularnewline
\hline
\end{tabular}
%Source: https://freestatistics.org/blog/index.php?pk=146924&T=5

[TABLE]
[ROW][C]Goldfeld-Quandt test for Heteroskedasticity[/C][/ROW]
[ROW][C]p-values[/C][C]Alternative Hypothesis[/C][/ROW]
[ROW][C]breakpoint index[/C][C]greater[/C][C]2-sided[/C][C]less[/C][/ROW]
[ROW][C]15[/C][C]0.0385805624763835[/C][C]0.077161124952767[/C][C]0.961419437523616[/C][/ROW]
[ROW][C]16[/C][C]0.0152353332831088[/C][C]0.0304706665662176[/C][C]0.984764666716891[/C][/ROW]
[ROW][C]17[/C][C]0.00667565894006664[/C][C]0.0133513178801333[/C][C]0.993324341059933[/C][/ROW]
[ROW][C]18[/C][C]0.00303858815617252[/C][C]0.00607717631234505[/C][C]0.996961411843827[/C][/ROW]
[ROW][C]19[/C][C]0.00127394664905632[/C][C]0.00254789329811265[/C][C]0.998726053350944[/C][/ROW]
[ROW][C]20[/C][C]0.000506101089184708[/C][C]0.00101220217836942[/C][C]0.999493898910815[/C][/ROW]
[ROW][C]21[/C][C]0.000203923609182141[/C][C]0.000407847218364283[/C][C]0.999796076390818[/C][/ROW]
[ROW][C]22[/C][C]9.14029122269749e-05[/C][C]0.00018280582445395[/C][C]0.999908597087773[/C][/ROW]
[ROW][C]23[/C][C]4.3640236000585e-05[/C][C]8.728047200117e-05[/C][C]0.999956359763999[/C][/ROW]
[ROW][C]24[/C][C]2.24346524770755e-05[/C][C]4.48693049541509e-05[/C][C]0.999977565347523[/C][/ROW]
[ROW][C]25[/C][C]2.33923087397346e-05[/C][C]4.67846174794692e-05[/C][C]0.99997660769126[/C][/ROW]
[ROW][C]26[/C][C]2.17182092864902e-05[/C][C]4.34364185729805e-05[/C][C]0.999978281790713[/C][/ROW]
[ROW][C]27[/C][C]1.94075850044482e-05[/C][C]3.88151700088963e-05[/C][C]0.999980592414996[/C][/ROW]
[ROW][C]28[/C][C]1.75925091905906e-05[/C][C]3.51850183811813e-05[/C][C]0.999982407490809[/C][/ROW]
[ROW][C]29[/C][C]1.61494349028508e-05[/C][C]3.22988698057015e-05[/C][C]0.999983850565097[/C][/ROW]
[ROW][C]30[/C][C]1.88928963067336e-05[/C][C]3.77857926134672e-05[/C][C]0.999981107103693[/C][/ROW]
[ROW][C]31[/C][C]2.94395348604482e-05[/C][C]5.88790697208965e-05[/C][C]0.99997056046514[/C][/ROW]
[ROW][C]32[/C][C]7.0006991335387e-05[/C][C]0.000140013982670774[/C][C]0.999929993008665[/C][/ROW]
[ROW][C]33[/C][C]0.000294408693470374[/C][C]0.000588817386940747[/C][C]0.99970559130653[/C][/ROW]
[ROW][C]34[/C][C]0.00228554994960076[/C][C]0.00457109989920152[/C][C]0.997714450050399[/C][/ROW]
[ROW][C]35[/C][C]0.0270096474542842[/C][C]0.0540192949085684[/C][C]0.972990352545716[/C][/ROW]
[ROW][C]36[/C][C]0.245245448454641[/C][C]0.490490896909283[/C][C]0.754754551545359[/C][/ROW]
[ROW][C]37[/C][C]0.702785253375283[/C][C]0.594429493249435[/C][C]0.297214746624717[/C][/ROW]
[ROW][C]38[/C][C]0.971921535319173[/C][C]0.0561569293616547[/C][C]0.0280784646808273[/C][/ROW]
[ROW][C]39[/C][C]0.998988548933366[/C][C]0.00202290213326814[/C][C]0.00101145106663407[/C][/ROW]
[ROW][C]40[/C][C]0.999925478081012[/C][C]0.000149043837976863[/C][C]7.45219189884314e-05[/C][/ROW]
[ROW][C]41[/C][C]0.999944875282337[/C][C]0.000110249435325945[/C][C]5.51247176629727e-05[/C][/ROW]
[ROW][C]42[/C][C]0.999894746685372[/C][C]0.000210506629255225[/C][C]0.000105253314627613[/C][/ROW]
[ROW][C]43[/C][C]0.999631805216555[/C][C]0.000736389566890558[/C][C]0.000368194783445279[/C][/ROW]
[ROW][C]44[/C][C]0.998323990870071[/C][C]0.00335201825985811[/C][C]0.00167600912992905[/C][/ROW]
[ROW][C]45[/C][C]0.991652682807228[/C][C]0.0166946343855434[/C][C]0.0083473171927717[/C][/ROW]
[/TABLE]
Source: https://freestatistics.org/blog/index.php?pk=146924&T=5

Globally Unique Identifier (entire table): ba.freestatistics.org/blog/index.php?pk=146924&T=5

As an alternative you can also use a QR Code:  

The GUIDs for individual cells are displayed in the table below:

Goldfeld-Quandt test for Heteroskedasticity
p-valuesAlternative Hypothesis
breakpoint indexgreater2-sidedless
150.03858056247638350.0771611249527670.961419437523616
160.01523533328310880.03047066656621760.984764666716891
170.006675658940066640.01335131788013330.993324341059933
180.003038588156172520.006077176312345050.996961411843827
190.001273946649056320.002547893298112650.998726053350944
200.0005061010891847080.001012202178369420.999493898910815
210.0002039236091821410.0004078472183642830.999796076390818
229.14029122269749e-050.000182805824453950.999908597087773
234.3640236000585e-058.728047200117e-050.999956359763999
242.24346524770755e-054.48693049541509e-050.999977565347523
252.33923087397346e-054.67846174794692e-050.99997660769126
262.17182092864902e-054.34364185729805e-050.999978281790713
271.94075850044482e-053.88151700088963e-050.999980592414996
281.75925091905906e-053.51850183811813e-050.999982407490809
291.61494349028508e-053.22988698057015e-050.999983850565097
301.88928963067336e-053.77857926134672e-050.999981107103693
312.94395348604482e-055.88790697208965e-050.99997056046514
327.0006991335387e-050.0001400139826707740.999929993008665
330.0002944086934703740.0005888173869407470.99970559130653
340.002285549949600760.004571099899201520.997714450050399
350.02700964745428420.05401929490856840.972990352545716
360.2452454484546410.4904908969092830.754754551545359
370.7027852533752830.5944294932494350.297214746624717
380.9719215353191730.05615692936165470.0280784646808273
390.9989885489333660.002022902133268140.00101145106663407
400.9999254780810120.0001490438379768637.45219189884314e-05
410.9999448752823370.0001102494353259455.51247176629727e-05
420.9998947466853720.0002105066292552250.000105253314627613
430.9996318052165550.0007363895668905580.000368194783445279
440.9983239908700710.003352018259858110.00167600912992905
450.9916526828072280.01669463438554340.0083473171927717


Meta Analysis of Goldfeld-Quandt test for Heteroskedasticity
Description# significant tests% significant testsOK/NOK
1% type I error level230.741935483870968NOK
5% type I error level260.838709677419355NOK
10% type I error level290.935483870967742NOK

\begin{tabular}{lllllllll}
\hline
Meta Analysis of Goldfeld-Quandt test for Heteroskedasticity \tabularnewline
Description & # significant tests & % significant tests & OK/NOK \tabularnewline
1% type I error level & 23 & 0.741935483870968 & NOK \tabularnewline
5% type I error level & 26 & 0.838709677419355 & NOK \tabularnewline
10% type I error level & 29 & 0.935483870967742 & NOK \tabularnewline
\hline
\end{tabular}
%Source: https://freestatistics.org/blog/index.php?pk=146924&T=6

[TABLE]
[ROW][C]Meta Analysis of Goldfeld-Quandt test for Heteroskedasticity[/C][/ROW]
[ROW][C]Description[/C][C]# significant tests[/C][C]% significant tests[/C][C]OK/NOK[/C][/ROW]
[ROW][C]1% type I error level[/C][C]23[/C][C]0.741935483870968[/C][C]NOK[/C][/ROW]
[ROW][C]5% type I error level[/C][C]26[/C][C]0.838709677419355[/C][C]NOK[/C][/ROW]
[ROW][C]10% type I error level[/C][C]29[/C][C]0.935483870967742[/C][C]NOK[/C][/ROW]
[/TABLE]
Source: https://freestatistics.org/blog/index.php?pk=146924&T=6

Globally Unique Identifier (entire table): ba.freestatistics.org/blog/index.php?pk=146924&T=6

As an alternative you can also use a QR Code:  

The GUIDs for individual cells are displayed in the table below:

Meta Analysis of Goldfeld-Quandt test for Heteroskedasticity
Description# significant tests% significant testsOK/NOK
1% type I error level230.741935483870968NOK
5% type I error level260.838709677419355NOK
10% type I error level290.935483870967742NOK


Parameters (Session):
par1 = 1 ; par2 = Include Monthly Dummies ; par3 = No Linear Trend ;
Parameters (R input):
par1 = 1 ; par2 = Include Monthly Dummies ; par3 = No Linear Trend ;
R code (references can be found in the software module):
library(lattice)
library(lmtest)
n25 <- 25 #minimum number of obs. for Goldfeld-Quandt test
par1 <- as.numeric(par1)
x <- t(y)
k <- length(x[1,])
n <- length(x[,1])
x1 <- cbind(x[,par1], x[,1:k!=par1])
mycolnames <- c(colnames(x)[par1], colnames(x)[1:k!=par1])
colnames(x1) <- mycolnames #colnames(x)[par1]
x <- x1
if (par3 == 'First Differences'){
x2 <- array(0, dim=c(n-1,k), dimnames=list(1:(n-1), paste('(1-B)',colnames(x),sep='')))
for (i in 1:n-1) {
for (j in 1:k) {
x2[i,j] <- x[i+1,j] - x[i,j]
}
}
x <- x2
}
if (par2 == 'Include Monthly Dummies'){
x2 <- array(0, dim=c(n,11), dimnames=list(1:n, paste('M', seq(1:11), sep ='')))
for (i in 1:11){
x2[seq(i,n,12),i] <- 1
}
x <- cbind(x, x2)
}
if (par2 == 'Include Quarterly Dummies'){
x2 <- array(0, dim=c(n,3), dimnames=list(1:n, paste('Q', seq(1:3), sep ='')))
for (i in 1:3){
x2[seq(i,n,4),i] <- 1
}
x <- cbind(x, x2)
}
k <- length(x[1,])
if (par3 == 'Linear Trend'){
x <- cbind(x, c(1:n))
colnames(x)[k+1] <- 't'
}
x
k <- length(x[1,])
df <- as.data.frame(x)
(mylm <- lm(df))
(mysum <- summary(mylm))
if (n > n25) {
kp3 <- k + 3
nmkm3 <- n - k - 3
gqarr <- array(NA, dim=c(nmkm3-kp3+1,3))
numgqtests <- 0
numsignificant1 <- 0
numsignificant5 <- 0
numsignificant10 <- 0
for (mypoint in kp3:nmkm3) {
j <- 0
numgqtests <- numgqtests + 1
for (myalt in c('greater', 'two.sided', 'less')) {
j <- j + 1
gqarr[mypoint-kp3+1,j] <- gqtest(mylm, point=mypoint, alternative=myalt)$p.value
}
if (gqarr[mypoint-kp3+1,2] < 0.01) numsignificant1 <- numsignificant1 + 1
if (gqarr[mypoint-kp3+1,2] < 0.05) numsignificant5 <- numsignificant5 + 1
if (gqarr[mypoint-kp3+1,2] < 0.10) numsignificant10 <- numsignificant10 + 1
}
gqarr
}
bitmap(file='test0.png')
plot(x[,1], type='l', main='Actuals and Interpolation', ylab='value of Actuals and Interpolation (dots)', xlab='time or index')
points(x[,1]-mysum$resid)
grid()
dev.off()
bitmap(file='test1.png')
plot(mysum$resid, type='b', pch=19, main='Residuals', ylab='value of Residuals', xlab='time or index')
grid()
dev.off()
bitmap(file='test2.png')
hist(mysum$resid, main='Residual Histogram', xlab='values of Residuals')
grid()
dev.off()
bitmap(file='test3.png')
densityplot(~mysum$resid,col='black',main='Residual Density Plot', xlab='values of Residuals')
dev.off()
bitmap(file='test4.png')
qqnorm(mysum$resid, main='Residual Normal Q-Q Plot')
qqline(mysum$resid)
grid()
dev.off()
(myerror <- as.ts(mysum$resid))
bitmap(file='test5.png')
dum <- cbind(lag(myerror,k=1),myerror)
dum
dum1 <- dum[2:length(myerror),]
dum1
z <- as.data.frame(dum1)
z
plot(z,main=paste('Residual Lag plot, lowess, and regression line'), ylab='values of Residuals', xlab='lagged values of Residuals')
lines(lowess(z))
abline(lm(z))
grid()
dev.off()
bitmap(file='test6.png')
acf(mysum$resid, lag.max=length(mysum$resid)/2, main='Residual Autocorrelation Function')
grid()
dev.off()
bitmap(file='test7.png')
pacf(mysum$resid, lag.max=length(mysum$resid)/2, main='Residual Partial Autocorrelation Function')
grid()
dev.off()
bitmap(file='test8.png')
opar <- par(mfrow = c(2,2), oma = c(0, 0, 1.1, 0))
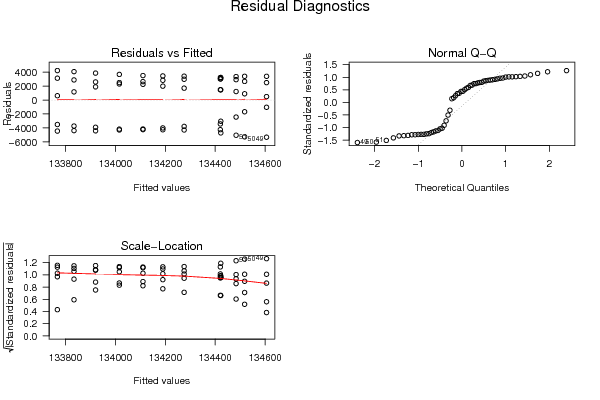
plot(mylm, las = 1, sub='Residual Diagnostics')
par(opar)
dev.off()
if (n > n25) {
bitmap(file='test9.png')
plot(kp3:nmkm3,gqarr[,2], main='Goldfeld-Quandt test',ylab='2-sided p-value',xlab='breakpoint')
grid()
dev.off()
}
load(file='createtable')
a<-table.start()
a<-table.row.start(a)
a<-table.element(a, 'Multiple Linear Regression - Estimated Regression Equation', 1, TRUE)
a<-table.row.end(a)
myeq <- colnames(x)[1]
myeq <- paste(myeq, '[t] = ', sep='')
for (i in 1:k){
if (mysum$coefficients[i,1] > 0) myeq <- paste(myeq, '+', '')
myeq <- paste(myeq, mysum$coefficients[i,1], sep=' ')
if (rownames(mysum$coefficients)[i] != '(Intercept)') {
myeq <- paste(myeq, rownames(mysum$coefficients)[i], sep='')
if (rownames(mysum$coefficients)[i] != 't') myeq <- paste(myeq, '[t]', sep='')
}
}
myeq <- paste(myeq, ' + e[t]')
a<-table.row.start(a)
a<-table.element(a, myeq)
a<-table.row.end(a)
a<-table.end(a)
table.save(a,file='mytable1.tab')
a<-table.start()
a<-table.row.start(a)
a<-table.element(a,hyperlink('ols1.htm','Multiple Linear Regression - Ordinary Least Squares',''), 6, TRUE)
a<-table.row.end(a)
a<-table.row.start(a)
a<-table.element(a,'Variable',header=TRUE)
a<-table.element(a,'Parameter',header=TRUE)
a<-table.element(a,'S.D.',header=TRUE)
a<-table.element(a,'T-STAT
H0: parameter = 0',header=TRUE)
a<-table.element(a,'2-tail p-value',header=TRUE)
a<-table.element(a,'1-tail p-value',header=TRUE)
a<-table.row.end(a)
for (i in 1:k){
a<-table.row.start(a)
a<-table.element(a,rownames(mysum$coefficients)[i],header=TRUE)
a<-table.element(a,mysum$coefficients[i,1])
a<-table.element(a, round(mysum$coefficients[i,2],6))
a<-table.element(a, round(mysum$coefficients[i,3],4))
a<-table.element(a, round(mysum$coefficients[i,4],6))
a<-table.element(a, round(mysum$coefficients[i,4]/2,6))
a<-table.row.end(a)
}
a<-table.end(a)
table.save(a,file='mytable2.tab')
a<-table.start()
a<-table.row.start(a)
a<-table.element(a, 'Multiple Linear Regression - Regression Statistics', 2, TRUE)
a<-table.row.end(a)
a<-table.row.start(a)
a<-table.element(a, 'Multiple R',1,TRUE)
a<-table.element(a, sqrt(mysum$r.squared))
a<-table.row.end(a)
a<-table.row.start(a)
a<-table.element(a, 'R-squared',1,TRUE)
a<-table.element(a, mysum$r.squared)
a<-table.row.end(a)
a<-table.row.start(a)
a<-table.element(a, 'Adjusted R-squared',1,TRUE)
a<-table.element(a, mysum$adj.r.squared)
a<-table.row.end(a)
a<-table.row.start(a)
a<-table.element(a, 'F-TEST (value)',1,TRUE)
a<-table.element(a, mysum$fstatistic[1])
a<-table.row.end(a)
a<-table.row.start(a)
a<-table.element(a, 'F-TEST (DF numerator)',1,TRUE)
a<-table.element(a, mysum$fstatistic[2])
a<-table.row.end(a)
a<-table.row.start(a)
a<-table.element(a, 'F-TEST (DF denominator)',1,TRUE)
a<-table.element(a, mysum$fstatistic[3])
a<-table.row.end(a)
a<-table.row.start(a)
a<-table.element(a, 'p-value',1,TRUE)
a<-table.element(a, 1-pf(mysum$fstatistic[1],mysum$fstatistic[2],mysum$fstatistic[3]))
a<-table.row.end(a)
a<-table.row.start(a)
a<-table.element(a, 'Multiple Linear Regression - Residual Statistics', 2, TRUE)
a<-table.row.end(a)
a<-table.row.start(a)
a<-table.element(a, 'Residual Standard Deviation',1,TRUE)
a<-table.element(a, mysum$sigma)
a<-table.row.end(a)
a<-table.row.start(a)
a<-table.element(a, 'Sum Squared Residuals',1,TRUE)
a<-table.element(a, sum(myerror*myerror))
a<-table.row.end(a)
a<-table.end(a)
table.save(a,file='mytable3.tab')
a<-table.start()
a<-table.row.start(a)
a<-table.element(a, 'Multiple Linear Regression - Actuals, Interpolation, and Residuals', 4, TRUE)
a<-table.row.end(a)
a<-table.row.start(a)
a<-table.element(a, 'Time or Index', 1, TRUE)
a<-table.element(a, 'Actuals', 1, TRUE)
a<-table.element(a, 'Interpolation
Forecast', 1, TRUE)
a<-table.element(a, 'Residuals
Prediction Error', 1, TRUE)
a<-table.row.end(a)
for (i in 1:n) {
a<-table.row.start(a)
a<-table.element(a,i, 1, TRUE)
a<-table.element(a,x[i])
a<-table.element(a,x[i]-mysum$resid[i])
a<-table.element(a,mysum$resid[i])
a<-table.row.end(a)
}
a<-table.end(a)
table.save(a,file='mytable4.tab')
if (n > n25) {
a<-table.start()
a<-table.row.start(a)
a<-table.element(a,'Goldfeld-Quandt test for Heteroskedasticity',4,TRUE)
a<-table.row.end(a)
a<-table.row.start(a)
a<-table.element(a,'p-values',header=TRUE)
a<-table.element(a,'Alternative Hypothesis',3,header=TRUE)
a<-table.row.end(a)
a<-table.row.start(a)
a<-table.element(a,'breakpoint index',header=TRUE)
a<-table.element(a,'greater',header=TRUE)
a<-table.element(a,'2-sided',header=TRUE)
a<-table.element(a,'less',header=TRUE)
a<-table.row.end(a)
for (mypoint in kp3:nmkm3) {
a<-table.row.start(a)
a<-table.element(a,mypoint,header=TRUE)
a<-table.element(a,gqarr[mypoint-kp3+1,1])
a<-table.element(a,gqarr[mypoint-kp3+1,2])
a<-table.element(a,gqarr[mypoint-kp3+1,3])
a<-table.row.end(a)
}
a<-table.end(a)
table.save(a,file='mytable5.tab')
a<-table.start()
a<-table.row.start(a)
a<-table.element(a,'Meta Analysis of Goldfeld-Quandt test for Heteroskedasticity',4,TRUE)
a<-table.row.end(a)
a<-table.row.start(a)
a<-table.element(a,'Description',header=TRUE)
a<-table.element(a,'# significant tests',header=TRUE)
a<-table.element(a,'% significant tests',header=TRUE)
a<-table.element(a,'OK/NOK',header=TRUE)
a<-table.row.end(a)
a<-table.row.start(a)
a<-table.element(a,'1% type I error level',header=TRUE)
a<-table.element(a,numsignificant1)
a<-table.element(a,numsignificant1/numgqtests)
if (numsignificant1/numgqtests < 0.01) dum <- 'OK' else dum <- 'NOK'
a<-table.element(a,dum)
a<-table.row.end(a)
a<-table.row.start(a)
a<-table.element(a,'5% type I error level',header=TRUE)
a<-table.element(a,numsignificant5)
a<-table.element(a,numsignificant5/numgqtests)
if (numsignificant5/numgqtests < 0.05) dum <- 'OK' else dum <- 'NOK'
a<-table.element(a,dum)
a<-table.row.end(a)
a<-table.row.start(a)
a<-table.element(a,'10% type I error level',header=TRUE)
a<-table.element(a,numsignificant10)
a<-table.element(a,numsignificant10/numgqtests)
if (numsignificant10/numgqtests < 0.1) dum <- 'OK' else dum <- 'NOK'
a<-table.element(a,dum)
a<-table.row.end(a)
a<-table.end(a)
table.save(a,file='mytable6.tab')
}