| Multiple Linear Regression - Estimated Regression Equation |
| Y_t[t] = -89.6891180238859 + 3.59651887486461X_1t[t] + 2.37021038110237X_2t[t] + 5.44135963369232X_3t[t] + 0.00591219333900918X_4t[t] + e[t] |
| Multiple Linear Regression - Ordinary Least Squares | |||||
| Variable | Parameter | S.D. | T-STAT H0: parameter = 0 | 2-tail p-value | 1-tail p-value |
| (Intercept) | -89.6891180238859 | 52.953339 | -1.6937 | 0.095871 | 0.047935 |
| X_1t | 3.59651887486461 | 1.323199 | 2.718 | 0.008724 | 0.004362 |
| X_2t | 2.37021038110237 | 0.181401 | 13.0662 | 0 | 0 |
| X_3t | 5.44135963369232 | 4.379563 | 1.2424 | 0.219251 | 0.109625 |
| X_4t | 0.00591219333900918 | 0.00158 | 3.7424 | 0.000431 | 0.000216 |
| Multiple Linear Regression - Regression Statistics | |
| Multiple R | 0.968690949788983 |
| R-squared | 0.938362156203082 |
| Adjusted R-squared | 0.933959453074731 |
| F-TEST (value) | 213.133188599632 |
| F-TEST (DF numerator) | 4 |
| F-TEST (DF denominator) | 56 |
| p-value | 0 |
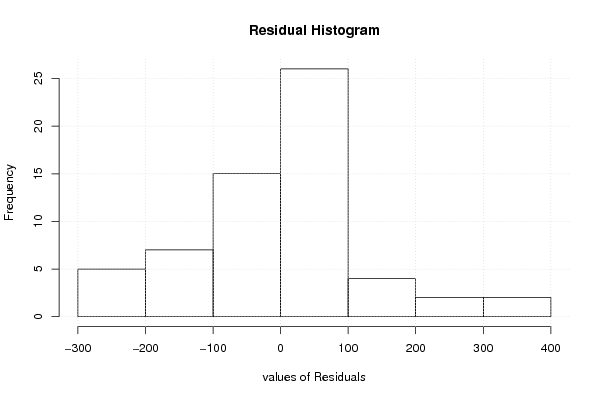
| Multiple Linear Regression - Residual Statistics | |
| Residual Standard Deviation | 134.133896924977 |
| Sum Squared Residuals | 1007546.5290397 |
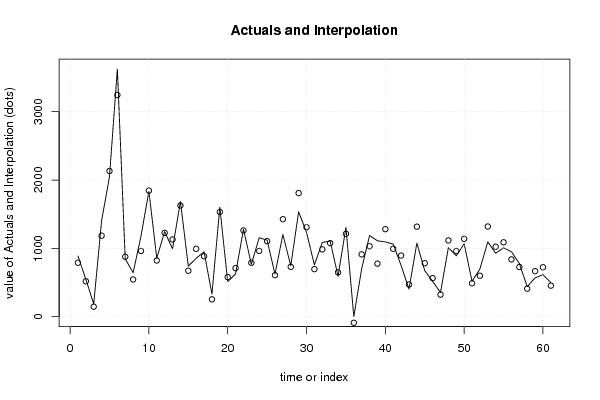
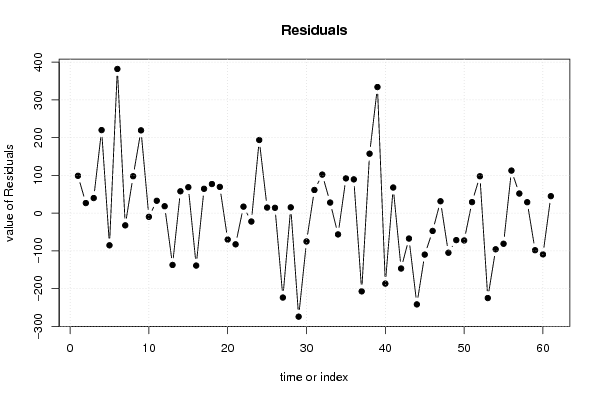
| Multiple Linear Regression - Actuals, Interpolation, and Residuals | |||
| Time or Index | Actuals | Interpolation Forecast | Residuals Prediction Error |
| 1 | 888 | 788.875640416927 | 99.124359583073 |
| 2 | 545 | 518.046501505024 | 26.9534984949757 |
| 3 | 186 | 145.779480647388 | 40.2205193526118 |
| 4 | 1405 | 1184.79265696547 | 220.207343034528 |
| 5 | 2047 | 2131.96651072686 | -84.9665107268596 |
| 6 | 3626 | 3243.79944512835 | 382.200554871646 |
| 7 | 845 | 877.113145846706 | -32.1131458467056 |
| 8 | 643 | 544.969620605881 | 98.0303793941189 |
| 9 | 1181 | 961.490603330726 | 219.509396669274 |
| 10 | 1835 | 1844.56116758303 | -9.5611675830259 |
| 11 | 855 | 822.011226727578 | 32.9887732724223 |
| 12 | 1245 | 1226.45916282845 | 18.5408371715509 |
| 13 | 993 | 1130.01780490089 | -137.017804900889 |
| 14 | 1685 | 1626.88869644056 | 58.1113035594365 |
| 15 | 741 | 672.146916506183 | 68.8530834938174 |
| 16 | 854 | 992.657346133017 | -138.657346133017 |
| 17 | 949 | 884.28751017935 | 64.7124898206505 |
| 18 | 331 | 253.635711659729 | 77.3642883402714 |
| 19 | 1602 | 1532.28716775269 | 69.7128322473136 |
| 20 | 510 | 579.729050434491 | -69.7290504344912 |
| 21 | 628 | 710.364913675344 | -82.3649136753443 |
| 22 | 1279 | 1261.57685556864 | 17.4231444313623 |
| 23 | 767 | 789.002222577232 | -22.002222577232 |
| 24 | 1156 | 962.05548381225 | 193.94451618775 |
| 25 | 1120 | 1104.95249541293 | 15.0475045870734 |
| 26 | 622 | 607.672807655528 | 14.3271923444718 |
| 27 | 1203 | 1426.37757866215 | -223.37757866215 |
| 28 | 745 | 729.456973691053 | 15.5430263089466 |
| 29 | 1535 | 1808.97929812799 | -273.979298127991 |
| 30 | 1234 | 1308.81196583205 | -74.8119658320462 |
| 31 | 757 | 695.409095083972 | 61.5909049160275 |
| 32 | 1087 | 984.66013753379 | 102.33986246621 |
| 33 | 1105 | 1076.74535627935 | 28.2546437206545 |
| 34 | 592 | 648.105538134705 | -56.1055381347052 |
| 35 | 1305 | 1212.65406444632 | 92.3459355536806 |
| 36 | 0 | -89.6891180238857 | 89.6891180238857 |
| 37 | 705 | 911.968400535432 | -206.968400535432 |
| 38 | 1188 | 1030.30497901107 | 157.695020988932 |
| 39 | 1110 | 775.74534963048 | 334.25465036952 |
| 40 | 1094 | 1280.38893540694 | -186.388935406937 |
| 41 | 1062 | 993.908979841763 | 68.0910201582373 |
| 42 | 748 | 894.4693414455 | -146.4693414455 |
| 43 | 404 | 471.080581066455 | -67.0805810664555 |
| 44 | 1076 | 1317.46118203244 | -241.461182032444 |
| 45 | 673 | 782.555637985802 | -109.555637985802 |
| 46 | 517 | 563.92641264538 | -46.9264126453801 |
| 47 | 354 | 322.238054530992 | 31.761945469008 |
| 48 | 1011 | 1115.66988082146 | -104.669880821457 |
| 49 | 890 | 961.245898148005 | -71.2458981480055 |
| 50 | 1067 | 1139.14521358952 | -72.1452135895166 |
| 51 | 518 | 488.48581646512 | 29.5141835348797 |
| 52 | 697 | 599.067868531135 | 97.932131468865 |
| 53 | 1095 | 1319.71195502594 | -224.711955025942 |
| 54 | 928 | 1023.51825326533 | -95.5182532653346 |
| 55 | 1008 | 1088.87613322426 | -80.8761332242627 |
| 56 | 951 | 838.049733844114 | 112.950266155886 |
| 57 | 779 | 726.811855306833 | 52.1881446931671 |
| 58 | 439 | 409.795406780149 | 29.2045932198515 |
| 59 | 568 | 665.987507612998 | -97.9875076129979 |
| 60 | 614 | 723.132556284139 | -109.132556284139 |
| 61 | 499 | 453.803032180036 | 45.1969678199643 |
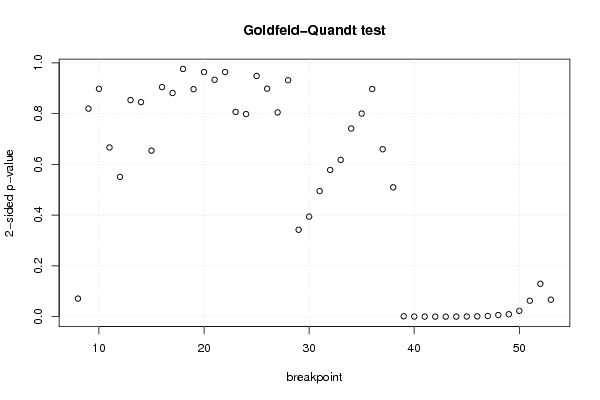
| Goldfeld-Quandt test for Heteroskedasticity | |||
| p-values | Alternative Hypothesis | ||
| breakpoint index | greater | 2-sided | less |
| 8 | 0.0356156596801011 | 0.0712313193602023 | 0.964384340319899 |
| 9 | 0.590394039702587 | 0.819211920594826 | 0.409605960297413 |
| 10 | 0.448727572511065 | 0.897455145022131 | 0.551272427488935 |
| 11 | 0.333200855083677 | 0.666401710167354 | 0.666799144916323 |
| 12 | 0.275249365267825 | 0.550498730535649 | 0.724750634732175 |
| 13 | 0.426455873417012 | 0.852911746834024 | 0.573544126582988 |
| 14 | 0.422426323969823 | 0.844852647939647 | 0.577573676030177 |
| 15 | 0.326921406624003 | 0.653842813248005 | 0.673078593375997 |
| 16 | 0.547868820612848 | 0.904262358774304 | 0.452131179387152 |
| 17 | 0.559507399396022 | 0.880985201207957 | 0.440492600603978 |
| 18 | 0.487837878673621 | 0.975675757347243 | 0.512162121326379 |
| 19 | 0.447946690887018 | 0.895893381774036 | 0.552053309112982 |
| 20 | 0.481764783565339 | 0.963529567130678 | 0.518235216434661 |
| 21 | 0.466520712867349 | 0.933041425734698 | 0.533479287132651 |
| 22 | 0.481781062419752 | 0.963562124839504 | 0.518218937580248 |
| 23 | 0.403173063676576 | 0.806346127353153 | 0.596826936323424 |
| 24 | 0.600979140421802 | 0.798041719156395 | 0.399020859578197 |
| 25 | 0.525901428777153 | 0.948197142445693 | 0.474098571222847 |
| 26 | 0.448981695176703 | 0.897963390353407 | 0.551018304823297 |
| 27 | 0.597733726710381 | 0.804532546579239 | 0.402266273289619 |
| 28 | 0.534367924440023 | 0.931264151119953 | 0.465632075559977 |
| 29 | 0.828863468611102 | 0.342273062777796 | 0.171136531388898 |
| 30 | 0.803034733025028 | 0.393930533949943 | 0.196965266974972 |
| 31 | 0.752698872557607 | 0.494602254884785 | 0.247301127442393 |
| 32 | 0.71106950143211 | 0.57786099713578 | 0.28893049856789 |
| 33 | 0.691188849755187 | 0.617622300489625 | 0.308811150244813 |
| 34 | 0.629466241938072 | 0.741067516123857 | 0.370533758061928 |
| 35 | 0.600055531889496 | 0.799888936221007 | 0.399944468110504 |
| 36 | 0.551634534050447 | 0.896730931899107 | 0.448365465949553 |
| 37 | 0.670286743933146 | 0.659426512133708 | 0.329713256066854 |
| 38 | 0.745253779761486 | 0.509492440477028 | 0.254746220238514 |
| 39 | 0.999238291839044 | 0.00152341632191299 | 0.000761708160956495 |
| 40 | 0.999755447952319 | 0.000489104095362259 | 0.000244552047681129 |
| 41 | 0.999864369258497 | 0.000271261483006639 | 0.00013563074150332 |
| 42 | 0.999954993510875 | 9.00129782506557e-05 | 4.50064891253278e-05 |
| 43 | 0.999932178426936 | 0.000135643146127043 | 6.78215730635216e-05 |
| 44 | 0.9998725279474 | 0.000254944105200993 | 0.000127472052600496 |
| 45 | 0.999642958448554 | 0.000714083102892994 | 0.000357041551446497 |
| 46 | 0.999391939964326 | 0.00121612007134795 | 0.000608060035673976 |
| 47 | 0.998679674474332 | 0.00264065105133561 | 0.00132032552566781 |
| 48 | 0.99675850655606 | 0.00648298688787929 | 0.00324149344393964 |
| 49 | 0.995231511274177 | 0.00953697745164587 | 0.00476848872582294 |
| 50 | 0.98855571950555 | 0.0228885609888996 | 0.0114442804944498 |
| 51 | 0.968553143341936 | 0.0628937133161278 | 0.0314468566580639 |
| 52 | 0.935189240064354 | 0.129621519871291 | 0.0648107599356455 |
| 53 | 0.966501275500706 | 0.0669974489985878 | 0.0334987244992939 |
| Meta Analysis of Goldfeld-Quandt test for Heteroskedasticity | |||
| Description | # significant tests | % significant tests | OK/NOK |
| 1% type I error level | 11 | 0.239130434782609 | NOK |
| 5% type I error level | 12 | 0.260869565217391 | NOK |
| 10% type I error level | 15 | 0.326086956521739 | NOK |