| Multiple Linear Regression - Estimated Regression Equation |
| le[t] = + 69.4869388743821 -0.022948018631255ppt[t] -0.000429261628844959ppp[t] + 0.0373536472389814t + e[t] |
| Multiple Linear Regression - Ordinary Least Squares | |||||
| Variable | Parameter | S.D. | T-STAT H0: parameter = 0 | 2-tail p-value | 1-tail p-value |
| (Intercept) | 69.4869388743821 | 2.177696 | 31.9085 | 0 | 0 |
| ppt | -0.022948018631255 | 0.009856 | -2.3283 | 0.025978 | 0.012989 |
| ppp | -0.000429261628844959 | 0.000205 | -2.0955 | 0.043649 | 0.021824 |
| t | 0.0373536472389814 | 0.091743 | 0.4072 | 0.686445 | 0.343222 |
| Multiple Linear Regression - Regression Statistics | |
| Multiple R | 0.665397051711698 |
| R-squared | 0.44275323642662 |
| Adjusted R-squared | 0.393584404346615 |
| F-TEST (value) | 9.00475398126606 |
| F-TEST (DF numerator) | 3 |
| F-TEST (DF denominator) | 34 |
| p-value | 0.000157558926747292 |
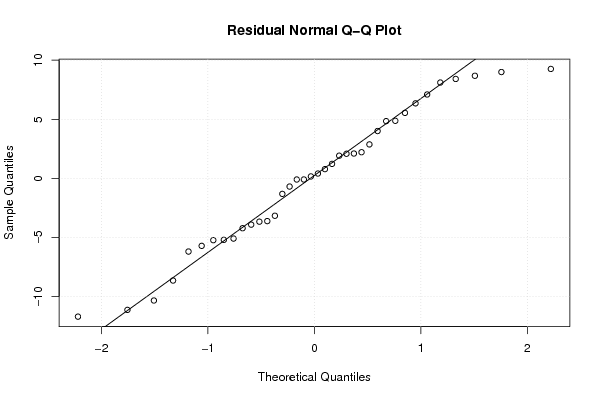
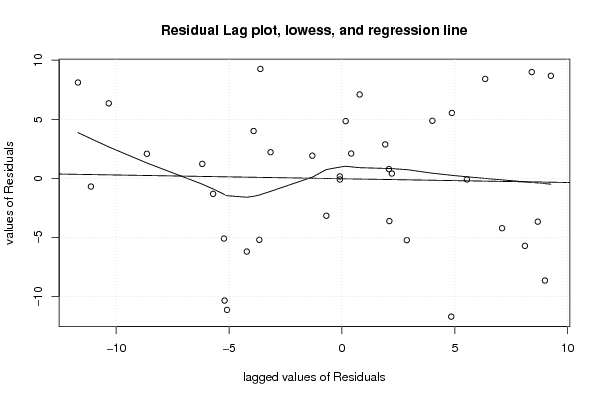
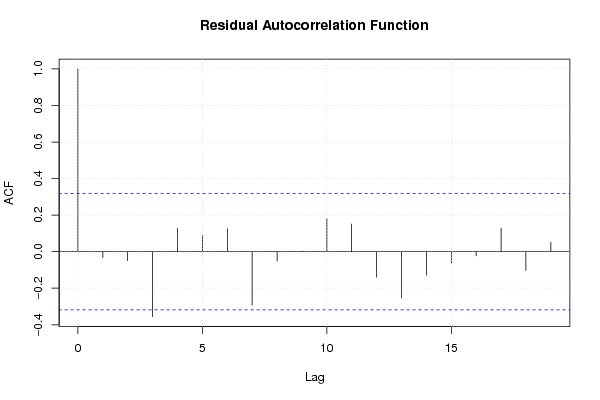
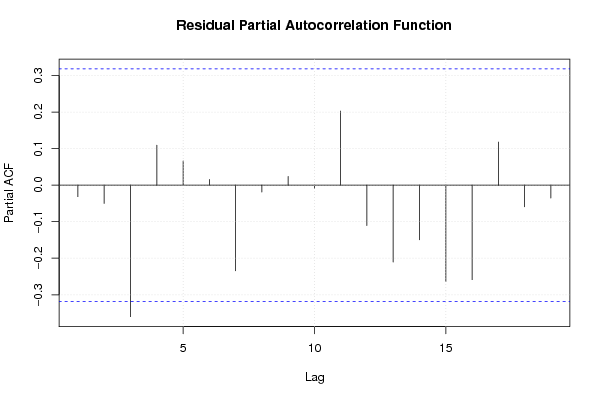
| Multiple Linear Regression - Residual Statistics | |
| Residual Standard Deviation | 6.07580789352442 |
| Sum Squared Residuals | 1255.12501300646 |
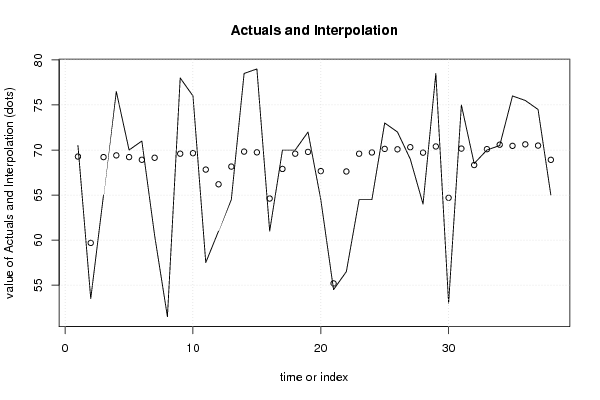
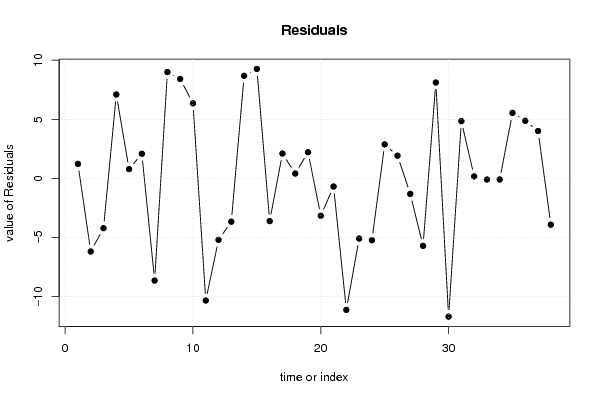
| Multiple Linear Regression - Actuals, Interpolation, and Residuals | |||
| Time or Index | Actuals | Interpolation Forecast | Residuals Prediction Error |
| 1 | 70.5 | 69.2736736444234 | 1.22632635557662 |
| 2 | 53.5 | 59.6861930965568 | -6.18619309655676 |
| 3 | 65 | 69.2135927874441 | -4.21359278744411 |
| 4 | 76.5 | 69.4046033603135 | 7.09539663968646 |
| 5 | 70 | 69.2141077341797 | 0.785892265820307 |
| 6 | 71 | 68.9167670671425 | 2.08323293285754 |
| 7 | 60.5 | 69.1397689622177 | -8.63976896221768 |
| 8 | 51.5 | 42.5061833673165 | 8.99381663268346 |
| 9 | 78 | 69.5904644146672 | 8.40953558533282 |
| 10 | 76 | 69.6522859747503 | 6.34771402524967 |
| 11 | 57.5 | 67.8274106893598 | -10.3274106893598 |
| 12 | 61 | 66.1963040766683 | -5.19630407666828 |
| 13 | 64.5 | 68.1603810664659 | -3.66038106646591 |
| 14 | 78.5 | 69.8226695054082 | 8.67733049459177 |
| 15 | 79 | 69.744516817464 | 9.25548318253599 |
| 16 | 61 | 64.612760137951 | -3.612760137951 |
| 17 | 70 | 67.8978023979592 | 2.10219760204077 |
| 18 | 70 | 69.5892663370419 | 0.410733662958077 |
| 19 | 72 | 69.7876442716495 | 2.21235572835048 |
| 20 | 64.5 | 67.6603115105439 | -3.16031151054392 |
| 21 | 54.5 | 55.1901616601731 | -0.690161660173113 |
| 22 | 56.5 | 67.6187392629686 | -11.1187392629686 |
| 23 | 64.5 | 69.5886706851347 | -5.08867068513466 |
| 24 | 64.5 | 69.7256079943293 | -5.2256079943293 |
| 25 | 73 | 70.1252372008492 | 2.87476279915081 |
| 26 | 72 | 70.0804883402838 | 1.91951165971621 |
| 27 | 69 | 70.3108749283438 | -1.31087492834377 |
| 28 | 64 | 69.7052022094776 | -5.70520220947756 |
| 29 | 78.5 | 70.392482847939 | 8.10751715206103 |
| 30 | 53 | 64.6925104210285 | -11.6925104210285 |
| 31 | 75 | 70.1572308073352 | 4.84276919266484 |
| 32 | 68.5 | 68.3337428474358 | 0.1662571525642 |
| 33 | 70 | 70.0944770634156 | -0.0944770634155886 |
| 34 | 70.5 | 70.5911056964948 | -0.091105696494775 |
| 35 | 76 | 70.4631936166284 | 5.53680638337155 |
| 36 | 75.5 | 70.6284160527115 | 4.87158394728853 |
| 37 | 74.5 | 70.4932602196747 | 4.00673978032528 |
| 38 | 65 | 68.911890926253 | -3.91189092625304 |
| Goldfeld-Quandt test for Heteroskedasticity | |||
| p-values | Alternative Hypothesis | ||
| breakpoint index | greater | 2-sided | less |
| 7 | 0.574343894023396 | 0.851312211953209 | 0.425656105976604 |
| 8 | 0.691124968215691 | 0.617750063568617 | 0.308875031784309 |
| 9 | 0.834969849530891 | 0.330060300938218 | 0.165030150469109 |
| 10 | 0.781334068608543 | 0.437331862782914 | 0.218665931391457 |
| 11 | 0.952318861131986 | 0.0953622777360277 | 0.0476811388680139 |
| 12 | 0.950212223628397 | 0.0995755527432052 | 0.0497877763716026 |
| 13 | 0.919522143180995 | 0.160955713638011 | 0.0804778568190053 |
| 14 | 0.96477468529658 | 0.0704506294068401 | 0.0352253147034201 |
| 15 | 0.985634032295802 | 0.0287319354083955 | 0.0143659677041978 |
| 16 | 0.984733638088133 | 0.0305327238237348 | 0.0152663619118674 |
| 17 | 0.975699426438842 | 0.0486011471223168 | 0.0243005735611584 |
| 18 | 0.960914152489179 | 0.0781716950216413 | 0.0390858475108207 |
| 19 | 0.950294031872143 | 0.0994119362557148 | 0.0497059681278574 |
| 20 | 0.948714697199411 | 0.102570605601177 | 0.0512853028005886 |
| 21 | 0.987208320796971 | 0.0255833584060574 | 0.0127916792030287 |
| 22 | 0.995307117601801 | 0.00938576479639813 | 0.00469288239819906 |
| 23 | 0.989922259677855 | 0.0201554806442902 | 0.0100777403221451 |
| 24 | 0.985509153195406 | 0.0289816936091876 | 0.0144908468045938 |
| 25 | 0.975707569563671 | 0.0485848608726581 | 0.0242924304363291 |
| 26 | 0.959334862082282 | 0.0813302758354354 | 0.0406651379177177 |
| 27 | 0.930909351584306 | 0.138181296831387 | 0.0690906484156937 |
| 28 | 0.971472400154827 | 0.0570551996903464 | 0.0285275998451732 |
| 29 | 0.967707873538174 | 0.0645842529236517 | 0.0322921264618259 |
| 30 | 0.954613869489562 | 0.0907722610208768 | 0.0453861305104384 |
| 31 | 0.980543639327177 | 0.0389127213456451 | 0.0194563606728226 |
| Meta Analysis of Goldfeld-Quandt test for Heteroskedasticity | |||
| Description | # significant tests | % significant tests | OK/NOK |
| 1% type I error level | 1 | 0.04 | NOK |
| 5% type I error level | 9 | 0.36 | NOK |
| 10% type I error level | 18 | 0.72 | NOK |