| Multiple Linear Regression - Estimated Regression Equation |
| CVI[t] = -0.031266629426127 + 25.0436377530621Maand[t] + 0.250820831688144Econ.Sit.[t] -0.253535208144581Werkloos[t] + 0.281057909245778Fin.Sit.[t] + 0.220929407806923Spaarverm.[t] + 0.00219967834472317t + e[t] |
| Multiple Linear Regression - Ordinary Least Squares | |||||
| Variable | Parameter | S.D. | T-STAT H0: parameter = 0 | 2-tail p-value | 1-tail p-value |
| (Intercept) | -0.031266629426127 | 0.246981 | -0.1266 | 0.899731 | 0.449865 |
| Maand | 25.0436377530621 | 9.582205 | 2.6136 | 0.011585 | 0.005793 |
| Econ.Sit. | 0.250820831688144 | 0.009393 | 26.7021 | 0 | 0 |
| Werkloos | -0.253535208144581 | 0.001874 | -135.2702 | 0 | 0 |
| Fin.Sit. | 0.281057909245778 | 0.038903 | 7.2246 | 0 | 0 |
| Spaarverm. | 0.220929407806923 | 0.014327 | 15.4201 | 0 | 0 |
| t | 0.00219967834472317 | 0.004616 | 0.4766 | 0.635587 | 0.317794 |
| Multiple Linear Regression - Regression Statistics | |
| Multiple R | 0.999294942391693 |
| R-squared | 0.998590381889617 |
| Adjusted R-squared | 0.99843375765513 |
| F-TEST (value) | 6375.70798133691 |
| F-TEST (DF numerator) | 6 |
| F-TEST (DF denominator) | 54 |
| p-value | 0 |
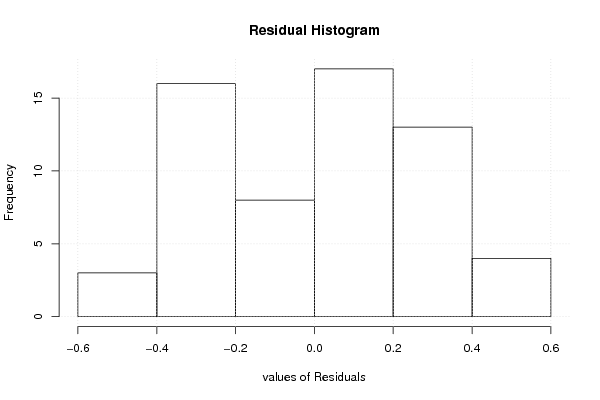
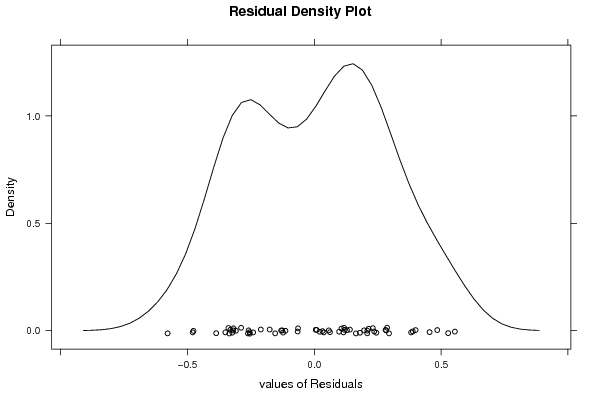
| Multiple Linear Regression - Residual Statistics | |
| Residual Standard Deviation | 0.294995436566869 |
| Sum Squared Residuals | 4.69920461014498 |
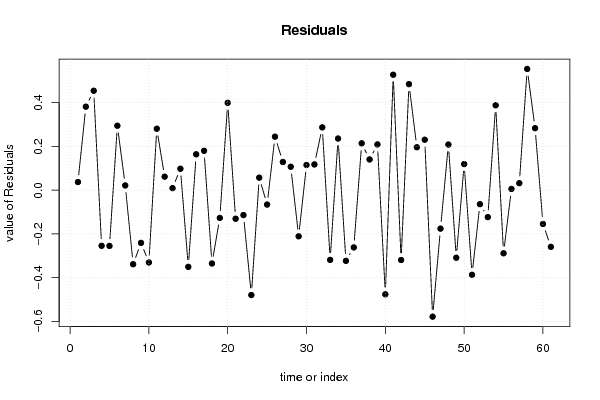
| Multiple Linear Regression - Actuals, Interpolation, and Residuals | |||
| Time or Index | Actuals | Interpolation Forecast | Residuals Prediction Error |
| 1 | -1 | -1.03721171426841 | 0.0372117142684074 |
| 2 | -2 | -2.38178471708581 | 0.381784717085812 |
| 3 | -5 | -5.45455731572733 | 0.45455731572733 |
| 4 | -4 | -3.74558935041591 | -0.254410649584088 |
| 5 | -6 | -5.74512901393021 | -0.254870986069789 |
| 6 | -2 | -2.29465296547037 | 0.294652965470372 |
| 7 | -2 | -2.02158933131512 | 0.0215893313151156 |
| 8 | -2 | -1.66137614972985 | -0.338623850270145 |
| 9 | -2 | -1.75901879163512 | -0.240981208364881 |
| 10 | 2 | 2.3305072425684 | -0.330507242568399 |
| 11 | 1 | 0.71905057843717 | 0.28094942156283 |
| 12 | -8 | -8.06178302762292 | 0.0617830276229175 |
| 13 | -1 | -1.00912596524286 | 0.00912596524286255 |
| 14 | 1 | 0.902101836243177 | 0.0978981637568227 |
| 15 | -1 | -0.649436705355541 | -0.350563294644459 |
| 16 | 2 | 1.83598776935154 | 0.164012230648458 |
| 17 | 2 | 1.82008341707439 | 0.179916582925607 |
| 18 | 1 | 1.33521342780634 | -0.335213427806344 |
| 19 | -1 | -0.873096306650643 | -0.126903693349357 |
| 20 | -2 | -2.39939435846738 | 0.399394358467381 |
| 21 | -2 | -1.86936055813983 | -0.130639441860172 |
| 22 | -1 | -0.88616869202689 | -0.11383130797311 |
| 23 | -8 | -7.52050538534612 | -0.479494614653882 |
| 24 | -4 | -4.05718984830938 | 0.0571898483093797 |
| 25 | -6 | -5.93421163469948 | -0.0657883653005204 |
| 26 | -3 | -3.2445951329556 | 0.244595132955603 |
| 27 | -3 | -3.12882348248244 | 0.128823482482444 |
| 28 | -7 | -7.10713498941964 | 0.107134989419641 |
| 29 | -9 | -8.78910281338957 | -0.210897186610432 |
| 30 | -11 | -11.1149936471757 | 0.114993647175672 |
| 31 | -13 | -13.1176197205546 | 0.117619720554646 |
| 32 | -11 | -11.287070251967 | 0.287070251966985 |
| 33 | -9 | -8.68136286647991 | -0.318637133520088 |
| 34 | -17 | -17.2361059564304 | 0.236105956430445 |
| 35 | -22 | -21.6768485514579 | -0.323151448542096 |
| 36 | -25 | -24.7382461447913 | -0.261753855208703 |
| 37 | -20 | -20.2143088527344 | 0.214308852734367 |
| 38 | -24 | -24.1404736309901 | 0.140473630990122 |
| 39 | -24 | -24.2091355824157 | 0.209135582415662 |
| 40 | -22 | -21.5237702078387 | -0.476229792161262 |
| 41 | -19 | -19.5278036322388 | 0.527803632238822 |
| 42 | -18 | -17.6807389110856 | -0.31926108891441 |
| 43 | -17 | -17.4848039743744 | 0.484803974374358 |
| 44 | -11 | -11.1962321993024 | 0.196232199302386 |
| 45 | -11 | -11.2306762115302 | 0.230676211530227 |
| 46 | -12 | -11.421731878487 | -0.57826812151304 |
| 47 | -10 | -9.82415050043885 | -0.175849499561149 |
| 48 | -15 | -15.2084919397373 | 0.208491939737275 |
| 49 | -15 | -14.6911036600389 | -0.30889633996111 |
| 50 | -15 | -15.1192765283141 | 0.119276528314132 |
| 51 | -13 | -12.6131132073522 | -0.386886792647834 |
| 52 | -8 | -7.9358390163875 | -0.0641609836124975 |
| 53 | -13 | -12.8767841040298 | -0.123215895970157 |
| 54 | -9 | -9.38824368890866 | 0.388243688908657 |
| 55 | -7 | -6.71141456628498 | -0.288585433715024 |
| 56 | -4 | -4.0056626626198 | 0.00566266261979795 |
| 57 | -4 | -4.03196018614167 | 0.0319601861416684 |
| 58 | -2 | -2.55422847936975 | 0.554228479369747 |
| 59 | 0 | -0.283344714152041 | 0.283344714152041 |
| 60 | -2 | -1.84562322053542 | -0.15437677946458 |
| 61 | -3 | -2.74094732762953 | -0.259052672370468 |
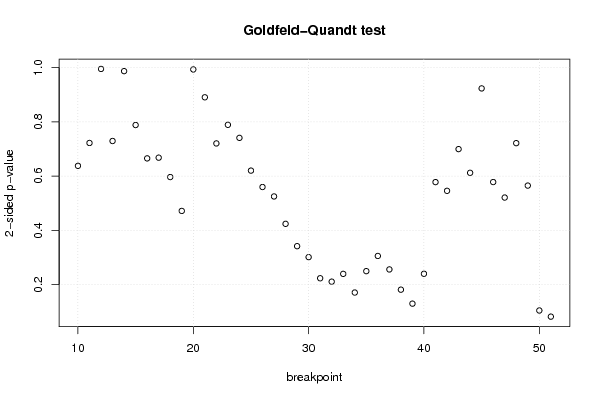
| Goldfeld-Quandt test for Heteroskedasticity | |||
| p-values | Alternative Hypothesis | ||
| breakpoint index | greater | 2-sided | less |
| 10 | 0.681104065390081 | 0.637791869219839 | 0.318895934609919 |
| 11 | 0.638947641764662 | 0.722104716470677 | 0.361052358235338 |
| 12 | 0.497464560850057 | 0.994929121700114 | 0.502535439149943 |
| 13 | 0.364711881714088 | 0.729423763428176 | 0.635288118285912 |
| 14 | 0.493438906701574 | 0.986877813403147 | 0.506561093298426 |
| 15 | 0.394133510811388 | 0.788267021622776 | 0.605866489188612 |
| 16 | 0.332674095326024 | 0.665348190652047 | 0.667325904673976 |
| 17 | 0.333958849451994 | 0.667917698903987 | 0.666041150548006 |
| 18 | 0.298268365267987 | 0.596536730535974 | 0.701731634732013 |
| 19 | 0.23583400000108 | 0.471668000002161 | 0.76416599999892 |
| 20 | 0.496559855229745 | 0.993119710459491 | 0.503440144770255 |
| 21 | 0.445233519203049 | 0.890467038406099 | 0.554766480796951 |
| 22 | 0.360200568031515 | 0.720401136063029 | 0.639799431968485 |
| 23 | 0.394478932370146 | 0.788957864740293 | 0.605521067629854 |
| 24 | 0.370498197625003 | 0.740996395250005 | 0.629501802374997 |
| 25 | 0.310111305363266 | 0.620222610726531 | 0.689888694636734 |
| 26 | 0.279892313587262 | 0.559784627174525 | 0.720107686412738 |
| 27 | 0.26250344143851 | 0.525006882877021 | 0.73749655856149 |
| 28 | 0.21205853117805 | 0.4241170623561 | 0.78794146882195 |
| 29 | 0.170866580456435 | 0.341733160912869 | 0.829133419543565 |
| 30 | 0.150670877068636 | 0.301341754137272 | 0.849329122931364 |
| 31 | 0.111770068768574 | 0.223540137537149 | 0.888229931231425 |
| 32 | 0.105469168246293 | 0.210938336492585 | 0.894530831753707 |
| 33 | 0.119850303340013 | 0.239700606680026 | 0.880149696659987 |
| 34 | 0.0854534009981124 | 0.170906801996225 | 0.914546599001888 |
| 35 | 0.12486273257892 | 0.24972546515784 | 0.87513726742108 |
| 36 | 0.152843233251446 | 0.305686466502892 | 0.847156766748554 |
| 37 | 0.128019700305225 | 0.25603940061045 | 0.871980299694775 |
| 38 | 0.090727999767884 | 0.181455999535768 | 0.909272000232116 |
| 39 | 0.064951191586956 | 0.129902383173912 | 0.935048808413044 |
| 40 | 0.120015804129634 | 0.240031608259268 | 0.879984195870366 |
| 41 | 0.28892294844079 | 0.577845896881581 | 0.71107705155921 |
| 42 | 0.272857210434807 | 0.545714420869614 | 0.727142789565193 |
| 43 | 0.349746085987207 | 0.699492171974413 | 0.650253914012793 |
| 44 | 0.306093913945892 | 0.612187827891784 | 0.693906086054108 |
| 45 | 0.461598292722152 | 0.923196585444305 | 0.538401707277848 |
| 46 | 0.71094507683261 | 0.57810984633478 | 0.28905492316739 |
| 47 | 0.7395216620029 | 0.520956675994201 | 0.2604783379971 |
| 48 | 0.639287242831873 | 0.721425514336254 | 0.360712757168127 |
| 49 | 0.717465654682926 | 0.565068690634148 | 0.282534345317074 |
| 50 | 0.947664050210293 | 0.104671899579414 | 0.0523359497897072 |
| 51 | 0.958994207628514 | 0.0820115847429725 | 0.0410057923714863 |
| Meta Analysis of Goldfeld-Quandt test for Heteroskedasticity | |||
| Description | # significant tests | % significant tests | OK/NOK |
| 1% type I error level | 0 | 0 | OK |
| 5% type I error level | 0 | 0 | OK |
| 10% type I error level | 1 | 0.0238095238095238 | OK |