Free Statistics

of Irreproducible Research!

Author's title

Author*The author of this computation has been verified*
R Software Modulerwasp_multipleregression.wasp
Title produced by softwareMultiple Regression
Date of computationWed, 23 Nov 2011 17:34:32 -0500
Cite this page as followsStatistical Computations at FreeStatistics.org, Office for Research Development and Education, URL https://freestatistics.org/blog/index.php?v=date/2011/Nov/23/t13220876913aw0lut5zenl5ik.htm/, Retrieved Thu, 25 Apr 2024 12:34:00 +0000
Statistical Computations at FreeStatistics.org, Office for Research Development and Education, URL https://freestatistics.org/blog/index.php?pk=146597, Retrieved Thu, 25 Apr 2024 12:34:00 +0000
QR Codes:

Original text written by user:
IsPrivate?No (this computation is public)
User-defined keywords
Estimated Impact96
Family? (F = Feedback message, R = changed R code, M = changed R Module, P = changed Parameters, D = changed Data)
-     [Multiple Regression] [Competence to learn] [2010-11-17 07:43:53] [b98453cac15ba1066b407e146608df68]
-   PD    [Multiple Regression] [] [2011-11-23 22:34:32] [fdc44bfd4083541fef2da21135af4be8] [Current]
Feedback Forum

Post a new message
Dataseries X:
55.769	84.772	139.633	192.336
200.319	272.486	281.580	342.025
65.796	92.979	144.053	195.502
85.951	113.394	246.160	336.207
314.009	446.551	682.705	896.047
74.519	89.309	152.383	201.209
43.631	68.559	100.903	139.615
169.962	224.126	210.574	255.907
54.318	68.640	103.816	148.496
52.499	79.661	131.938	180.930
198.970	266.927	262.611	319.421
66.544	88.943	141.263	189.670


Summary of computational transaction
Raw Inputview raw input (R code)
Raw Outputview raw output of R engine
Computing time3 seconds
R Server'Gertrude Mary Cox' @ cox.wessa.net

\begin{tabular}{lllllllll}
\hline
Summary of computational transaction \tabularnewline
Raw Input & view raw input (R code)  \tabularnewline
Raw Output & view raw output of R engine  \tabularnewline
Computing time & 3 seconds \tabularnewline
R Server & 'Gertrude Mary Cox' @ cox.wessa.net \tabularnewline
\hline
\end{tabular}
%Source: https://freestatistics.org/blog/index.php?pk=146597&T=0

[TABLE]
[ROW][C]Summary of computational transaction[/C][/ROW]
[ROW][C]Raw Input[/C][C]view raw input (R code) [/C][/ROW]
[ROW][C]Raw Output[/C][C]view raw output of R engine [/C][/ROW]
[ROW][C]Computing time[/C][C]3 seconds[/C][/ROW]
[ROW][C]R Server[/C][C]'Gertrude Mary Cox' @ cox.wessa.net[/C][/ROW]
[/TABLE]
Source: https://freestatistics.org/blog/index.php?pk=146597&T=0

Globally Unique Identifier (entire table): ba.freestatistics.org/blog/index.php?pk=146597&T=0

As an alternative you can also use a QR Code:  

The GUIDs for individual cells are displayed in the table below:

Summary of computational transaction
Raw Inputview raw input (R code)
Raw Outputview raw output of R engine
Computing time3 seconds
R Server'Gertrude Mary Cox' @ cox.wessa.net


Multiple Linear Regression - Estimated Regression Equation
2005[t] = -5.40392602506496 + 0.24512687720723`1992`[t] + 0.0127001368943751`2000`[t] + 0.676861788500026`2010`[t] + e[t]

\begin{tabular}{lllllllll}
\hline
Multiple Linear Regression - Estimated Regression Equation \tabularnewline
2005[t] =  -5.40392602506496 +  0.24512687720723`1992`[t] +  0.0127001368943751`2000`[t] +  0.676861788500026`2010`[t]  + e[t] \tabularnewline
\hline
\end{tabular}
%Source: https://freestatistics.org/blog/index.php?pk=146597&T=1

[TABLE]
[ROW][C]Multiple Linear Regression - Estimated Regression Equation[/C][/ROW]
[ROW][C]2005[t] =  -5.40392602506496 +  0.24512687720723`1992`[t] +  0.0127001368943751`2000`[t] +  0.676861788500026`2010`[t]  + e[t][/C][/ROW]
[/TABLE]
Source: https://freestatistics.org/blog/index.php?pk=146597&T=1

Globally Unique Identifier (entire table): ba.freestatistics.org/blog/index.php?pk=146597&T=1

As an alternative you can also use a QR Code:  

The GUIDs for individual cells are displayed in the table below:

Multiple Linear Regression - Estimated Regression Equation
2005[t] = -5.40392602506496 + 0.24512687720723`1992`[t] + 0.0127001368943751`2000`[t] + 0.676861788500026`2010`[t] + e[t]


Multiple Linear Regression - Ordinary Least Squares
VariableParameterS.D.T-STATH0: parameter = 02-tail p-value1-tail p-value
(Intercept)-5.403926025064961.380328-3.9150.004450.002225
`1992`0.245126877207230.1462991.67550.132360.06618
`2000`0.01270013689437510.113350.1120.9135490.456775
`2010`0.6768617885000260.00968469.896400

\begin{tabular}{lllllllll}
\hline
Multiple Linear Regression - Ordinary Least Squares \tabularnewline
Variable & Parameter & S.D. & T-STATH0: parameter = 0 & 2-tail p-value & 1-tail p-value \tabularnewline
(Intercept) & -5.40392602506496 & 1.380328 & -3.915 & 0.00445 & 0.002225 \tabularnewline
`1992` & 0.24512687720723 & 0.146299 & 1.6755 & 0.13236 & 0.06618 \tabularnewline
`2000` & 0.0127001368943751 & 0.11335 & 0.112 & 0.913549 & 0.456775 \tabularnewline
`2010` & 0.676861788500026 & 0.009684 & 69.8964 & 0 & 0 \tabularnewline
\hline
\end{tabular}
%Source: https://freestatistics.org/blog/index.php?pk=146597&T=2

[TABLE]
[ROW][C]Multiple Linear Regression - Ordinary Least Squares[/C][/ROW]
[ROW][C]Variable[/C][C]Parameter[/C][C]S.D.[/C][C]T-STATH0: parameter = 0[/C][C]2-tail p-value[/C][C]1-tail p-value[/C][/ROW]
[ROW][C](Intercept)[/C][C]-5.40392602506496[/C][C]1.380328[/C][C]-3.915[/C][C]0.00445[/C][C]0.002225[/C][/ROW]
[ROW][C]`1992`[/C][C]0.24512687720723[/C][C]0.146299[/C][C]1.6755[/C][C]0.13236[/C][C]0.06618[/C][/ROW]
[ROW][C]`2000`[/C][C]0.0127001368943751[/C][C]0.11335[/C][C]0.112[/C][C]0.913549[/C][C]0.456775[/C][/ROW]
[ROW][C]`2010`[/C][C]0.676861788500026[/C][C]0.009684[/C][C]69.8964[/C][C]0[/C][C]0[/C][/ROW]
[/TABLE]
Source: https://freestatistics.org/blog/index.php?pk=146597&T=2

Globally Unique Identifier (entire table): ba.freestatistics.org/blog/index.php?pk=146597&T=2

As an alternative you can also use a QR Code:  

The GUIDs for individual cells are displayed in the table below:

Multiple Linear Regression - Ordinary Least Squares
VariableParameterS.D.T-STATH0: parameter = 02-tail p-value1-tail p-value
(Intercept)-5.403926025064961.380328-3.9150.004450.002225
`1992`0.245126877207230.1462991.67550.132360.06618
`2000`0.01270013689437510.113350.1120.9135490.456775
`2010`0.6768617885000260.00968469.896400


Multiple Linear Regression - Regression Statistics
Multiple R0.99990745400614
R-squared0.999814916577041
Adjusted R-squared0.999745510293432
F-TEST (value)14405.2507147781
F-TEST (DF numerator)3
F-TEST (DF denominator)8
p-value2.88657986402541e-15
Multiple Linear Regression - Residual Statistics
Residual Standard Deviation2.53954898240927
Sum Squared Residuals51.5944722724476

\begin{tabular}{lllllllll}
\hline
Multiple Linear Regression - Regression Statistics \tabularnewline
Multiple R & 0.99990745400614 \tabularnewline
R-squared & 0.999814916577041 \tabularnewline
Adjusted R-squared & 0.999745510293432 \tabularnewline
F-TEST (value) & 14405.2507147781 \tabularnewline
F-TEST (DF numerator) & 3 \tabularnewline
F-TEST (DF denominator) & 8 \tabularnewline
p-value & 2.88657986402541e-15 \tabularnewline
Multiple Linear Regression - Residual Statistics \tabularnewline
Residual Standard Deviation & 2.53954898240927 \tabularnewline
Sum Squared Residuals & 51.5944722724476 \tabularnewline
\hline
\end{tabular}
%Source: https://freestatistics.org/blog/index.php?pk=146597&T=3

[TABLE]
[ROW][C]Multiple Linear Regression - Regression Statistics[/C][/ROW]
[ROW][C]Multiple R[/C][C]0.99990745400614[/C][/ROW]
[ROW][C]R-squared[/C][C]0.999814916577041[/C][/ROW]
[ROW][C]Adjusted R-squared[/C][C]0.999745510293432[/C][/ROW]
[ROW][C]F-TEST (value)[/C][C]14405.2507147781[/C][/ROW]
[ROW][C]F-TEST (DF numerator)[/C][C]3[/C][/ROW]
[ROW][C]F-TEST (DF denominator)[/C][C]8[/C][/ROW]
[ROW][C]p-value[/C][C]2.88657986402541e-15[/C][/ROW]
[ROW][C]Multiple Linear Regression - Residual Statistics[/C][/ROW]
[ROW][C]Residual Standard Deviation[/C][C]2.53954898240927[/C][/ROW]
[ROW][C]Sum Squared Residuals[/C][C]51.5944722724476[/C][/ROW]
[/TABLE]
Source: https://freestatistics.org/blog/index.php?pk=146597&T=3

Globally Unique Identifier (entire table): ba.freestatistics.org/blog/index.php?pk=146597&T=3

As an alternative you can also use a QR Code:  

The GUIDs for individual cells are displayed in the table below:

Multiple Linear Regression - Regression Statistics
Multiple R0.99990745400614
R-squared0.999814916577041
Adjusted R-squared0.999745510293432
F-TEST (value)14405.2507147781
F-TEST (DF numerator)3
F-TEST (DF denominator)8
p-value2.88657986402541e-15
Multiple Linear Regression - Residual Statistics
Residual Standard Deviation2.53954898240927
Sum Squared Residuals51.5944722724476


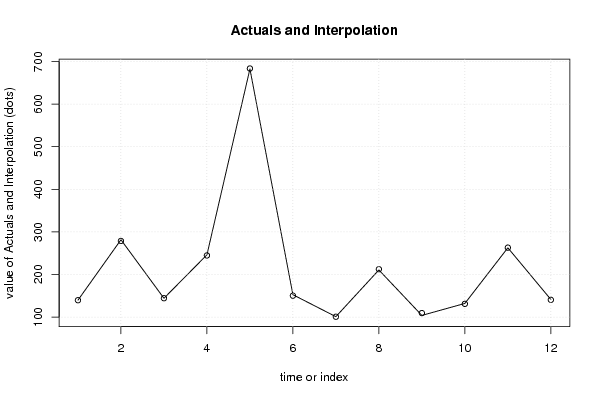
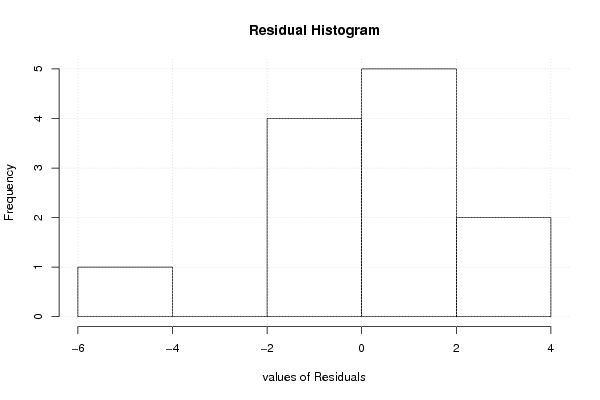
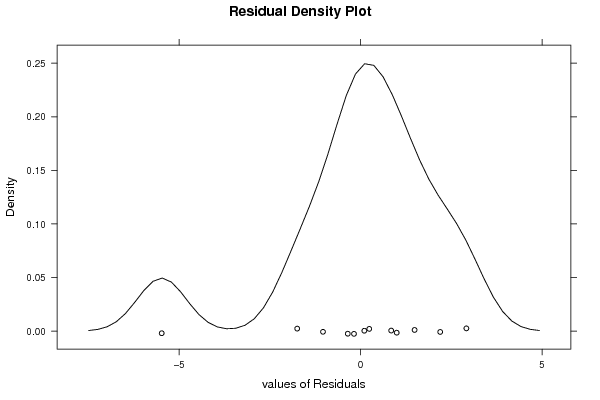
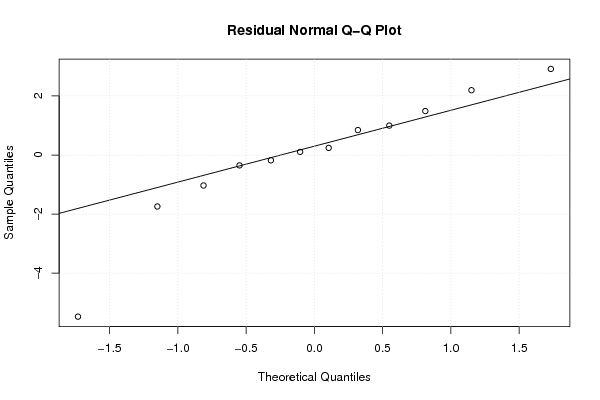
Multiple Linear Regression - Actuals, Interpolation, and Residuals
Time or IndexActualsInterpolationForecastResidualsPrediction Error
1139.633139.5280597476560.104940252343939
2281.58278.6639076037322.91609239626772
3144.053144.233121391296-0.180121391296209
4246.16244.6707648470031.48923515299723
5682.705683.739353390303-1.03435339030323
6152.383150.1876038657422.19539613425786
7100.903100.6619720411360.241027958863679
8210.574212.318428870095-1.74442887009518
9103.816109.293881232607-5.47788123260716
10131.938130.941298899890.99670110011001
11262.611262.962847518129-0.351847518129338
12141.263140.4177605924090.845239407590682

\begin{tabular}{lllllllll}
\hline
Multiple Linear Regression - Actuals, Interpolation, and Residuals \tabularnewline
Time or Index & Actuals & InterpolationForecast & ResidualsPrediction Error \tabularnewline
1 & 139.633 & 139.528059747656 & 0.104940252343939 \tabularnewline
2 & 281.58 & 278.663907603732 & 2.91609239626772 \tabularnewline
3 & 144.053 & 144.233121391296 & -0.180121391296209 \tabularnewline
4 & 246.16 & 244.670764847003 & 1.48923515299723 \tabularnewline
5 & 682.705 & 683.739353390303 & -1.03435339030323 \tabularnewline
6 & 152.383 & 150.187603865742 & 2.19539613425786 \tabularnewline
7 & 100.903 & 100.661972041136 & 0.241027958863679 \tabularnewline
8 & 210.574 & 212.318428870095 & -1.74442887009518 \tabularnewline
9 & 103.816 & 109.293881232607 & -5.47788123260716 \tabularnewline
10 & 131.938 & 130.94129889989 & 0.99670110011001 \tabularnewline
11 & 262.611 & 262.962847518129 & -0.351847518129338 \tabularnewline
12 & 141.263 & 140.417760592409 & 0.845239407590682 \tabularnewline
\hline
\end{tabular}
%Source: https://freestatistics.org/blog/index.php?pk=146597&T=4

[TABLE]
[ROW][C]Multiple Linear Regression - Actuals, Interpolation, and Residuals[/C][/ROW]
[ROW][C]Time or Index[/C][C]Actuals[/C][C]InterpolationForecast[/C][C]ResidualsPrediction Error[/C][/ROW]
[ROW][C]1[/C][C]139.633[/C][C]139.528059747656[/C][C]0.104940252343939[/C][/ROW]
[ROW][C]2[/C][C]281.58[/C][C]278.663907603732[/C][C]2.91609239626772[/C][/ROW]
[ROW][C]3[/C][C]144.053[/C][C]144.233121391296[/C][C]-0.180121391296209[/C][/ROW]
[ROW][C]4[/C][C]246.16[/C][C]244.670764847003[/C][C]1.48923515299723[/C][/ROW]
[ROW][C]5[/C][C]682.705[/C][C]683.739353390303[/C][C]-1.03435339030323[/C][/ROW]
[ROW][C]6[/C][C]152.383[/C][C]150.187603865742[/C][C]2.19539613425786[/C][/ROW]
[ROW][C]7[/C][C]100.903[/C][C]100.661972041136[/C][C]0.241027958863679[/C][/ROW]
[ROW][C]8[/C][C]210.574[/C][C]212.318428870095[/C][C]-1.74442887009518[/C][/ROW]
[ROW][C]9[/C][C]103.816[/C][C]109.293881232607[/C][C]-5.47788123260716[/C][/ROW]
[ROW][C]10[/C][C]131.938[/C][C]130.94129889989[/C][C]0.99670110011001[/C][/ROW]
[ROW][C]11[/C][C]262.611[/C][C]262.962847518129[/C][C]-0.351847518129338[/C][/ROW]
[ROW][C]12[/C][C]141.263[/C][C]140.417760592409[/C][C]0.845239407590682[/C][/ROW]
[/TABLE]
Source: https://freestatistics.org/blog/index.php?pk=146597&T=4

Globally Unique Identifier (entire table): ba.freestatistics.org/blog/index.php?pk=146597&T=4

As an alternative you can also use a QR Code:  

The GUIDs for individual cells are displayed in the table below:

Multiple Linear Regression - Actuals, Interpolation, and Residuals
Time or IndexActualsInterpolationForecastResidualsPrediction Error
1139.633139.5280597476560.104940252343939
2281.58278.6639076037322.91609239626772
3144.053144.233121391296-0.180121391296209
4246.16244.6707648470031.48923515299723
5682.705683.739353390303-1.03435339030323
6152.383150.1876038657422.19539613425786
7100.903100.6619720411360.241027958863679
8210.574212.318428870095-1.74442887009518
9103.816109.293881232607-5.47788123260716
10131.938130.941298899890.99670110011001
11262.611262.962847518129-0.351847518129338
12141.263140.4177605924090.845239407590682


Parameters (Session):
Parameters (R input):
par1 = 3 ; par2 = Do not include Seasonal Dummies ; par3 = No Linear Trend ;
R code (references can be found in the software module):
library(lattice)
library(lmtest)
n25 <- 25 #minimum number of obs. for Goldfeld-Quandt test
par1 <- as.numeric(par1)
x <- t(y)
k <- length(x[1,])
n <- length(x[,1])
x1 <- cbind(x[,par1], x[,1:k!=par1])
mycolnames <- c(colnames(x)[par1], colnames(x)[1:k!=par1])
colnames(x1) <- mycolnames #colnames(x)[par1]
x <- x1
if (par3 == 'First Differences'){
x2 <- array(0, dim=c(n-1,k), dimnames=list(1:(n-1), paste('(1-B)',colnames(x),sep='')))
for (i in 1:n-1) {
for (j in 1:k) {
x2[i,j] <- x[i+1,j] - x[i,j]
}
}
x <- x2
}
if (par2 == 'Include Monthly Dummies'){
x2 <- array(0, dim=c(n,11), dimnames=list(1:n, paste('M', seq(1:11), sep ='')))
for (i in 1:11){
x2[seq(i,n,12),i] <- 1
}
x <- cbind(x, x2)
}
if (par2 == 'Include Quarterly Dummies'){
x2 <- array(0, dim=c(n,3), dimnames=list(1:n, paste('Q', seq(1:3), sep ='')))
for (i in 1:3){
x2[seq(i,n,4),i] <- 1
}
x <- cbind(x, x2)
}
k <- length(x[1,])
if (par3 == 'Linear Trend'){
x <- cbind(x, c(1:n))
colnames(x)[k+1] <- 't'
}
x
k <- length(x[1,])
df <- as.data.frame(x)
(mylm <- lm(df))
(mysum <- summary(mylm))
if (n > n25) {
kp3 <- k + 3
nmkm3 <- n - k - 3
gqarr <- array(NA, dim=c(nmkm3-kp3+1,3))
numgqtests <- 0
numsignificant1 <- 0
numsignificant5 <- 0
numsignificant10 <- 0
for (mypoint in kp3:nmkm3) {
j <- 0
numgqtests <- numgqtests + 1
for (myalt in c('greater', 'two.sided', 'less')) {
j <- j + 1
gqarr[mypoint-kp3+1,j] <- gqtest(mylm, point=mypoint, alternative=myalt)$p.value
}
if (gqarr[mypoint-kp3+1,2] < 0.01) numsignificant1 <- numsignificant1 + 1
if (gqarr[mypoint-kp3+1,2] < 0.05) numsignificant5 <- numsignificant5 + 1
if (gqarr[mypoint-kp3+1,2] < 0.10) numsignificant10 <- numsignificant10 + 1
}
gqarr
}
bitmap(file='test0.png')
plot(x[,1], type='l', main='Actuals and Interpolation', ylab='value of Actuals and Interpolation (dots)', xlab='time or index')
points(x[,1]-mysum$resid)
grid()
dev.off()
bitmap(file='test1.png')
plot(mysum$resid, type='b', pch=19, main='Residuals', ylab='value of Residuals', xlab='time or index')
grid()
dev.off()
bitmap(file='test2.png')
hist(mysum$resid, main='Residual Histogram', xlab='values of Residuals')
grid()
dev.off()
bitmap(file='test3.png')
densityplot(~mysum$resid,col='black',main='Residual Density Plot', xlab='values of Residuals')
dev.off()
bitmap(file='test4.png')
qqnorm(mysum$resid, main='Residual Normal Q-Q Plot')
qqline(mysum$resid)
grid()
dev.off()
(myerror <- as.ts(mysum$resid))
bitmap(file='test5.png')
dum <- cbind(lag(myerror,k=1),myerror)
dum
dum1 <- dum[2:length(myerror),]
dum1
z <- as.data.frame(dum1)
z
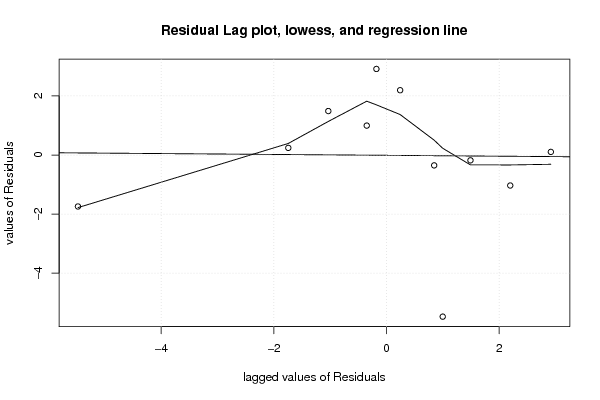
plot(z,main=paste('Residual Lag plot, lowess, and regression line'), ylab='values of Residuals', xlab='lagged values of Residuals')
lines(lowess(z))
abline(lm(z))
grid()
dev.off()
bitmap(file='test6.png')
acf(mysum$resid, lag.max=length(mysum$resid)/2, main='Residual Autocorrelation Function')
grid()
dev.off()
bitmap(file='test7.png')
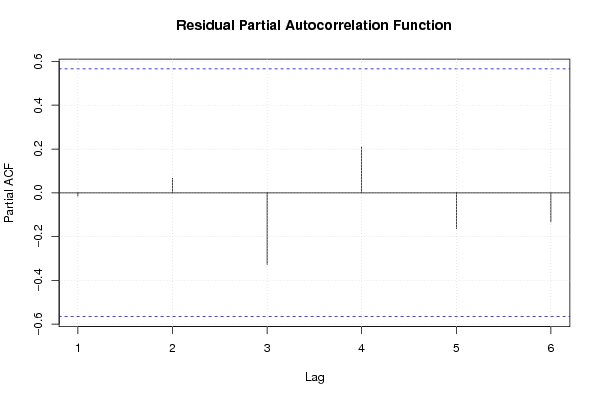
pacf(mysum$resid, lag.max=length(mysum$resid)/2, main='Residual Partial Autocorrelation Function')
grid()
dev.off()
bitmap(file='test8.png')
opar <- par(mfrow = c(2,2), oma = c(0, 0, 1.1, 0))
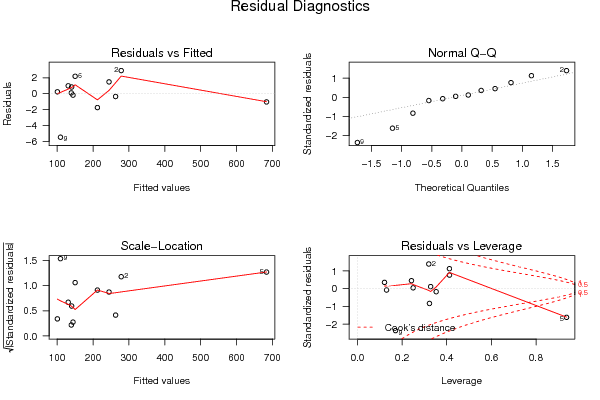
plot(mylm, las = 1, sub='Residual Diagnostics')
par(opar)
dev.off()
if (n > n25) {
bitmap(file='test9.png')
plot(kp3:nmkm3,gqarr[,2], main='Goldfeld-Quandt test',ylab='2-sided p-value',xlab='breakpoint')
grid()
dev.off()
}
load(file='createtable')
a<-table.start()
a<-table.row.start(a)
a<-table.element(a, 'Multiple Linear Regression - Estimated Regression Equation', 1, TRUE)
a<-table.row.end(a)
myeq <- colnames(x)[1]
myeq <- paste(myeq, '[t] = ', sep='')
for (i in 1:k){
if (mysum$coefficients[i,1] > 0) myeq <- paste(myeq, '+', '')
myeq <- paste(myeq, mysum$coefficients[i,1], sep=' ')
if (rownames(mysum$coefficients)[i] != '(Intercept)') {
myeq <- paste(myeq, rownames(mysum$coefficients)[i], sep='')
if (rownames(mysum$coefficients)[i] != 't') myeq <- paste(myeq, '[t]', sep='')
}
}
myeq <- paste(myeq, ' + e[t]')
a<-table.row.start(a)
a<-table.element(a, myeq)
a<-table.row.end(a)
a<-table.end(a)
table.save(a,file='mytable1.tab')
a<-table.start()
a<-table.row.start(a)
a<-table.element(a,hyperlink('ols1.htm','Multiple Linear Regression - Ordinary Least Squares',''), 6, TRUE)
a<-table.row.end(a)
a<-table.row.start(a)
a<-table.element(a,'Variable',header=TRUE)
a<-table.element(a,'Parameter',header=TRUE)
a<-table.element(a,'S.D.',header=TRUE)
a<-table.element(a,'T-STAT
H0: parameter = 0',header=TRUE)
a<-table.element(a,'2-tail p-value',header=TRUE)
a<-table.element(a,'1-tail p-value',header=TRUE)
a<-table.row.end(a)
for (i in 1:k){
a<-table.row.start(a)
a<-table.element(a,rownames(mysum$coefficients)[i],header=TRUE)
a<-table.element(a,mysum$coefficients[i,1])
a<-table.element(a, round(mysum$coefficients[i,2],6))
a<-table.element(a, round(mysum$coefficients[i,3],4))
a<-table.element(a, round(mysum$coefficients[i,4],6))
a<-table.element(a, round(mysum$coefficients[i,4]/2,6))
a<-table.row.end(a)
}
a<-table.end(a)
table.save(a,file='mytable2.tab')
a<-table.start()
a<-table.row.start(a)
a<-table.element(a, 'Multiple Linear Regression - Regression Statistics', 2, TRUE)
a<-table.row.end(a)
a<-table.row.start(a)
a<-table.element(a, 'Multiple R',1,TRUE)
a<-table.element(a, sqrt(mysum$r.squared))
a<-table.row.end(a)
a<-table.row.start(a)
a<-table.element(a, 'R-squared',1,TRUE)
a<-table.element(a, mysum$r.squared)
a<-table.row.end(a)
a<-table.row.start(a)
a<-table.element(a, 'Adjusted R-squared',1,TRUE)
a<-table.element(a, mysum$adj.r.squared)
a<-table.row.end(a)
a<-table.row.start(a)
a<-table.element(a, 'F-TEST (value)',1,TRUE)
a<-table.element(a, mysum$fstatistic[1])
a<-table.row.end(a)
a<-table.row.start(a)
a<-table.element(a, 'F-TEST (DF numerator)',1,TRUE)
a<-table.element(a, mysum$fstatistic[2])
a<-table.row.end(a)
a<-table.row.start(a)
a<-table.element(a, 'F-TEST (DF denominator)',1,TRUE)
a<-table.element(a, mysum$fstatistic[3])
a<-table.row.end(a)
a<-table.row.start(a)
a<-table.element(a, 'p-value',1,TRUE)
a<-table.element(a, 1-pf(mysum$fstatistic[1],mysum$fstatistic[2],mysum$fstatistic[3]))
a<-table.row.end(a)
a<-table.row.start(a)
a<-table.element(a, 'Multiple Linear Regression - Residual Statistics', 2, TRUE)
a<-table.row.end(a)
a<-table.row.start(a)
a<-table.element(a, 'Residual Standard Deviation',1,TRUE)
a<-table.element(a, mysum$sigma)
a<-table.row.end(a)
a<-table.row.start(a)
a<-table.element(a, 'Sum Squared Residuals',1,TRUE)
a<-table.element(a, sum(myerror*myerror))
a<-table.row.end(a)
a<-table.end(a)
table.save(a,file='mytable3.tab')
a<-table.start()
a<-table.row.start(a)
a<-table.element(a, 'Multiple Linear Regression - Actuals, Interpolation, and Residuals', 4, TRUE)
a<-table.row.end(a)
a<-table.row.start(a)
a<-table.element(a, 'Time or Index', 1, TRUE)
a<-table.element(a, 'Actuals', 1, TRUE)
a<-table.element(a, 'Interpolation
Forecast', 1, TRUE)
a<-table.element(a, 'Residuals
Prediction Error', 1, TRUE)
a<-table.row.end(a)
for (i in 1:n) {
a<-table.row.start(a)
a<-table.element(a,i, 1, TRUE)
a<-table.element(a,x[i])
a<-table.element(a,x[i]-mysum$resid[i])
a<-table.element(a,mysum$resid[i])
a<-table.row.end(a)
}
a<-table.end(a)
table.save(a,file='mytable4.tab')
if (n > n25) {
a<-table.start()
a<-table.row.start(a)
a<-table.element(a,'Goldfeld-Quandt test for Heteroskedasticity',4,TRUE)
a<-table.row.end(a)
a<-table.row.start(a)
a<-table.element(a,'p-values',header=TRUE)
a<-table.element(a,'Alternative Hypothesis',3,header=TRUE)
a<-table.row.end(a)
a<-table.row.start(a)
a<-table.element(a,'breakpoint index',header=TRUE)
a<-table.element(a,'greater',header=TRUE)
a<-table.element(a,'2-sided',header=TRUE)
a<-table.element(a,'less',header=TRUE)
a<-table.row.end(a)
for (mypoint in kp3:nmkm3) {
a<-table.row.start(a)
a<-table.element(a,mypoint,header=TRUE)
a<-table.element(a,gqarr[mypoint-kp3+1,1])
a<-table.element(a,gqarr[mypoint-kp3+1,2])
a<-table.element(a,gqarr[mypoint-kp3+1,3])
a<-table.row.end(a)
}
a<-table.end(a)
table.save(a,file='mytable5.tab')
a<-table.start()
a<-table.row.start(a)
a<-table.element(a,'Meta Analysis of Goldfeld-Quandt test for Heteroskedasticity',4,TRUE)
a<-table.row.end(a)
a<-table.row.start(a)
a<-table.element(a,'Description',header=TRUE)
a<-table.element(a,'# significant tests',header=TRUE)
a<-table.element(a,'% significant tests',header=TRUE)
a<-table.element(a,'OK/NOK',header=TRUE)
a<-table.row.end(a)
a<-table.row.start(a)
a<-table.element(a,'1% type I error level',header=TRUE)
a<-table.element(a,numsignificant1)
a<-table.element(a,numsignificant1/numgqtests)
if (numsignificant1/numgqtests < 0.01) dum <- 'OK' else dum <- 'NOK'
a<-table.element(a,dum)
a<-table.row.end(a)
a<-table.row.start(a)
a<-table.element(a,'5% type I error level',header=TRUE)
a<-table.element(a,numsignificant5)
a<-table.element(a,numsignificant5/numgqtests)
if (numsignificant5/numgqtests < 0.05) dum <- 'OK' else dum <- 'NOK'
a<-table.element(a,dum)
a<-table.row.end(a)
a<-table.row.start(a)
a<-table.element(a,'10% type I error level',header=TRUE)
a<-table.element(a,numsignificant10)
a<-table.element(a,numsignificant10/numgqtests)
if (numsignificant10/numgqtests < 0.1) dum <- 'OK' else dum <- 'NOK'
a<-table.element(a,dum)
a<-table.row.end(a)
a<-table.end(a)
table.save(a,file='mytable6.tab')
}