| Multiple Linear Regression - Estimated Regression Equation |
| le[t] = + 9.45032184809186e-16 + 7.10149027258258e-18ppt[t] -9.11168140274632e-20ppp[t] + 0.5fle[t] + 0.5mle[t] + e[t] |
| Multiple Linear Regression - Ordinary Least Squares | |||||
| Variable | Parameter | S.D. | T-STAT H0: parameter = 0 | 2-tail p-value | 1-tail p-value |
| (Intercept) | 9.45032184809186e-16 | 0 | 0.0812 | 0.935742 | 0.467871 |
| ppt | 7.10149027258258e-18 | 0 | 0.8498 | 0.401549 | 0.200774 |
| ppp | -9.11168140274632e-20 | 0 | -0.5253 | 0.60292 | 0.30146 |
| fle | 0.5 | 0 | 1142338511935841 | 0 | 0 |
| mle | 0.5 | 0 | 875550589120264 | 0 | 0 |
| Multiple Linear Regression - Regression Statistics | |
| Multiple R | 1 |
| R-squared | 1 |
| Adjusted R-squared | 1 |
| F-TEST (value) | 2.43892595927391e+31 |
| F-TEST (DF numerator) | 4 |
| F-TEST (DF denominator) | 33 |
| p-value | 0 |
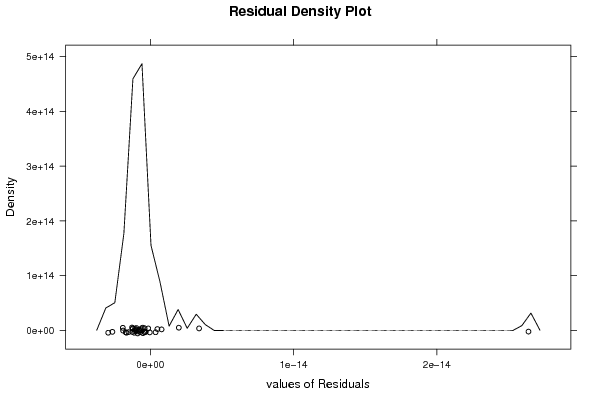
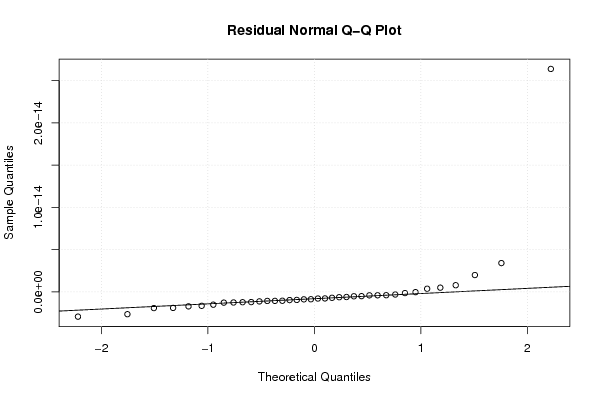
| Multiple Linear Regression - Residual Statistics | |
| Residual Standard Deviation | 4.80496701960004e-15 |
| Sum Squared Residuals | 7.61894365961656e-28 |
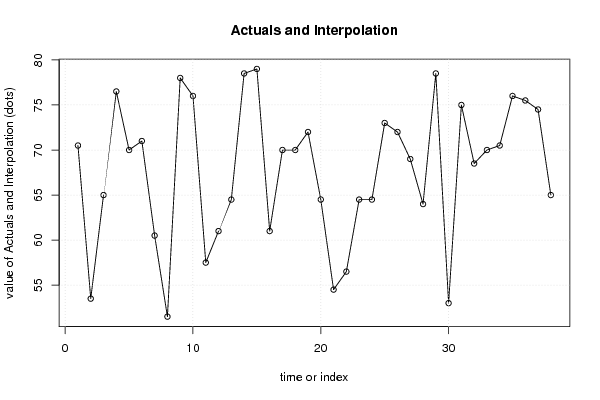
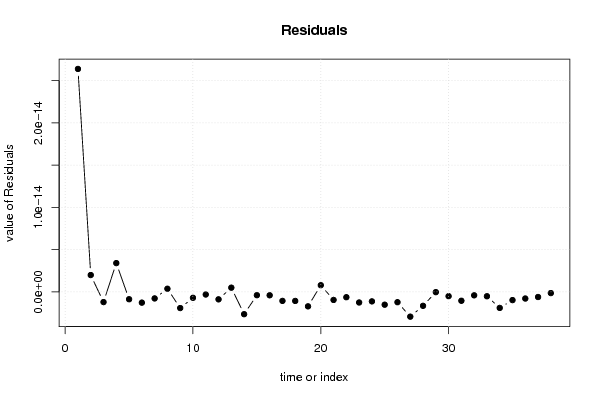
| Multiple Linear Regression - Actuals, Interpolation, and Residuals | |||
| Time or Index | Actuals | Interpolation Forecast | Residuals Prediction Error |
| 1 | 70.5 | 70.5 | 2.6394141859589e-14 |
| 2 | 53.5 | 53.5 | 1.99367045160454e-15 |
| 3 | 65 | 65 | -1.20774981137548e-15 |
| 4 | 76.5 | 76.5 | 3.4070344344399e-15 |
| 5 | 70 | 70 | -8.71386806467814e-16 |
| 6 | 71 | 71 | -1.27382257935751e-15 |
| 7 | 60.5 | 60.5 | -7.74681196540361e-16 |
| 8 | 51.5 | 51.5 | 3.6992215653759e-16 |
| 9 | 78 | 78 | -1.91623013458127e-15 |
| 10 | 76 | 76 | -7.02819403721485e-16 |
| 11 | 57.5 | 57.5 | -3.12108570165678e-16 |
| 12 | 61 | 61 | -8.83562941005713e-16 |
| 13 | 64.5 | 64.5 | 4.98031780503238e-16 |
| 14 | 78.5 | 78.5 | -2.64316517762173e-15 |
| 15 | 79 | 79 | -3.93093075018541e-16 |
| 16 | 61 | 61 | -4.02855753682166e-16 |
| 17 | 70 | 70 | -1.06670046709619e-15 |
| 18 | 70 | 70 | -1.07190610806208e-15 |
| 19 | 72 | 72 | -1.71318696760549e-15 |
| 20 | 64.5 | 64.5 | 7.88576046575796e-16 |
| 21 | 54.5 | 54.5 | -9.55082814264924e-16 |
| 22 | 56.5 | 56.5 | -6.31999146886223e-16 |
| 23 | 64.5 | 64.5 | -1.25547751013824e-15 |
| 24 | 64.5 | 64.5 | -1.12460720398329e-15 |
| 25 | 73 | 73 | -1.5164053453885e-15 |
| 26 | 72 | 72 | -1.22348885451218e-15 |
| 27 | 69 | 69 | -2.93323681212684e-15 |
| 28 | 64 | 64 | -1.65372341781208e-15 |
| 29 | 78.5 | 78.5 | -3.33895315782398e-17 |
| 30 | 53 | 53 | -5.07189551669323e-16 |
| 31 | 75 | 75 | -1.05208169966169e-15 |
| 32 | 68.5 | 68.5 | -4.08426044654709e-16 |
| 33 | 70 | 70 | -5.18916963911326e-16 |
| 34 | 70.5 | 70.5 | -1.89892926321338e-15 |
| 35 | 76 | 76 | -9.7132817593568e-16 |
| 36 | 75.5 | 75.5 | -7.86002805596287e-16 |
| 37 | 74.5 | 74.5 | -6.07148090140726e-16 |
| 38 | 65 | 65 | -1.40674505474915e-16 |
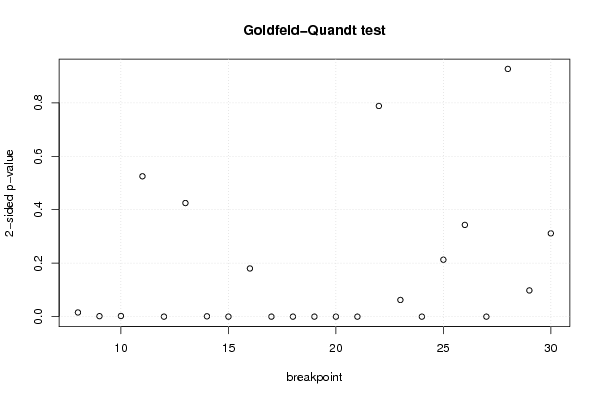
| Goldfeld-Quandt test for Heteroskedasticity | |||
| p-values | Alternative Hypothesis | ||
| breakpoint index | greater | 2-sided | less |
| 8 | 0.00781600550978231 | 0.0156320110195646 | 0.992183994490218 |
| 9 | 0.000904697106639778 | 0.00180939421327956 | 0.99909530289336 |
| 10 | 0.00123962623705209 | 0.00247925247410418 | 0.998760373762948 |
| 11 | 0.737447609397789 | 0.525104781204422 | 0.262552390602211 |
| 12 | 0.999999998486454 | 3.02709287970981e-09 | 1.5135464398549e-09 |
| 13 | 0.212538152328785 | 0.42507630465757 | 0.787461847671215 |
| 14 | 0.999352315146646 | 0.00129536970670873 | 0.000647684853354367 |
| 15 | 2.79445147124564e-07 | 5.58890294249128e-07 | 0.999999720554853 |
| 16 | 0.909881778951339 | 0.180236442097322 | 0.0901182210486609 |
| 17 | 0.999999999999417 | 1.16605650474874e-12 | 5.83028252374371e-13 |
| 18 | 3.84974568040614e-08 | 7.69949136081228e-08 | 0.999999961502543 |
| 19 | 2.45830905996175e-12 | 4.91661811992351e-12 | 0.999999999997542 |
| 20 | 0.99999999983058 | 3.38839233590887e-10 | 1.69419616795443e-10 |
| 21 | 0.999999999758617 | 4.82765222820674e-10 | 2.41382611410337e-10 |
| 22 | 0.605931316085481 | 0.788137367829038 | 0.394068683914519 |
| 23 | 0.968752036416959 | 0.0624959271660813 | 0.0312479635830406 |
| 24 | 4.21045560617755e-10 | 8.4209112123551e-10 | 0.999999999578954 |
| 25 | 0.89351246799547 | 0.21297506400906 | 0.10648753200453 |
| 26 | 0.828396537019417 | 0.343206925961167 | 0.171603462980583 |
| 27 | 7.20204856177968e-08 | 1.44040971235594e-07 | 0.999999927979514 |
| 28 | 0.536680557745008 | 0.926638884509984 | 0.463319442254992 |
| 29 | 0.950947093767514 | 0.0981058124649712 | 0.0490529062324856 |
| 30 | 0.155798495602543 | 0.311596991205086 | 0.844201504397457 |
| Meta Analysis of Goldfeld-Quandt test for Heteroskedasticity | |||
| Description | # significant tests | % significant tests | OK/NOK |
| 1% type I error level | 12 | 0.521739130434783 | NOK |
| 5% type I error level | 13 | 0.565217391304348 | NOK |
| 10% type I error level | 15 | 0.652173913043478 | NOK |