Free Statistics

of Irreproducible Research!

Author's title

Author*The author of this computation has been verified*
R Software Modulerwasp_multipleregression.wasp
Title produced by softwareMultiple Regression
Date of computationWed, 23 Nov 2011 15:21:58 -0500
Cite this page as followsStatistical Computations at FreeStatistics.org, Office for Research Development and Education, URL https://freestatistics.org/blog/index.php?v=date/2011/Nov/23/t1322079831dfqz21fc71ageb2.htm/, Retrieved Fri, 26 Apr 2024 14:33:22 +0000
Statistical Computations at FreeStatistics.org, Office for Research Development and Education, URL https://freestatistics.org/blog/index.php?pk=146578, Retrieved Fri, 26 Apr 2024 14:33:22 +0000
QR Codes:

Original text written by user:
IsPrivate?No (this computation is public)
User-defined keywords
Estimated Impact86
Family? (F = Feedback message, R = changed R code, M = changed R Module, P = changed Parameters, D = changed Data)
-       [Multiple Regression] [le ppt ppp fle mle] [2011-11-23 20:21:58] [e524eb56e6915a531809c7eb50783bc6] [Current]
Feedback Forum

Post a new message
Dataseries X:
70.5	4.0	370	74	67
53.5	315.0	6166	53	54
65.0	4.0	684	68	62
76.5	1.7	449	80	73
70.0	8.0	643	72	68
71.0	5.6	1551	74	68
60.5	15.0	616	61	60
51.5	503.0	36660	53	50
78.0	2.6	403	82	74
76.0	2.6	346	79	73
57.5	44.0	2471	58	57
61.0	24.0	7427	63	59
64.5	23.0	2992	65	64
78.5	3.8	233	82	75
79.0	1.8	609	82	76
61.0	96.0	7615	63	59
70.0	90.0	370	73	67
70.0	4.9	1066	73	67
72.0	6.6	600	76	68
64.5	21.0	4873	66	63
54.5	592.0	3485	56	53
56.5	73.0	2364	57	56
64.5	14.0	1016	67	62
64.5	8.8	1062	67	62
73.0	3.9	480	77	69
72.0	6.0	559	75	69
69.0	3.2	259	74	64
64.0	11.0	1340	67	61
78.5	2.6	275	82	75
53.0	23.0	12550	54	52
75.0	3.2	965	78	72
68.5	11.0	4883	71	66
70.0	5.0	1189	72	68
70.5	3.0	226	75	66
76.0	3.0	611	79	73
75.5	1.3	404	79	72
74.5	5.6	576	78	71
65.0	29.0	3096	67	63


Summary of computational transaction
Raw Inputview raw input (R code)
Raw Outputview raw output of R engine
Computing time4 seconds
R Server'Gwilym Jenkins' @ jenkins.wessa.net

\begin{tabular}{lllllllll}
\hline
Summary of computational transaction \tabularnewline
Raw Input & view raw input (R code)  \tabularnewline
Raw Output & view raw output of R engine  \tabularnewline
Computing time & 4 seconds \tabularnewline
R Server & 'Gwilym Jenkins' @ jenkins.wessa.net \tabularnewline
\hline
\end{tabular}
%Source: https://freestatistics.org/blog/index.php?pk=146578&T=0

[TABLE]
[ROW][C]Summary of computational transaction[/C][/ROW]
[ROW][C]Raw Input[/C][C]view raw input (R code) [/C][/ROW]
[ROW][C]Raw Output[/C][C]view raw output of R engine [/C][/ROW]
[ROW][C]Computing time[/C][C]4 seconds[/C][/ROW]
[ROW][C]R Server[/C][C]'Gwilym Jenkins' @ jenkins.wessa.net[/C][/ROW]
[/TABLE]
Source: https://freestatistics.org/blog/index.php?pk=146578&T=0

Globally Unique Identifier (entire table): ba.freestatistics.org/blog/index.php?pk=146578&T=0

As an alternative you can also use a QR Code:  

The GUIDs for individual cells are displayed in the table below:

Summary of computational transaction
Raw Inputview raw input (R code)
Raw Outputview raw output of R engine
Computing time4 seconds
R Server'Gwilym Jenkins' @ jenkins.wessa.net


Multiple Linear Regression - Estimated Regression Equation
le[t] = + 9.45032184809186e-16 + 7.10149027258258e-18ppt[t] -9.11168140274632e-20ppp[t] + 0.5fle[t] + 0.5mle[t] + e[t]

\begin{tabular}{lllllllll}
\hline
Multiple Linear Regression - Estimated Regression Equation \tabularnewline
le[t] =  +  9.45032184809186e-16 +  7.10149027258258e-18ppt[t] -9.11168140274632e-20ppp[t] +  0.5fle[t] +  0.5mle[t]  + e[t] \tabularnewline
\hline
\end{tabular}
%Source: https://freestatistics.org/blog/index.php?pk=146578&T=1

[TABLE]
[ROW][C]Multiple Linear Regression - Estimated Regression Equation[/C][/ROW]
[ROW][C]le[t] =  +  9.45032184809186e-16 +  7.10149027258258e-18ppt[t] -9.11168140274632e-20ppp[t] +  0.5fle[t] +  0.5mle[t]  + e[t][/C][/ROW]
[/TABLE]
Source: https://freestatistics.org/blog/index.php?pk=146578&T=1

Globally Unique Identifier (entire table): ba.freestatistics.org/blog/index.php?pk=146578&T=1

As an alternative you can also use a QR Code:  

The GUIDs for individual cells are displayed in the table below:

Multiple Linear Regression - Estimated Regression Equation
le[t] = + 9.45032184809186e-16 + 7.10149027258258e-18ppt[t] -9.11168140274632e-20ppp[t] + 0.5fle[t] + 0.5mle[t] + e[t]


Multiple Linear Regression - Ordinary Least Squares
VariableParameterS.D.T-STATH0: parameter = 02-tail p-value1-tail p-value
(Intercept)9.45032184809186e-1600.08120.9357420.467871
ppt7.10149027258258e-1800.84980.4015490.200774
ppp-9.11168140274632e-200-0.52530.602920.30146
fle0.50114233851193584100
mle0.5087555058912026400

\begin{tabular}{lllllllll}
\hline
Multiple Linear Regression - Ordinary Least Squares \tabularnewline
Variable & Parameter & S.D. & T-STATH0: parameter = 0 & 2-tail p-value & 1-tail p-value \tabularnewline
(Intercept) & 9.45032184809186e-16 & 0 & 0.0812 & 0.935742 & 0.467871 \tabularnewline
ppt & 7.10149027258258e-18 & 0 & 0.8498 & 0.401549 & 0.200774 \tabularnewline
ppp & -9.11168140274632e-20 & 0 & -0.5253 & 0.60292 & 0.30146 \tabularnewline
fle & 0.5 & 0 & 1142338511935841 & 0 & 0 \tabularnewline
mle & 0.5 & 0 & 875550589120264 & 0 & 0 \tabularnewline
\hline
\end{tabular}
%Source: https://freestatistics.org/blog/index.php?pk=146578&T=2

[TABLE]
[ROW][C]Multiple Linear Regression - Ordinary Least Squares[/C][/ROW]
[ROW][C]Variable[/C][C]Parameter[/C][C]S.D.[/C][C]T-STATH0: parameter = 0[/C][C]2-tail p-value[/C][C]1-tail p-value[/C][/ROW]
[ROW][C](Intercept)[/C][C]9.45032184809186e-16[/C][C]0[/C][C]0.0812[/C][C]0.935742[/C][C]0.467871[/C][/ROW]
[ROW][C]ppt[/C][C]7.10149027258258e-18[/C][C]0[/C][C]0.8498[/C][C]0.401549[/C][C]0.200774[/C][/ROW]
[ROW][C]ppp[/C][C]-9.11168140274632e-20[/C][C]0[/C][C]-0.5253[/C][C]0.60292[/C][C]0.30146[/C][/ROW]
[ROW][C]fle[/C][C]0.5[/C][C]0[/C][C]1142338511935841[/C][C]0[/C][C]0[/C][/ROW]
[ROW][C]mle[/C][C]0.5[/C][C]0[/C][C]875550589120264[/C][C]0[/C][C]0[/C][/ROW]
[/TABLE]
Source: https://freestatistics.org/blog/index.php?pk=146578&T=2

Globally Unique Identifier (entire table): ba.freestatistics.org/blog/index.php?pk=146578&T=2

As an alternative you can also use a QR Code:  

The GUIDs for individual cells are displayed in the table below:

Multiple Linear Regression - Ordinary Least Squares
VariableParameterS.D.T-STATH0: parameter = 02-tail p-value1-tail p-value
(Intercept)9.45032184809186e-1600.08120.9357420.467871
ppt7.10149027258258e-1800.84980.4015490.200774
ppp-9.11168140274632e-200-0.52530.602920.30146
fle0.50114233851193584100
mle0.5087555058912026400


Multiple Linear Regression - Regression Statistics
Multiple R1
R-squared1
Adjusted R-squared1
F-TEST (value)2.43892595927391e+31
F-TEST (DF numerator)4
F-TEST (DF denominator)33
p-value0
Multiple Linear Regression - Residual Statistics
Residual Standard Deviation4.80496701960004e-15
Sum Squared Residuals7.61894365961656e-28

\begin{tabular}{lllllllll}
\hline
Multiple Linear Regression - Regression Statistics \tabularnewline
Multiple R & 1 \tabularnewline
R-squared & 1 \tabularnewline
Adjusted R-squared & 1 \tabularnewline
F-TEST (value) & 2.43892595927391e+31 \tabularnewline
F-TEST (DF numerator) & 4 \tabularnewline
F-TEST (DF denominator) & 33 \tabularnewline
p-value & 0 \tabularnewline
Multiple Linear Regression - Residual Statistics \tabularnewline
Residual Standard Deviation & 4.80496701960004e-15 \tabularnewline
Sum Squared Residuals & 7.61894365961656e-28 \tabularnewline
\hline
\end{tabular}
%Source: https://freestatistics.org/blog/index.php?pk=146578&T=3

[TABLE]
[ROW][C]Multiple Linear Regression - Regression Statistics[/C][/ROW]
[ROW][C]Multiple R[/C][C]1[/C][/ROW]
[ROW][C]R-squared[/C][C]1[/C][/ROW]
[ROW][C]Adjusted R-squared[/C][C]1[/C][/ROW]
[ROW][C]F-TEST (value)[/C][C]2.43892595927391e+31[/C][/ROW]
[ROW][C]F-TEST (DF numerator)[/C][C]4[/C][/ROW]
[ROW][C]F-TEST (DF denominator)[/C][C]33[/C][/ROW]
[ROW][C]p-value[/C][C]0[/C][/ROW]
[ROW][C]Multiple Linear Regression - Residual Statistics[/C][/ROW]
[ROW][C]Residual Standard Deviation[/C][C]4.80496701960004e-15[/C][/ROW]
[ROW][C]Sum Squared Residuals[/C][C]7.61894365961656e-28[/C][/ROW]
[/TABLE]
Source: https://freestatistics.org/blog/index.php?pk=146578&T=3

Globally Unique Identifier (entire table): ba.freestatistics.org/blog/index.php?pk=146578&T=3

As an alternative you can also use a QR Code:  

The GUIDs for individual cells are displayed in the table below:

Multiple Linear Regression - Regression Statistics
Multiple R1
R-squared1
Adjusted R-squared1
F-TEST (value)2.43892595927391e+31
F-TEST (DF numerator)4
F-TEST (DF denominator)33
p-value0
Multiple Linear Regression - Residual Statistics
Residual Standard Deviation4.80496701960004e-15
Sum Squared Residuals7.61894365961656e-28


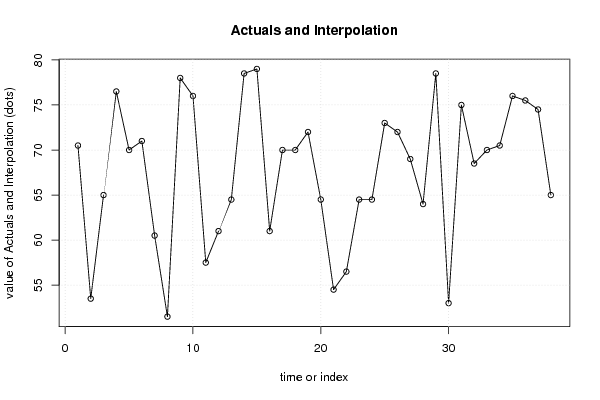
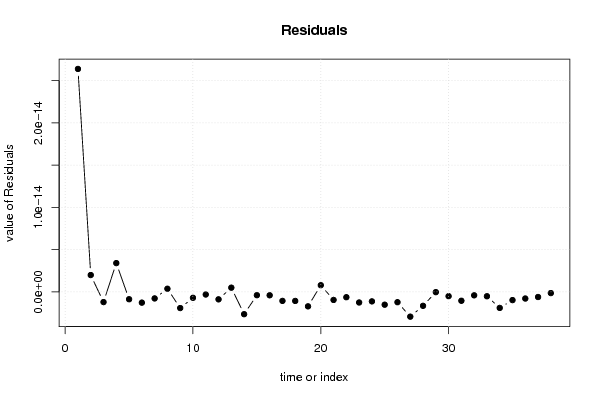
Multiple Linear Regression - Actuals, Interpolation, and Residuals
Time or IndexActualsInterpolationForecastResidualsPrediction Error
170.570.52.6394141859589e-14
253.553.51.99367045160454e-15
36565-1.20774981137548e-15
476.576.53.4070344344399e-15
57070-8.71386806467814e-16
67171-1.27382257935751e-15
760.560.5-7.74681196540361e-16
851.551.53.6992215653759e-16
97878-1.91623013458127e-15
107676-7.02819403721485e-16
1157.557.5-3.12108570165678e-16
126161-8.83562941005713e-16
1364.564.54.98031780503238e-16
1478.578.5-2.64316517762173e-15
157979-3.93093075018541e-16
166161-4.02855753682166e-16
177070-1.06670046709619e-15
187070-1.07190610806208e-15
197272-1.71318696760549e-15
2064.564.57.88576046575796e-16
2154.554.5-9.55082814264924e-16
2256.556.5-6.31999146886223e-16
2364.564.5-1.25547751013824e-15
2464.564.5-1.12460720398329e-15
257373-1.5164053453885e-15
267272-1.22348885451218e-15
276969-2.93323681212684e-15
286464-1.65372341781208e-15
2978.578.5-3.33895315782398e-17
305353-5.07189551669323e-16
317575-1.05208169966169e-15
3268.568.5-4.08426044654709e-16
337070-5.18916963911326e-16
3470.570.5-1.89892926321338e-15
357676-9.7132817593568e-16
3675.575.5-7.86002805596287e-16
3774.574.5-6.07148090140726e-16
386565-1.40674505474915e-16

\begin{tabular}{lllllllll}
\hline
Multiple Linear Regression - Actuals, Interpolation, and Residuals \tabularnewline
Time or Index & Actuals & InterpolationForecast & ResidualsPrediction Error \tabularnewline
1 & 70.5 & 70.5 & 2.6394141859589e-14 \tabularnewline
2 & 53.5 & 53.5 & 1.99367045160454e-15 \tabularnewline
3 & 65 & 65 & -1.20774981137548e-15 \tabularnewline
4 & 76.5 & 76.5 & 3.4070344344399e-15 \tabularnewline
5 & 70 & 70 & -8.71386806467814e-16 \tabularnewline
6 & 71 & 71 & -1.27382257935751e-15 \tabularnewline
7 & 60.5 & 60.5 & -7.74681196540361e-16 \tabularnewline
8 & 51.5 & 51.5 & 3.6992215653759e-16 \tabularnewline
9 & 78 & 78 & -1.91623013458127e-15 \tabularnewline
10 & 76 & 76 & -7.02819403721485e-16 \tabularnewline
11 & 57.5 & 57.5 & -3.12108570165678e-16 \tabularnewline
12 & 61 & 61 & -8.83562941005713e-16 \tabularnewline
13 & 64.5 & 64.5 & 4.98031780503238e-16 \tabularnewline
14 & 78.5 & 78.5 & -2.64316517762173e-15 \tabularnewline
15 & 79 & 79 & -3.93093075018541e-16 \tabularnewline
16 & 61 & 61 & -4.02855753682166e-16 \tabularnewline
17 & 70 & 70 & -1.06670046709619e-15 \tabularnewline
18 & 70 & 70 & -1.07190610806208e-15 \tabularnewline
19 & 72 & 72 & -1.71318696760549e-15 \tabularnewline
20 & 64.5 & 64.5 & 7.88576046575796e-16 \tabularnewline
21 & 54.5 & 54.5 & -9.55082814264924e-16 \tabularnewline
22 & 56.5 & 56.5 & -6.31999146886223e-16 \tabularnewline
23 & 64.5 & 64.5 & -1.25547751013824e-15 \tabularnewline
24 & 64.5 & 64.5 & -1.12460720398329e-15 \tabularnewline
25 & 73 & 73 & -1.5164053453885e-15 \tabularnewline
26 & 72 & 72 & -1.22348885451218e-15 \tabularnewline
27 & 69 & 69 & -2.93323681212684e-15 \tabularnewline
28 & 64 & 64 & -1.65372341781208e-15 \tabularnewline
29 & 78.5 & 78.5 & -3.33895315782398e-17 \tabularnewline
30 & 53 & 53 & -5.07189551669323e-16 \tabularnewline
31 & 75 & 75 & -1.05208169966169e-15 \tabularnewline
32 & 68.5 & 68.5 & -4.08426044654709e-16 \tabularnewline
33 & 70 & 70 & -5.18916963911326e-16 \tabularnewline
34 & 70.5 & 70.5 & -1.89892926321338e-15 \tabularnewline
35 & 76 & 76 & -9.7132817593568e-16 \tabularnewline
36 & 75.5 & 75.5 & -7.86002805596287e-16 \tabularnewline
37 & 74.5 & 74.5 & -6.07148090140726e-16 \tabularnewline
38 & 65 & 65 & -1.40674505474915e-16 \tabularnewline
\hline
\end{tabular}
%Source: https://freestatistics.org/blog/index.php?pk=146578&T=4

[TABLE]
[ROW][C]Multiple Linear Regression - Actuals, Interpolation, and Residuals[/C][/ROW]
[ROW][C]Time or Index[/C][C]Actuals[/C][C]InterpolationForecast[/C][C]ResidualsPrediction Error[/C][/ROW]
[ROW][C]1[/C][C]70.5[/C][C]70.5[/C][C]2.6394141859589e-14[/C][/ROW]
[ROW][C]2[/C][C]53.5[/C][C]53.5[/C][C]1.99367045160454e-15[/C][/ROW]
[ROW][C]3[/C][C]65[/C][C]65[/C][C]-1.20774981137548e-15[/C][/ROW]
[ROW][C]4[/C][C]76.5[/C][C]76.5[/C][C]3.4070344344399e-15[/C][/ROW]
[ROW][C]5[/C][C]70[/C][C]70[/C][C]-8.71386806467814e-16[/C][/ROW]
[ROW][C]6[/C][C]71[/C][C]71[/C][C]-1.27382257935751e-15[/C][/ROW]
[ROW][C]7[/C][C]60.5[/C][C]60.5[/C][C]-7.74681196540361e-16[/C][/ROW]
[ROW][C]8[/C][C]51.5[/C][C]51.5[/C][C]3.6992215653759e-16[/C][/ROW]
[ROW][C]9[/C][C]78[/C][C]78[/C][C]-1.91623013458127e-15[/C][/ROW]
[ROW][C]10[/C][C]76[/C][C]76[/C][C]-7.02819403721485e-16[/C][/ROW]
[ROW][C]11[/C][C]57.5[/C][C]57.5[/C][C]-3.12108570165678e-16[/C][/ROW]
[ROW][C]12[/C][C]61[/C][C]61[/C][C]-8.83562941005713e-16[/C][/ROW]
[ROW][C]13[/C][C]64.5[/C][C]64.5[/C][C]4.98031780503238e-16[/C][/ROW]
[ROW][C]14[/C][C]78.5[/C][C]78.5[/C][C]-2.64316517762173e-15[/C][/ROW]
[ROW][C]15[/C][C]79[/C][C]79[/C][C]-3.93093075018541e-16[/C][/ROW]
[ROW][C]16[/C][C]61[/C][C]61[/C][C]-4.02855753682166e-16[/C][/ROW]
[ROW][C]17[/C][C]70[/C][C]70[/C][C]-1.06670046709619e-15[/C][/ROW]
[ROW][C]18[/C][C]70[/C][C]70[/C][C]-1.07190610806208e-15[/C][/ROW]
[ROW][C]19[/C][C]72[/C][C]72[/C][C]-1.71318696760549e-15[/C][/ROW]
[ROW][C]20[/C][C]64.5[/C][C]64.5[/C][C]7.88576046575796e-16[/C][/ROW]
[ROW][C]21[/C][C]54.5[/C][C]54.5[/C][C]-9.55082814264924e-16[/C][/ROW]
[ROW][C]22[/C][C]56.5[/C][C]56.5[/C][C]-6.31999146886223e-16[/C][/ROW]
[ROW][C]23[/C][C]64.5[/C][C]64.5[/C][C]-1.25547751013824e-15[/C][/ROW]
[ROW][C]24[/C][C]64.5[/C][C]64.5[/C][C]-1.12460720398329e-15[/C][/ROW]
[ROW][C]25[/C][C]73[/C][C]73[/C][C]-1.5164053453885e-15[/C][/ROW]
[ROW][C]26[/C][C]72[/C][C]72[/C][C]-1.22348885451218e-15[/C][/ROW]
[ROW][C]27[/C][C]69[/C][C]69[/C][C]-2.93323681212684e-15[/C][/ROW]
[ROW][C]28[/C][C]64[/C][C]64[/C][C]-1.65372341781208e-15[/C][/ROW]
[ROW][C]29[/C][C]78.5[/C][C]78.5[/C][C]-3.33895315782398e-17[/C][/ROW]
[ROW][C]30[/C][C]53[/C][C]53[/C][C]-5.07189551669323e-16[/C][/ROW]
[ROW][C]31[/C][C]75[/C][C]75[/C][C]-1.05208169966169e-15[/C][/ROW]
[ROW][C]32[/C][C]68.5[/C][C]68.5[/C][C]-4.08426044654709e-16[/C][/ROW]
[ROW][C]33[/C][C]70[/C][C]70[/C][C]-5.18916963911326e-16[/C][/ROW]
[ROW][C]34[/C][C]70.5[/C][C]70.5[/C][C]-1.89892926321338e-15[/C][/ROW]
[ROW][C]35[/C][C]76[/C][C]76[/C][C]-9.7132817593568e-16[/C][/ROW]
[ROW][C]36[/C][C]75.5[/C][C]75.5[/C][C]-7.86002805596287e-16[/C][/ROW]
[ROW][C]37[/C][C]74.5[/C][C]74.5[/C][C]-6.07148090140726e-16[/C][/ROW]
[ROW][C]38[/C][C]65[/C][C]65[/C][C]-1.40674505474915e-16[/C][/ROW]
[/TABLE]
Source: https://freestatistics.org/blog/index.php?pk=146578&T=4

Globally Unique Identifier (entire table): ba.freestatistics.org/blog/index.php?pk=146578&T=4

As an alternative you can also use a QR Code:  

The GUIDs for individual cells are displayed in the table below:

Multiple Linear Regression - Actuals, Interpolation, and Residuals
Time or IndexActualsInterpolationForecastResidualsPrediction Error
170.570.52.6394141859589e-14
253.553.51.99367045160454e-15
36565-1.20774981137548e-15
476.576.53.4070344344399e-15
57070-8.71386806467814e-16
67171-1.27382257935751e-15
760.560.5-7.74681196540361e-16
851.551.53.6992215653759e-16
97878-1.91623013458127e-15
107676-7.02819403721485e-16
1157.557.5-3.12108570165678e-16
126161-8.83562941005713e-16
1364.564.54.98031780503238e-16
1478.578.5-2.64316517762173e-15
157979-3.93093075018541e-16
166161-4.02855753682166e-16
177070-1.06670046709619e-15
187070-1.07190610806208e-15
197272-1.71318696760549e-15
2064.564.57.88576046575796e-16
2154.554.5-9.55082814264924e-16
2256.556.5-6.31999146886223e-16
2364.564.5-1.25547751013824e-15
2464.564.5-1.12460720398329e-15
257373-1.5164053453885e-15
267272-1.22348885451218e-15
276969-2.93323681212684e-15
286464-1.65372341781208e-15
2978.578.5-3.33895315782398e-17
305353-5.07189551669323e-16
317575-1.05208169966169e-15
3268.568.5-4.08426044654709e-16
337070-5.18916963911326e-16
3470.570.5-1.89892926321338e-15
357676-9.7132817593568e-16
3675.575.5-7.86002805596287e-16
3774.574.5-6.07148090140726e-16
386565-1.40674505474915e-16


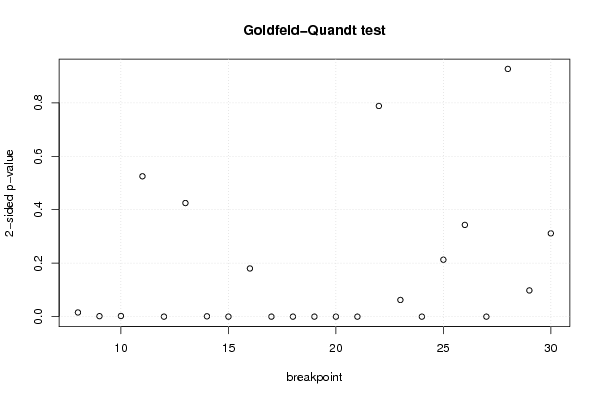
Goldfeld-Quandt test for Heteroskedasticity
p-valuesAlternative Hypothesis
breakpoint indexgreater2-sidedless
80.007816005509782310.01563201101956460.992183994490218
90.0009046971066397780.001809394213279560.99909530289336
100.001239626237052090.002479252474104180.998760373762948
110.7374476093977890.5251047812044220.262552390602211
120.9999999984864543.02709287970981e-091.5135464398549e-09
130.2125381523287850.425076304657570.787461847671215
140.9993523151466460.001295369706708730.000647684853354367
152.79445147124564e-075.58890294249128e-070.999999720554853
160.9098817789513390.1802364420973220.0901182210486609
170.9999999999994171.16605650474874e-125.83028252374371e-13
183.84974568040614e-087.69949136081228e-080.999999961502543
192.45830905996175e-124.91661811992351e-120.999999999997542
200.999999999830583.38839233590887e-101.69419616795443e-10
210.9999999997586174.82765222820674e-102.41382611410337e-10
220.6059313160854810.7881373678290380.394068683914519
230.9687520364169590.06249592716608130.0312479635830406
244.21045560617755e-108.4209112123551e-100.999999999578954
250.893512467995470.212975064009060.10648753200453
260.8283965370194170.3432069259611670.171603462980583
277.20204856177968e-081.44040971235594e-070.999999927979514
280.5366805577450080.9266388845099840.463319442254992
290.9509470937675140.09810581246497120.0490529062324856
300.1557984956025430.3115969912050860.844201504397457

\begin{tabular}{lllllllll}
\hline
Goldfeld-Quandt test for Heteroskedasticity \tabularnewline
p-values & Alternative Hypothesis \tabularnewline
breakpoint index & greater & 2-sided & less \tabularnewline
8 & 0.00781600550978231 & 0.0156320110195646 & 0.992183994490218 \tabularnewline
9 & 0.000904697106639778 & 0.00180939421327956 & 0.99909530289336 \tabularnewline
10 & 0.00123962623705209 & 0.00247925247410418 & 0.998760373762948 \tabularnewline
11 & 0.737447609397789 & 0.525104781204422 & 0.262552390602211 \tabularnewline
12 & 0.999999998486454 & 3.02709287970981e-09 & 1.5135464398549e-09 \tabularnewline
13 & 0.212538152328785 & 0.42507630465757 & 0.787461847671215 \tabularnewline
14 & 0.999352315146646 & 0.00129536970670873 & 0.000647684853354367 \tabularnewline
15 & 2.79445147124564e-07 & 5.58890294249128e-07 & 0.999999720554853 \tabularnewline
16 & 0.909881778951339 & 0.180236442097322 & 0.0901182210486609 \tabularnewline
17 & 0.999999999999417 & 1.16605650474874e-12 & 5.83028252374371e-13 \tabularnewline
18 & 3.84974568040614e-08 & 7.69949136081228e-08 & 0.999999961502543 \tabularnewline
19 & 2.45830905996175e-12 & 4.91661811992351e-12 & 0.999999999997542 \tabularnewline
20 & 0.99999999983058 & 3.38839233590887e-10 & 1.69419616795443e-10 \tabularnewline
21 & 0.999999999758617 & 4.82765222820674e-10 & 2.41382611410337e-10 \tabularnewline
22 & 0.605931316085481 & 0.788137367829038 & 0.394068683914519 \tabularnewline
23 & 0.968752036416959 & 0.0624959271660813 & 0.0312479635830406 \tabularnewline
24 & 4.21045560617755e-10 & 8.4209112123551e-10 & 0.999999999578954 \tabularnewline
25 & 0.89351246799547 & 0.21297506400906 & 0.10648753200453 \tabularnewline
26 & 0.828396537019417 & 0.343206925961167 & 0.171603462980583 \tabularnewline
27 & 7.20204856177968e-08 & 1.44040971235594e-07 & 0.999999927979514 \tabularnewline
28 & 0.536680557745008 & 0.926638884509984 & 0.463319442254992 \tabularnewline
29 & 0.950947093767514 & 0.0981058124649712 & 0.0490529062324856 \tabularnewline
30 & 0.155798495602543 & 0.311596991205086 & 0.844201504397457 \tabularnewline
\hline
\end{tabular}
%Source: https://freestatistics.org/blog/index.php?pk=146578&T=5

[TABLE]
[ROW][C]Goldfeld-Quandt test for Heteroskedasticity[/C][/ROW]
[ROW][C]p-values[/C][C]Alternative Hypothesis[/C][/ROW]
[ROW][C]breakpoint index[/C][C]greater[/C][C]2-sided[/C][C]less[/C][/ROW]
[ROW][C]8[/C][C]0.00781600550978231[/C][C]0.0156320110195646[/C][C]0.992183994490218[/C][/ROW]
[ROW][C]9[/C][C]0.000904697106639778[/C][C]0.00180939421327956[/C][C]0.99909530289336[/C][/ROW]
[ROW][C]10[/C][C]0.00123962623705209[/C][C]0.00247925247410418[/C][C]0.998760373762948[/C][/ROW]
[ROW][C]11[/C][C]0.737447609397789[/C][C]0.525104781204422[/C][C]0.262552390602211[/C][/ROW]
[ROW][C]12[/C][C]0.999999998486454[/C][C]3.02709287970981e-09[/C][C]1.5135464398549e-09[/C][/ROW]
[ROW][C]13[/C][C]0.212538152328785[/C][C]0.42507630465757[/C][C]0.787461847671215[/C][/ROW]
[ROW][C]14[/C][C]0.999352315146646[/C][C]0.00129536970670873[/C][C]0.000647684853354367[/C][/ROW]
[ROW][C]15[/C][C]2.79445147124564e-07[/C][C]5.58890294249128e-07[/C][C]0.999999720554853[/C][/ROW]
[ROW][C]16[/C][C]0.909881778951339[/C][C]0.180236442097322[/C][C]0.0901182210486609[/C][/ROW]
[ROW][C]17[/C][C]0.999999999999417[/C][C]1.16605650474874e-12[/C][C]5.83028252374371e-13[/C][/ROW]
[ROW][C]18[/C][C]3.84974568040614e-08[/C][C]7.69949136081228e-08[/C][C]0.999999961502543[/C][/ROW]
[ROW][C]19[/C][C]2.45830905996175e-12[/C][C]4.91661811992351e-12[/C][C]0.999999999997542[/C][/ROW]
[ROW][C]20[/C][C]0.99999999983058[/C][C]3.38839233590887e-10[/C][C]1.69419616795443e-10[/C][/ROW]
[ROW][C]21[/C][C]0.999999999758617[/C][C]4.82765222820674e-10[/C][C]2.41382611410337e-10[/C][/ROW]
[ROW][C]22[/C][C]0.605931316085481[/C][C]0.788137367829038[/C][C]0.394068683914519[/C][/ROW]
[ROW][C]23[/C][C]0.968752036416959[/C][C]0.0624959271660813[/C][C]0.0312479635830406[/C][/ROW]
[ROW][C]24[/C][C]4.21045560617755e-10[/C][C]8.4209112123551e-10[/C][C]0.999999999578954[/C][/ROW]
[ROW][C]25[/C][C]0.89351246799547[/C][C]0.21297506400906[/C][C]0.10648753200453[/C][/ROW]
[ROW][C]26[/C][C]0.828396537019417[/C][C]0.343206925961167[/C][C]0.171603462980583[/C][/ROW]
[ROW][C]27[/C][C]7.20204856177968e-08[/C][C]1.44040971235594e-07[/C][C]0.999999927979514[/C][/ROW]
[ROW][C]28[/C][C]0.536680557745008[/C][C]0.926638884509984[/C][C]0.463319442254992[/C][/ROW]
[ROW][C]29[/C][C]0.950947093767514[/C][C]0.0981058124649712[/C][C]0.0490529062324856[/C][/ROW]
[ROW][C]30[/C][C]0.155798495602543[/C][C]0.311596991205086[/C][C]0.844201504397457[/C][/ROW]
[/TABLE]
Source: https://freestatistics.org/blog/index.php?pk=146578&T=5

Globally Unique Identifier (entire table): ba.freestatistics.org/blog/index.php?pk=146578&T=5

As an alternative you can also use a QR Code:  

The GUIDs for individual cells are displayed in the table below:

Goldfeld-Quandt test for Heteroskedasticity
p-valuesAlternative Hypothesis
breakpoint indexgreater2-sidedless
80.007816005509782310.01563201101956460.992183994490218
90.0009046971066397780.001809394213279560.99909530289336
100.001239626237052090.002479252474104180.998760373762948
110.7374476093977890.5251047812044220.262552390602211
120.9999999984864543.02709287970981e-091.5135464398549e-09
130.2125381523287850.425076304657570.787461847671215
140.9993523151466460.001295369706708730.000647684853354367
152.79445147124564e-075.58890294249128e-070.999999720554853
160.9098817789513390.1802364420973220.0901182210486609
170.9999999999994171.16605650474874e-125.83028252374371e-13
183.84974568040614e-087.69949136081228e-080.999999961502543
192.45830905996175e-124.91661811992351e-120.999999999997542
200.999999999830583.38839233590887e-101.69419616795443e-10
210.9999999997586174.82765222820674e-102.41382611410337e-10
220.6059313160854810.7881373678290380.394068683914519
230.9687520364169590.06249592716608130.0312479635830406
244.21045560617755e-108.4209112123551e-100.999999999578954
250.893512467995470.212975064009060.10648753200453
260.8283965370194170.3432069259611670.171603462980583
277.20204856177968e-081.44040971235594e-070.999999927979514
280.5366805577450080.9266388845099840.463319442254992
290.9509470937675140.09810581246497120.0490529062324856
300.1557984956025430.3115969912050860.844201504397457


Meta Analysis of Goldfeld-Quandt test for Heteroskedasticity
Description# significant tests% significant testsOK/NOK
1% type I error level120.521739130434783NOK
5% type I error level130.565217391304348NOK
10% type I error level150.652173913043478NOK

\begin{tabular}{lllllllll}
\hline
Meta Analysis of Goldfeld-Quandt test for Heteroskedasticity \tabularnewline
Description & # significant tests & % significant tests & OK/NOK \tabularnewline
1% type I error level & 12 & 0.521739130434783 & NOK \tabularnewline
5% type I error level & 13 & 0.565217391304348 & NOK \tabularnewline
10% type I error level & 15 & 0.652173913043478 & NOK \tabularnewline
\hline
\end{tabular}
%Source: https://freestatistics.org/blog/index.php?pk=146578&T=6

[TABLE]
[ROW][C]Meta Analysis of Goldfeld-Quandt test for Heteroskedasticity[/C][/ROW]
[ROW][C]Description[/C][C]# significant tests[/C][C]% significant tests[/C][C]OK/NOK[/C][/ROW]
[ROW][C]1% type I error level[/C][C]12[/C][C]0.521739130434783[/C][C]NOK[/C][/ROW]
[ROW][C]5% type I error level[/C][C]13[/C][C]0.565217391304348[/C][C]NOK[/C][/ROW]
[ROW][C]10% type I error level[/C][C]15[/C][C]0.652173913043478[/C][C]NOK[/C][/ROW]
[/TABLE]
Source: https://freestatistics.org/blog/index.php?pk=146578&T=6

Globally Unique Identifier (entire table): ba.freestatistics.org/blog/index.php?pk=146578&T=6

As an alternative you can also use a QR Code:  

The GUIDs for individual cells are displayed in the table below:

Meta Analysis of Goldfeld-Quandt test for Heteroskedasticity
Description# significant tests% significant testsOK/NOK
1% type I error level120.521739130434783NOK
5% type I error level130.565217391304348NOK
10% type I error level150.652173913043478NOK


Parameters (Session):
par1 = 1 ; par2 = Do not include Seasonal Dummies ; par3 = No Linear Trend ;
Parameters (R input):
par1 = 1 ; par2 = Do not include Seasonal Dummies ; par3 = No Linear Trend ;
R code (references can be found in the software module):
library(lattice)
library(lmtest)
n25 <- 25 #minimum number of obs. for Goldfeld-Quandt test
par1 <- as.numeric(par1)
x <- t(y)
k <- length(x[1,])
n <- length(x[,1])
x1 <- cbind(x[,par1], x[,1:k!=par1])
mycolnames <- c(colnames(x)[par1], colnames(x)[1:k!=par1])
colnames(x1) <- mycolnames #colnames(x)[par1]
x <- x1
if (par3 == 'First Differences'){
x2 <- array(0, dim=c(n-1,k), dimnames=list(1:(n-1), paste('(1-B)',colnames(x),sep='')))
for (i in 1:n-1) {
for (j in 1:k) {
x2[i,j] <- x[i+1,j] - x[i,j]
}
}
x <- x2
}
if (par2 == 'Include Monthly Dummies'){
x2 <- array(0, dim=c(n,11), dimnames=list(1:n, paste('M', seq(1:11), sep ='')))
for (i in 1:11){
x2[seq(i,n,12),i] <- 1
}
x <- cbind(x, x2)
}
if (par2 == 'Include Quarterly Dummies'){
x2 <- array(0, dim=c(n,3), dimnames=list(1:n, paste('Q', seq(1:3), sep ='')))
for (i in 1:3){
x2[seq(i,n,4),i] <- 1
}
x <- cbind(x, x2)
}
k <- length(x[1,])
if (par3 == 'Linear Trend'){
x <- cbind(x, c(1:n))
colnames(x)[k+1] <- 't'
}
x
k <- length(x[1,])
df <- as.data.frame(x)
(mylm <- lm(df))
(mysum <- summary(mylm))
if (n > n25) {
kp3 <- k + 3
nmkm3 <- n - k - 3
gqarr <- array(NA, dim=c(nmkm3-kp3+1,3))
numgqtests <- 0
numsignificant1 <- 0
numsignificant5 <- 0
numsignificant10 <- 0
for (mypoint in kp3:nmkm3) {
j <- 0
numgqtests <- numgqtests + 1
for (myalt in c('greater', 'two.sided', 'less')) {
j <- j + 1
gqarr[mypoint-kp3+1,j] <- gqtest(mylm, point=mypoint, alternative=myalt)$p.value
}
if (gqarr[mypoint-kp3+1,2] < 0.01) numsignificant1 <- numsignificant1 + 1
if (gqarr[mypoint-kp3+1,2] < 0.05) numsignificant5 <- numsignificant5 + 1
if (gqarr[mypoint-kp3+1,2] < 0.10) numsignificant10 <- numsignificant10 + 1
}
gqarr
}
bitmap(file='test0.png')
plot(x[,1], type='l', main='Actuals and Interpolation', ylab='value of Actuals and Interpolation (dots)', xlab='time or index')
points(x[,1]-mysum$resid)
grid()
dev.off()
bitmap(file='test1.png')
plot(mysum$resid, type='b', pch=19, main='Residuals', ylab='value of Residuals', xlab='time or index')
grid()
dev.off()
bitmap(file='test2.png')
hist(mysum$resid, main='Residual Histogram', xlab='values of Residuals')
grid()
dev.off()
bitmap(file='test3.png')
densityplot(~mysum$resid,col='black',main='Residual Density Plot', xlab='values of Residuals')
dev.off()
bitmap(file='test4.png')
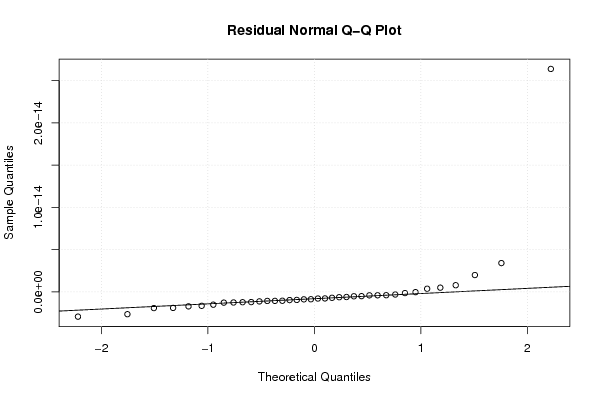
qqnorm(mysum$resid, main='Residual Normal Q-Q Plot')
qqline(mysum$resid)
grid()
dev.off()
(myerror <- as.ts(mysum$resid))
bitmap(file='test5.png')
dum <- cbind(lag(myerror,k=1),myerror)
dum
dum1 <- dum[2:length(myerror),]
dum1
z <- as.data.frame(dum1)
z
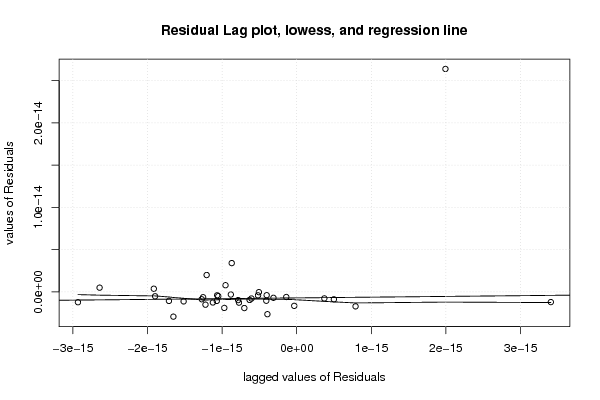
plot(z,main=paste('Residual Lag plot, lowess, and regression line'), ylab='values of Residuals', xlab='lagged values of Residuals')
lines(lowess(z))
abline(lm(z))
grid()
dev.off()
bitmap(file='test6.png')
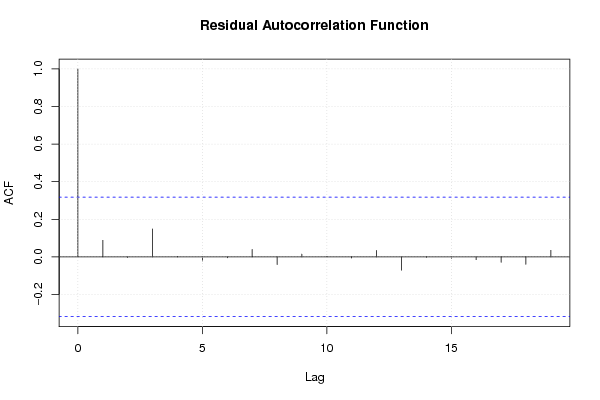
acf(mysum$resid, lag.max=length(mysum$resid)/2, main='Residual Autocorrelation Function')
grid()
dev.off()
bitmap(file='test7.png')
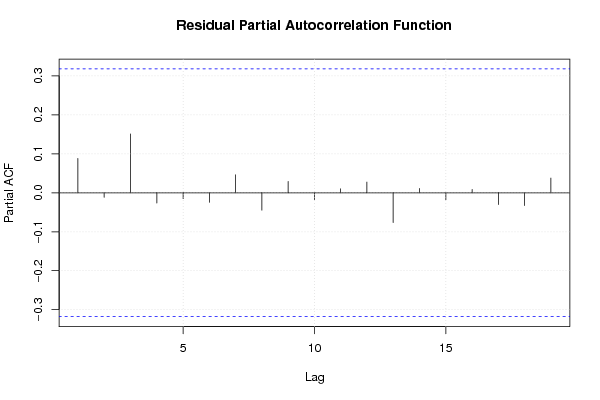
pacf(mysum$resid, lag.max=length(mysum$resid)/2, main='Residual Partial Autocorrelation Function')
grid()
dev.off()
bitmap(file='test8.png')
opar <- par(mfrow = c(2,2), oma = c(0, 0, 1.1, 0))
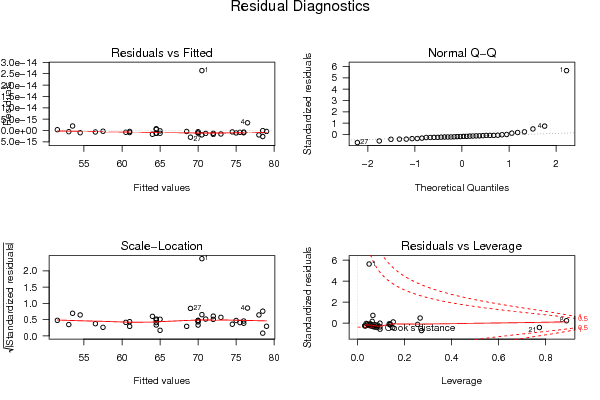
plot(mylm, las = 1, sub='Residual Diagnostics')
par(opar)
dev.off()
if (n > n25) {
bitmap(file='test9.png')
plot(kp3:nmkm3,gqarr[,2], main='Goldfeld-Quandt test',ylab='2-sided p-value',xlab='breakpoint')
grid()
dev.off()
}
load(file='createtable')
a<-table.start()
a<-table.row.start(a)
a<-table.element(a, 'Multiple Linear Regression - Estimated Regression Equation', 1, TRUE)
a<-table.row.end(a)
myeq <- colnames(x)[1]
myeq <- paste(myeq, '[t] = ', sep='')
for (i in 1:k){
if (mysum$coefficients[i,1] > 0) myeq <- paste(myeq, '+', '')
myeq <- paste(myeq, mysum$coefficients[i,1], sep=' ')
if (rownames(mysum$coefficients)[i] != '(Intercept)') {
myeq <- paste(myeq, rownames(mysum$coefficients)[i], sep='')
if (rownames(mysum$coefficients)[i] != 't') myeq <- paste(myeq, '[t]', sep='')
}
}
myeq <- paste(myeq, ' + e[t]')
a<-table.row.start(a)
a<-table.element(a, myeq)
a<-table.row.end(a)
a<-table.end(a)
table.save(a,file='mytable1.tab')
a<-table.start()
a<-table.row.start(a)
a<-table.element(a,hyperlink('ols1.htm','Multiple Linear Regression - Ordinary Least Squares',''), 6, TRUE)
a<-table.row.end(a)
a<-table.row.start(a)
a<-table.element(a,'Variable',header=TRUE)
a<-table.element(a,'Parameter',header=TRUE)
a<-table.element(a,'S.D.',header=TRUE)
a<-table.element(a,'T-STAT
H0: parameter = 0',header=TRUE)
a<-table.element(a,'2-tail p-value',header=TRUE)
a<-table.element(a,'1-tail p-value',header=TRUE)
a<-table.row.end(a)
for (i in 1:k){
a<-table.row.start(a)
a<-table.element(a,rownames(mysum$coefficients)[i],header=TRUE)
a<-table.element(a,mysum$coefficients[i,1])
a<-table.element(a, round(mysum$coefficients[i,2],6))
a<-table.element(a, round(mysum$coefficients[i,3],4))
a<-table.element(a, round(mysum$coefficients[i,4],6))
a<-table.element(a, round(mysum$coefficients[i,4]/2,6))
a<-table.row.end(a)
}
a<-table.end(a)
table.save(a,file='mytable2.tab')
a<-table.start()
a<-table.row.start(a)
a<-table.element(a, 'Multiple Linear Regression - Regression Statistics', 2, TRUE)
a<-table.row.end(a)
a<-table.row.start(a)
a<-table.element(a, 'Multiple R',1,TRUE)
a<-table.element(a, sqrt(mysum$r.squared))
a<-table.row.end(a)
a<-table.row.start(a)
a<-table.element(a, 'R-squared',1,TRUE)
a<-table.element(a, mysum$r.squared)
a<-table.row.end(a)
a<-table.row.start(a)
a<-table.element(a, 'Adjusted R-squared',1,TRUE)
a<-table.element(a, mysum$adj.r.squared)
a<-table.row.end(a)
a<-table.row.start(a)
a<-table.element(a, 'F-TEST (value)',1,TRUE)
a<-table.element(a, mysum$fstatistic[1])
a<-table.row.end(a)
a<-table.row.start(a)
a<-table.element(a, 'F-TEST (DF numerator)',1,TRUE)
a<-table.element(a, mysum$fstatistic[2])
a<-table.row.end(a)
a<-table.row.start(a)
a<-table.element(a, 'F-TEST (DF denominator)',1,TRUE)
a<-table.element(a, mysum$fstatistic[3])
a<-table.row.end(a)
a<-table.row.start(a)
a<-table.element(a, 'p-value',1,TRUE)
a<-table.element(a, 1-pf(mysum$fstatistic[1],mysum$fstatistic[2],mysum$fstatistic[3]))
a<-table.row.end(a)
a<-table.row.start(a)
a<-table.element(a, 'Multiple Linear Regression - Residual Statistics', 2, TRUE)
a<-table.row.end(a)
a<-table.row.start(a)
a<-table.element(a, 'Residual Standard Deviation',1,TRUE)
a<-table.element(a, mysum$sigma)
a<-table.row.end(a)
a<-table.row.start(a)
a<-table.element(a, 'Sum Squared Residuals',1,TRUE)
a<-table.element(a, sum(myerror*myerror))
a<-table.row.end(a)
a<-table.end(a)
table.save(a,file='mytable3.tab')
a<-table.start()
a<-table.row.start(a)
a<-table.element(a, 'Multiple Linear Regression - Actuals, Interpolation, and Residuals', 4, TRUE)
a<-table.row.end(a)
a<-table.row.start(a)
a<-table.element(a, 'Time or Index', 1, TRUE)
a<-table.element(a, 'Actuals', 1, TRUE)
a<-table.element(a, 'Interpolation
Forecast', 1, TRUE)
a<-table.element(a, 'Residuals
Prediction Error', 1, TRUE)
a<-table.row.end(a)
for (i in 1:n) {
a<-table.row.start(a)
a<-table.element(a,i, 1, TRUE)
a<-table.element(a,x[i])
a<-table.element(a,x[i]-mysum$resid[i])
a<-table.element(a,mysum$resid[i])
a<-table.row.end(a)
}
a<-table.end(a)
table.save(a,file='mytable4.tab')
if (n > n25) {
a<-table.start()
a<-table.row.start(a)
a<-table.element(a,'Goldfeld-Quandt test for Heteroskedasticity',4,TRUE)
a<-table.row.end(a)
a<-table.row.start(a)
a<-table.element(a,'p-values',header=TRUE)
a<-table.element(a,'Alternative Hypothesis',3,header=TRUE)
a<-table.row.end(a)
a<-table.row.start(a)
a<-table.element(a,'breakpoint index',header=TRUE)
a<-table.element(a,'greater',header=TRUE)
a<-table.element(a,'2-sided',header=TRUE)
a<-table.element(a,'less',header=TRUE)
a<-table.row.end(a)
for (mypoint in kp3:nmkm3) {
a<-table.row.start(a)
a<-table.element(a,mypoint,header=TRUE)
a<-table.element(a,gqarr[mypoint-kp3+1,1])
a<-table.element(a,gqarr[mypoint-kp3+1,2])
a<-table.element(a,gqarr[mypoint-kp3+1,3])
a<-table.row.end(a)
}
a<-table.end(a)
table.save(a,file='mytable5.tab')
a<-table.start()
a<-table.row.start(a)
a<-table.element(a,'Meta Analysis of Goldfeld-Quandt test for Heteroskedasticity',4,TRUE)
a<-table.row.end(a)
a<-table.row.start(a)
a<-table.element(a,'Description',header=TRUE)
a<-table.element(a,'# significant tests',header=TRUE)
a<-table.element(a,'% significant tests',header=TRUE)
a<-table.element(a,'OK/NOK',header=TRUE)
a<-table.row.end(a)
a<-table.row.start(a)
a<-table.element(a,'1% type I error level',header=TRUE)
a<-table.element(a,numsignificant1)
a<-table.element(a,numsignificant1/numgqtests)
if (numsignificant1/numgqtests < 0.01) dum <- 'OK' else dum <- 'NOK'
a<-table.element(a,dum)
a<-table.row.end(a)
a<-table.row.start(a)
a<-table.element(a,'5% type I error level',header=TRUE)
a<-table.element(a,numsignificant5)
a<-table.element(a,numsignificant5/numgqtests)
if (numsignificant5/numgqtests < 0.05) dum <- 'OK' else dum <- 'NOK'
a<-table.element(a,dum)
a<-table.row.end(a)
a<-table.row.start(a)
a<-table.element(a,'10% type I error level',header=TRUE)
a<-table.element(a,numsignificant10)
a<-table.element(a,numsignificant10/numgqtests)
if (numsignificant10/numgqtests < 0.1) dum <- 'OK' else dum <- 'NOK'
a<-table.element(a,dum)
a<-table.row.end(a)
a<-table.end(a)
table.save(a,file='mytable6.tab')
}