Free Statistics

of Irreproducible Research!

Author's title

Author*Unverified author*
R Software Modulerwasp_autocorrelation.wasp
Title produced by software(Partial) Autocorrelation Function
Date of computationWed, 23 Nov 2011 13:24:24 -0500
Cite this page as followsStatistical Computations at FreeStatistics.org, Office for Research Development and Education, URL https://freestatistics.org/blog/index.php?v=date/2011/Nov/23/t132207362389yl4d1ovizx1fj.htm/, Retrieved Thu, 25 Apr 2024 00:39:43 +0000
Statistical Computations at FreeStatistics.org, Office for Research Development and Education, URL https://freestatistics.org/blog/index.php?pk=146566, Retrieved Thu, 25 Apr 2024 00:39:43 +0000
QR Codes:

Original text written by user:
IsPrivate?No (this computation is public)
User-defined keywordsKDGP2W11
Estimated Impact91
Family? (F = Feedback message, R = changed R code, M = changed R Module, P = changed Parameters, D = changed Data)
-       [(Partial) Autocorrelation Function] [autocorolatie NSD] [2011-11-23 18:24:24] [3a5148fa0f21767f499340b81dfb0928] [Current]
Feedback Forum

Post a new message
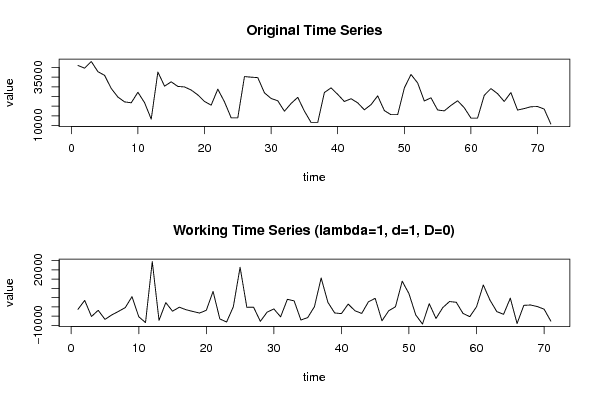
Dataseries X:
41086
39690
43129
37863
35953
29133
24693
22205
21725
27192
21790
13253
37702
30364
32609
30212
29965
28352
25814
22414
20506
28806
22228
13971
13971
35338
35022
34777
26887
23970
22780
17351
21382
24561
17409
11514
11514
27071
29462
26105
22397
23843
21705
18089
20764
25316
17704
15548
15548
29383
36438
32034
22679
24319
18004
17537
20366
22782
19169
13807
13807
25591
29096
26482
22405
27044
17970
18730
19684
19785
18479
10698


Summary of computational transaction
Raw Inputview raw input (R code)
Raw Outputview raw output of R engine
Computing time1 seconds
R Server'Gertrude Mary Cox' @ cox.wessa.net

\begin{tabular}{lllllllll}
\hline
Summary of computational transaction \tabularnewline
Raw Input & view raw input (R code)  \tabularnewline
Raw Output & view raw output of R engine  \tabularnewline
Computing time & 1 seconds \tabularnewline
R Server & 'Gertrude Mary Cox' @ cox.wessa.net \tabularnewline
\hline
\end{tabular}
%Source: https://freestatistics.org/blog/index.php?pk=146566&T=0

[TABLE]
[ROW][C]Summary of computational transaction[/C][/ROW]
[ROW][C]Raw Input[/C][C]view raw input (R code) [/C][/ROW]
[ROW][C]Raw Output[/C][C]view raw output of R engine [/C][/ROW]
[ROW][C]Computing time[/C][C]1 seconds[/C][/ROW]
[ROW][C]R Server[/C][C]'Gertrude Mary Cox' @ cox.wessa.net[/C][/ROW]
[/TABLE]
Source: https://freestatistics.org/blog/index.php?pk=146566&T=0

Globally Unique Identifier (entire table): ba.freestatistics.org/blog/index.php?pk=146566&T=0

As an alternative you can also use a QR Code:  

The GUIDs for individual cells are displayed in the table below:

Summary of computational transaction
Raw Inputview raw input (R code)
Raw Outputview raw output of R engine
Computing time1 seconds
R Server'Gertrude Mary Cox' @ cox.wessa.net


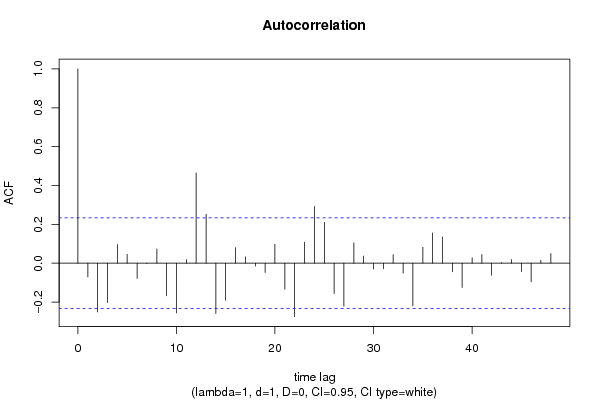
Autocorrelation Function
Time lag kACF(k)T-STATP-value
1-0.070567-0.59460.276997
2-0.250892-2.11410.019012
3-0.202801-1.70880.045925
40.0958390.80760.211023
50.0452950.38170.351925
6-0.078317-0.65990.255723
7-0.001438-0.01210.495182
80.0733980.61850.269124
9-0.168156-1.41690.080441
10-0.256124-2.15810.01715
110.0184410.15540.438478
120.4641813.91130.000104
130.2514412.11870.018809
14-0.258946-2.18190.016213
15-0.190565-1.60570.056386
160.0799590.67370.251331
170.0324580.27350.392634
18-0.014917-0.12570.450164
19-0.047668-0.40170.344572
200.0966750.81460.209012
21-0.134357-1.13210.130697
22-0.27539-2.32050.011596
230.1081890.91160.182528
240.2918062.45880.00819
250.2102731.77180.04036
26-0.15653-1.31890.095713
27-0.221431-1.86580.033099
280.1045440.88090.19067
290.0362650.30560.38041
30-0.029749-0.25070.401396
31-0.028378-0.23910.405853
320.042980.36220.359156
33-0.051164-0.43110.333845
34-0.219749-1.85160.034118
350.0814080.6860.247486
360.1552171.30790.097567
370.1344981.13330.13045
38-0.044659-0.37630.353907
39-0.1251-1.05410.147702
400.0276360.23290.408267
410.0440240.3710.355888
42-0.062606-0.52750.299736
430.0027430.02310.490812
440.0186450.15710.437803
45-0.042952-0.36190.359242
46-0.095446-0.80420.211971
470.0153130.1290.448849
480.0492820.41530.339602

\begin{tabular}{lllllllll}
\hline
Autocorrelation Function \tabularnewline
Time lag k & ACF(k) & T-STAT & P-value \tabularnewline
1 & -0.070567 & -0.5946 & 0.276997 \tabularnewline
2 & -0.250892 & -2.1141 & 0.019012 \tabularnewline
3 & -0.202801 & -1.7088 & 0.045925 \tabularnewline
4 & 0.095839 & 0.8076 & 0.211023 \tabularnewline
5 & 0.045295 & 0.3817 & 0.351925 \tabularnewline
6 & -0.078317 & -0.6599 & 0.255723 \tabularnewline
7 & -0.001438 & -0.0121 & 0.495182 \tabularnewline
8 & 0.073398 & 0.6185 & 0.269124 \tabularnewline
9 & -0.168156 & -1.4169 & 0.080441 \tabularnewline
10 & -0.256124 & -2.1581 & 0.01715 \tabularnewline
11 & 0.018441 & 0.1554 & 0.438478 \tabularnewline
12 & 0.464181 & 3.9113 & 0.000104 \tabularnewline
13 & 0.251441 & 2.1187 & 0.018809 \tabularnewline
14 & -0.258946 & -2.1819 & 0.016213 \tabularnewline
15 & -0.190565 & -1.6057 & 0.056386 \tabularnewline
16 & 0.079959 & 0.6737 & 0.251331 \tabularnewline
17 & 0.032458 & 0.2735 & 0.392634 \tabularnewline
18 & -0.014917 & -0.1257 & 0.450164 \tabularnewline
19 & -0.047668 & -0.4017 & 0.344572 \tabularnewline
20 & 0.096675 & 0.8146 & 0.209012 \tabularnewline
21 & -0.134357 & -1.1321 & 0.130697 \tabularnewline
22 & -0.27539 & -2.3205 & 0.011596 \tabularnewline
23 & 0.108189 & 0.9116 & 0.182528 \tabularnewline
24 & 0.291806 & 2.4588 & 0.00819 \tabularnewline
25 & 0.210273 & 1.7718 & 0.04036 \tabularnewline
26 & -0.15653 & -1.3189 & 0.095713 \tabularnewline
27 & -0.221431 & -1.8658 & 0.033099 \tabularnewline
28 & 0.104544 & 0.8809 & 0.19067 \tabularnewline
29 & 0.036265 & 0.3056 & 0.38041 \tabularnewline
30 & -0.029749 & -0.2507 & 0.401396 \tabularnewline
31 & -0.028378 & -0.2391 & 0.405853 \tabularnewline
32 & 0.04298 & 0.3622 & 0.359156 \tabularnewline
33 & -0.051164 & -0.4311 & 0.333845 \tabularnewline
34 & -0.219749 & -1.8516 & 0.034118 \tabularnewline
35 & 0.081408 & 0.686 & 0.247486 \tabularnewline
36 & 0.155217 & 1.3079 & 0.097567 \tabularnewline
37 & 0.134498 & 1.1333 & 0.13045 \tabularnewline
38 & -0.044659 & -0.3763 & 0.353907 \tabularnewline
39 & -0.1251 & -1.0541 & 0.147702 \tabularnewline
40 & 0.027636 & 0.2329 & 0.408267 \tabularnewline
41 & 0.044024 & 0.371 & 0.355888 \tabularnewline
42 & -0.062606 & -0.5275 & 0.299736 \tabularnewline
43 & 0.002743 & 0.0231 & 0.490812 \tabularnewline
44 & 0.018645 & 0.1571 & 0.437803 \tabularnewline
45 & -0.042952 & -0.3619 & 0.359242 \tabularnewline
46 & -0.095446 & -0.8042 & 0.211971 \tabularnewline
47 & 0.015313 & 0.129 & 0.448849 \tabularnewline
48 & 0.049282 & 0.4153 & 0.339602 \tabularnewline
\hline
\end{tabular}
%Source: https://freestatistics.org/blog/index.php?pk=146566&T=1

[TABLE]
[ROW][C]Autocorrelation Function[/C][/ROW]
[ROW][C]Time lag k[/C][C]ACF(k)[/C][C]T-STAT[/C][C]P-value[/C][/ROW]
[ROW][C]1[/C][C]-0.070567[/C][C]-0.5946[/C][C]0.276997[/C][/ROW]
[ROW][C]2[/C][C]-0.250892[/C][C]-2.1141[/C][C]0.019012[/C][/ROW]
[ROW][C]3[/C][C]-0.202801[/C][C]-1.7088[/C][C]0.045925[/C][/ROW]
[ROW][C]4[/C][C]0.095839[/C][C]0.8076[/C][C]0.211023[/C][/ROW]
[ROW][C]5[/C][C]0.045295[/C][C]0.3817[/C][C]0.351925[/C][/ROW]
[ROW][C]6[/C][C]-0.078317[/C][C]-0.6599[/C][C]0.255723[/C][/ROW]
[ROW][C]7[/C][C]-0.001438[/C][C]-0.0121[/C][C]0.495182[/C][/ROW]
[ROW][C]8[/C][C]0.073398[/C][C]0.6185[/C][C]0.269124[/C][/ROW]
[ROW][C]9[/C][C]-0.168156[/C][C]-1.4169[/C][C]0.080441[/C][/ROW]
[ROW][C]10[/C][C]-0.256124[/C][C]-2.1581[/C][C]0.01715[/C][/ROW]
[ROW][C]11[/C][C]0.018441[/C][C]0.1554[/C][C]0.438478[/C][/ROW]
[ROW][C]12[/C][C]0.464181[/C][C]3.9113[/C][C]0.000104[/C][/ROW]
[ROW][C]13[/C][C]0.251441[/C][C]2.1187[/C][C]0.018809[/C][/ROW]
[ROW][C]14[/C][C]-0.258946[/C][C]-2.1819[/C][C]0.016213[/C][/ROW]
[ROW][C]15[/C][C]-0.190565[/C][C]-1.6057[/C][C]0.056386[/C][/ROW]
[ROW][C]16[/C][C]0.079959[/C][C]0.6737[/C][C]0.251331[/C][/ROW]
[ROW][C]17[/C][C]0.032458[/C][C]0.2735[/C][C]0.392634[/C][/ROW]
[ROW][C]18[/C][C]-0.014917[/C][C]-0.1257[/C][C]0.450164[/C][/ROW]
[ROW][C]19[/C][C]-0.047668[/C][C]-0.4017[/C][C]0.344572[/C][/ROW]
[ROW][C]20[/C][C]0.096675[/C][C]0.8146[/C][C]0.209012[/C][/ROW]
[ROW][C]21[/C][C]-0.134357[/C][C]-1.1321[/C][C]0.130697[/C][/ROW]
[ROW][C]22[/C][C]-0.27539[/C][C]-2.3205[/C][C]0.011596[/C][/ROW]
[ROW][C]23[/C][C]0.108189[/C][C]0.9116[/C][C]0.182528[/C][/ROW]
[ROW][C]24[/C][C]0.291806[/C][C]2.4588[/C][C]0.00819[/C][/ROW]
[ROW][C]25[/C][C]0.210273[/C][C]1.7718[/C][C]0.04036[/C][/ROW]
[ROW][C]26[/C][C]-0.15653[/C][C]-1.3189[/C][C]0.095713[/C][/ROW]
[ROW][C]27[/C][C]-0.221431[/C][C]-1.8658[/C][C]0.033099[/C][/ROW]
[ROW][C]28[/C][C]0.104544[/C][C]0.8809[/C][C]0.19067[/C][/ROW]
[ROW][C]29[/C][C]0.036265[/C][C]0.3056[/C][C]0.38041[/C][/ROW]
[ROW][C]30[/C][C]-0.029749[/C][C]-0.2507[/C][C]0.401396[/C][/ROW]
[ROW][C]31[/C][C]-0.028378[/C][C]-0.2391[/C][C]0.405853[/C][/ROW]
[ROW][C]32[/C][C]0.04298[/C][C]0.3622[/C][C]0.359156[/C][/ROW]
[ROW][C]33[/C][C]-0.051164[/C][C]-0.4311[/C][C]0.333845[/C][/ROW]
[ROW][C]34[/C][C]-0.219749[/C][C]-1.8516[/C][C]0.034118[/C][/ROW]
[ROW][C]35[/C][C]0.081408[/C][C]0.686[/C][C]0.247486[/C][/ROW]
[ROW][C]36[/C][C]0.155217[/C][C]1.3079[/C][C]0.097567[/C][/ROW]
[ROW][C]37[/C][C]0.134498[/C][C]1.1333[/C][C]0.13045[/C][/ROW]
[ROW][C]38[/C][C]-0.044659[/C][C]-0.3763[/C][C]0.353907[/C][/ROW]
[ROW][C]39[/C][C]-0.1251[/C][C]-1.0541[/C][C]0.147702[/C][/ROW]
[ROW][C]40[/C][C]0.027636[/C][C]0.2329[/C][C]0.408267[/C][/ROW]
[ROW][C]41[/C][C]0.044024[/C][C]0.371[/C][C]0.355888[/C][/ROW]
[ROW][C]42[/C][C]-0.062606[/C][C]-0.5275[/C][C]0.299736[/C][/ROW]
[ROW][C]43[/C][C]0.002743[/C][C]0.0231[/C][C]0.490812[/C][/ROW]
[ROW][C]44[/C][C]0.018645[/C][C]0.1571[/C][C]0.437803[/C][/ROW]
[ROW][C]45[/C][C]-0.042952[/C][C]-0.3619[/C][C]0.359242[/C][/ROW]
[ROW][C]46[/C][C]-0.095446[/C][C]-0.8042[/C][C]0.211971[/C][/ROW]
[ROW][C]47[/C][C]0.015313[/C][C]0.129[/C][C]0.448849[/C][/ROW]
[ROW][C]48[/C][C]0.049282[/C][C]0.4153[/C][C]0.339602[/C][/ROW]
[/TABLE]
Source: https://freestatistics.org/blog/index.php?pk=146566&T=1

Globally Unique Identifier (entire table): ba.freestatistics.org/blog/index.php?pk=146566&T=1

As an alternative you can also use a QR Code:  

The GUIDs for individual cells are displayed in the table below:

Autocorrelation Function
Time lag kACF(k)T-STATP-value
1-0.070567-0.59460.276997
2-0.250892-2.11410.019012
3-0.202801-1.70880.045925
40.0958390.80760.211023
50.0452950.38170.351925
6-0.078317-0.65990.255723
7-0.001438-0.01210.495182
80.0733980.61850.269124
9-0.168156-1.41690.080441
10-0.256124-2.15810.01715
110.0184410.15540.438478
120.4641813.91130.000104
130.2514412.11870.018809
14-0.258946-2.18190.016213
15-0.190565-1.60570.056386
160.0799590.67370.251331
170.0324580.27350.392634
18-0.014917-0.12570.450164
19-0.047668-0.40170.344572
200.0966750.81460.209012
21-0.134357-1.13210.130697
22-0.27539-2.32050.011596
230.1081890.91160.182528
240.2918062.45880.00819
250.2102731.77180.04036
26-0.15653-1.31890.095713
27-0.221431-1.86580.033099
280.1045440.88090.19067
290.0362650.30560.38041
30-0.029749-0.25070.401396
31-0.028378-0.23910.405853
320.042980.36220.359156
33-0.051164-0.43110.333845
34-0.219749-1.85160.034118
350.0814080.6860.247486
360.1552171.30790.097567
370.1344981.13330.13045
38-0.044659-0.37630.353907
39-0.1251-1.05410.147702
400.0276360.23290.408267
410.0440240.3710.355888
42-0.062606-0.52750.299736
430.0027430.02310.490812
440.0186450.15710.437803
45-0.042952-0.36190.359242
46-0.095446-0.80420.211971
470.0153130.1290.448849
480.0492820.41530.339602


Partial Autocorrelation Function
Time lag kPACF(k)T-STATP-value
1-0.070567-0.59460.276997
2-0.257153-2.16680.016803
3-0.26173-2.20540.015334
4-0.028437-0.23960.405659
5-0.07666-0.6460.260197
6-0.134189-1.13070.130993
7-0.024444-0.2060.418703
80.0163790.1380.44531
9-0.2355-1.98440.025541
10-0.361701-3.04770.001619
11-0.2658-2.23970.014123
120.1855621.56360.061182
130.3186872.68530.004507
140.040760.34350.366137
15-0.00481-0.04050.483891
160.0373060.31430.37709
17-0.099155-0.83550.203122
18-0.032779-0.27620.391597
19-0.073665-0.62070.268388
200.0262590.22130.412762
21-0.031524-0.26560.395648
22-0.120067-1.01170.157558
230.1362931.14840.127323
240.0630590.53130.29842
250.021610.18210.428017
26-0.006719-0.05660.477504
27-0.103402-0.87130.193268
280.0320750.27030.393869
29-0.03501-0.2950.384428
30-0.020656-0.17410.43116
31-0.024663-0.20780.417985
32-0.035022-0.29510.38439
330.0288770.24330.404228
340.0157920.13310.44726
350.1352191.13940.129188
36-0.159648-1.34520.091418
37-0.147593-1.24360.108861
380.0014480.01220.49515
390.0268330.22610.410887
400.070980.59810.275841
41-0.026413-0.22260.412258
42-0.051446-0.43350.332986
43-0.038384-0.32340.37366
44-0.054582-0.45990.323491
450.0045720.03850.484688
46-0.00445-0.03750.485097
470.0118180.09960.460479
48-0.206988-1.74410.042733

\begin{tabular}{lllllllll}
\hline
Partial Autocorrelation Function \tabularnewline
Time lag k & PACF(k) & T-STAT & P-value \tabularnewline
1 & -0.070567 & -0.5946 & 0.276997 \tabularnewline
2 & -0.257153 & -2.1668 & 0.016803 \tabularnewline
3 & -0.26173 & -2.2054 & 0.015334 \tabularnewline
4 & -0.028437 & -0.2396 & 0.405659 \tabularnewline
5 & -0.07666 & -0.646 & 0.260197 \tabularnewline
6 & -0.134189 & -1.1307 & 0.130993 \tabularnewline
7 & -0.024444 & -0.206 & 0.418703 \tabularnewline
8 & 0.016379 & 0.138 & 0.44531 \tabularnewline
9 & -0.2355 & -1.9844 & 0.025541 \tabularnewline
10 & -0.361701 & -3.0477 & 0.001619 \tabularnewline
11 & -0.2658 & -2.2397 & 0.014123 \tabularnewline
12 & 0.185562 & 1.5636 & 0.061182 \tabularnewline
13 & 0.318687 & 2.6853 & 0.004507 \tabularnewline
14 & 0.04076 & 0.3435 & 0.366137 \tabularnewline
15 & -0.00481 & -0.0405 & 0.483891 \tabularnewline
16 & 0.037306 & 0.3143 & 0.37709 \tabularnewline
17 & -0.099155 & -0.8355 & 0.203122 \tabularnewline
18 & -0.032779 & -0.2762 & 0.391597 \tabularnewline
19 & -0.073665 & -0.6207 & 0.268388 \tabularnewline
20 & 0.026259 & 0.2213 & 0.412762 \tabularnewline
21 & -0.031524 & -0.2656 & 0.395648 \tabularnewline
22 & -0.120067 & -1.0117 & 0.157558 \tabularnewline
23 & 0.136293 & 1.1484 & 0.127323 \tabularnewline
24 & 0.063059 & 0.5313 & 0.29842 \tabularnewline
25 & 0.02161 & 0.1821 & 0.428017 \tabularnewline
26 & -0.006719 & -0.0566 & 0.477504 \tabularnewline
27 & -0.103402 & -0.8713 & 0.193268 \tabularnewline
28 & 0.032075 & 0.2703 & 0.393869 \tabularnewline
29 & -0.03501 & -0.295 & 0.384428 \tabularnewline
30 & -0.020656 & -0.1741 & 0.43116 \tabularnewline
31 & -0.024663 & -0.2078 & 0.417985 \tabularnewline
32 & -0.035022 & -0.2951 & 0.38439 \tabularnewline
33 & 0.028877 & 0.2433 & 0.404228 \tabularnewline
34 & 0.015792 & 0.1331 & 0.44726 \tabularnewline
35 & 0.135219 & 1.1394 & 0.129188 \tabularnewline
36 & -0.159648 & -1.3452 & 0.091418 \tabularnewline
37 & -0.147593 & -1.2436 & 0.108861 \tabularnewline
38 & 0.001448 & 0.0122 & 0.49515 \tabularnewline
39 & 0.026833 & 0.2261 & 0.410887 \tabularnewline
40 & 0.07098 & 0.5981 & 0.275841 \tabularnewline
41 & -0.026413 & -0.2226 & 0.412258 \tabularnewline
42 & -0.051446 & -0.4335 & 0.332986 \tabularnewline
43 & -0.038384 & -0.3234 & 0.37366 \tabularnewline
44 & -0.054582 & -0.4599 & 0.323491 \tabularnewline
45 & 0.004572 & 0.0385 & 0.484688 \tabularnewline
46 & -0.00445 & -0.0375 & 0.485097 \tabularnewline
47 & 0.011818 & 0.0996 & 0.460479 \tabularnewline
48 & -0.206988 & -1.7441 & 0.042733 \tabularnewline
\hline
\end{tabular}
%Source: https://freestatistics.org/blog/index.php?pk=146566&T=2

[TABLE]
[ROW][C]Partial Autocorrelation Function[/C][/ROW]
[ROW][C]Time lag k[/C][C]PACF(k)[/C][C]T-STAT[/C][C]P-value[/C][/ROW]
[ROW][C]1[/C][C]-0.070567[/C][C]-0.5946[/C][C]0.276997[/C][/ROW]
[ROW][C]2[/C][C]-0.257153[/C][C]-2.1668[/C][C]0.016803[/C][/ROW]
[ROW][C]3[/C][C]-0.26173[/C][C]-2.2054[/C][C]0.015334[/C][/ROW]
[ROW][C]4[/C][C]-0.028437[/C][C]-0.2396[/C][C]0.405659[/C][/ROW]
[ROW][C]5[/C][C]-0.07666[/C][C]-0.646[/C][C]0.260197[/C][/ROW]
[ROW][C]6[/C][C]-0.134189[/C][C]-1.1307[/C][C]0.130993[/C][/ROW]
[ROW][C]7[/C][C]-0.024444[/C][C]-0.206[/C][C]0.418703[/C][/ROW]
[ROW][C]8[/C][C]0.016379[/C][C]0.138[/C][C]0.44531[/C][/ROW]
[ROW][C]9[/C][C]-0.2355[/C][C]-1.9844[/C][C]0.025541[/C][/ROW]
[ROW][C]10[/C][C]-0.361701[/C][C]-3.0477[/C][C]0.001619[/C][/ROW]
[ROW][C]11[/C][C]-0.2658[/C][C]-2.2397[/C][C]0.014123[/C][/ROW]
[ROW][C]12[/C][C]0.185562[/C][C]1.5636[/C][C]0.061182[/C][/ROW]
[ROW][C]13[/C][C]0.318687[/C][C]2.6853[/C][C]0.004507[/C][/ROW]
[ROW][C]14[/C][C]0.04076[/C][C]0.3435[/C][C]0.366137[/C][/ROW]
[ROW][C]15[/C][C]-0.00481[/C][C]-0.0405[/C][C]0.483891[/C][/ROW]
[ROW][C]16[/C][C]0.037306[/C][C]0.3143[/C][C]0.37709[/C][/ROW]
[ROW][C]17[/C][C]-0.099155[/C][C]-0.8355[/C][C]0.203122[/C][/ROW]
[ROW][C]18[/C][C]-0.032779[/C][C]-0.2762[/C][C]0.391597[/C][/ROW]
[ROW][C]19[/C][C]-0.073665[/C][C]-0.6207[/C][C]0.268388[/C][/ROW]
[ROW][C]20[/C][C]0.026259[/C][C]0.2213[/C][C]0.412762[/C][/ROW]
[ROW][C]21[/C][C]-0.031524[/C][C]-0.2656[/C][C]0.395648[/C][/ROW]
[ROW][C]22[/C][C]-0.120067[/C][C]-1.0117[/C][C]0.157558[/C][/ROW]
[ROW][C]23[/C][C]0.136293[/C][C]1.1484[/C][C]0.127323[/C][/ROW]
[ROW][C]24[/C][C]0.063059[/C][C]0.5313[/C][C]0.29842[/C][/ROW]
[ROW][C]25[/C][C]0.02161[/C][C]0.1821[/C][C]0.428017[/C][/ROW]
[ROW][C]26[/C][C]-0.006719[/C][C]-0.0566[/C][C]0.477504[/C][/ROW]
[ROW][C]27[/C][C]-0.103402[/C][C]-0.8713[/C][C]0.193268[/C][/ROW]
[ROW][C]28[/C][C]0.032075[/C][C]0.2703[/C][C]0.393869[/C][/ROW]
[ROW][C]29[/C][C]-0.03501[/C][C]-0.295[/C][C]0.384428[/C][/ROW]
[ROW][C]30[/C][C]-0.020656[/C][C]-0.1741[/C][C]0.43116[/C][/ROW]
[ROW][C]31[/C][C]-0.024663[/C][C]-0.2078[/C][C]0.417985[/C][/ROW]
[ROW][C]32[/C][C]-0.035022[/C][C]-0.2951[/C][C]0.38439[/C][/ROW]
[ROW][C]33[/C][C]0.028877[/C][C]0.2433[/C][C]0.404228[/C][/ROW]
[ROW][C]34[/C][C]0.015792[/C][C]0.1331[/C][C]0.44726[/C][/ROW]
[ROW][C]35[/C][C]0.135219[/C][C]1.1394[/C][C]0.129188[/C][/ROW]
[ROW][C]36[/C][C]-0.159648[/C][C]-1.3452[/C][C]0.091418[/C][/ROW]
[ROW][C]37[/C][C]-0.147593[/C][C]-1.2436[/C][C]0.108861[/C][/ROW]
[ROW][C]38[/C][C]0.001448[/C][C]0.0122[/C][C]0.49515[/C][/ROW]
[ROW][C]39[/C][C]0.026833[/C][C]0.2261[/C][C]0.410887[/C][/ROW]
[ROW][C]40[/C][C]0.07098[/C][C]0.5981[/C][C]0.275841[/C][/ROW]
[ROW][C]41[/C][C]-0.026413[/C][C]-0.2226[/C][C]0.412258[/C][/ROW]
[ROW][C]42[/C][C]-0.051446[/C][C]-0.4335[/C][C]0.332986[/C][/ROW]
[ROW][C]43[/C][C]-0.038384[/C][C]-0.3234[/C][C]0.37366[/C][/ROW]
[ROW][C]44[/C][C]-0.054582[/C][C]-0.4599[/C][C]0.323491[/C][/ROW]
[ROW][C]45[/C][C]0.004572[/C][C]0.0385[/C][C]0.484688[/C][/ROW]
[ROW][C]46[/C][C]-0.00445[/C][C]-0.0375[/C][C]0.485097[/C][/ROW]
[ROW][C]47[/C][C]0.011818[/C][C]0.0996[/C][C]0.460479[/C][/ROW]
[ROW][C]48[/C][C]-0.206988[/C][C]-1.7441[/C][C]0.042733[/C][/ROW]
[/TABLE]
Source: https://freestatistics.org/blog/index.php?pk=146566&T=2

Globally Unique Identifier (entire table): ba.freestatistics.org/blog/index.php?pk=146566&T=2

As an alternative you can also use a QR Code:  

The GUIDs for individual cells are displayed in the table below:

Partial Autocorrelation Function
Time lag kPACF(k)T-STATP-value
1-0.070567-0.59460.276997
2-0.257153-2.16680.016803
3-0.26173-2.20540.015334
4-0.028437-0.23960.405659
5-0.07666-0.6460.260197
6-0.134189-1.13070.130993
7-0.024444-0.2060.418703
80.0163790.1380.44531
9-0.2355-1.98440.025541
10-0.361701-3.04770.001619
11-0.2658-2.23970.014123
120.1855621.56360.061182
130.3186872.68530.004507
140.040760.34350.366137
15-0.00481-0.04050.483891
160.0373060.31430.37709
17-0.099155-0.83550.203122
18-0.032779-0.27620.391597
19-0.073665-0.62070.268388
200.0262590.22130.412762
21-0.031524-0.26560.395648
22-0.120067-1.01170.157558
230.1362931.14840.127323
240.0630590.53130.29842
250.021610.18210.428017
26-0.006719-0.05660.477504
27-0.103402-0.87130.193268
280.0320750.27030.393869
29-0.03501-0.2950.384428
30-0.020656-0.17410.43116
31-0.024663-0.20780.417985
32-0.035022-0.29510.38439
330.0288770.24330.404228
340.0157920.13310.44726
350.1352191.13940.129188
36-0.159648-1.34520.091418
37-0.147593-1.24360.108861
380.0014480.01220.49515
390.0268330.22610.410887
400.070980.59810.275841
41-0.026413-0.22260.412258
42-0.051446-0.43350.332986
43-0.038384-0.32340.37366
44-0.054582-0.45990.323491
450.0045720.03850.484688
46-0.00445-0.03750.485097
470.0118180.09960.460479
48-0.206988-1.74410.042733


Parameters (Session):
par1 = 48 ; par2 = 1 ; par3 = 1 ; par4 = 0 ; par5 = 12 ; par6 = White Noise ; par7 = 0.95 ;
Parameters (R input):
par1 = 48 ; par2 = 1 ; par3 = 1 ; par4 = 0 ; par5 = 12 ; par6 = White Noise ; par7 = 0.95 ; par8 = ;
R code (references can be found in the software module):
if (par1 == 'Default') {
par1 = 10*log10(length(x))
} else {
par1 <- as.numeric(par1)
}
par2 <- as.numeric(par2)
par3 <- as.numeric(par3)
par4 <- as.numeric(par4)
par5 <- as.numeric(par5)
if (par6 == 'White Noise') par6 <- 'white' else par6 <- 'ma'
par7 <- as.numeric(par7)
if (par8 != '') par8 <- as.numeric(par8)
ox <- x
if (par8 == '') {
if (par2 == 0) {
x <- log(x)
} else {
x <- (x ^ par2 - 1) / par2
}
} else {
x <- log(x,base=par8)
}
if (par3 > 0) x <- diff(x,lag=1,difference=par3)
if (par4 > 0) x <- diff(x,lag=par5,difference=par4)
bitmap(file='picts.png')
op <- par(mfrow=c(2,1))
plot(ox,type='l',main='Original Time Series',xlab='time',ylab='value')
if (par8=='') {
mytitle <- paste('Working Time Series (lambda=',par2,', d=',par3,', D=',par4,')',sep='')
mysub <- paste('(lambda=',par2,', d=',par3,', D=',par4,', CI=', par7, ', CI type=',par6,')',sep='')
} else {
mytitle <- paste('Working Time Series (base=',par8,', d=',par3,', D=',par4,')',sep='')
mysub <- paste('(base=',par8,', d=',par3,', D=',par4,', CI=', par7, ', CI type=',par6,')',sep='')
}
plot(x,type='l', main=mytitle,xlab='time',ylab='value')
par(op)
dev.off()
bitmap(file='pic1.png')
racf <- acf(x, par1, main='Autocorrelation', xlab='time lag', ylab='ACF', ci.type=par6, ci=par7, sub=mysub)
dev.off()
bitmap(file='pic2.png')
rpacf <- pacf(x,par1,main='Partial Autocorrelation',xlab='lags',ylab='PACF',sub=mysub)
dev.off()
(myacf <- c(racf$acf))
(mypacf <- c(rpacf$acf))
lengthx <- length(x)
sqrtn <- sqrt(lengthx)
load(file='createtable')
a<-table.start()
a<-table.row.start(a)
a<-table.element(a,'Autocorrelation Function',4,TRUE)
a<-table.row.end(a)
a<-table.row.start(a)
a<-table.element(a,'Time lag k',header=TRUE)
a<-table.element(a,hyperlink('basics.htm','ACF(k)','click here for more information about the Autocorrelation Function'),header=TRUE)
a<-table.element(a,'T-STAT',header=TRUE)
a<-table.element(a,'P-value',header=TRUE)
a<-table.row.end(a)
for (i in 2:(par1+1)) {
a<-table.row.start(a)
a<-table.element(a,i-1,header=TRUE)
a<-table.element(a,round(myacf[i],6))
mytstat <- myacf[i]*sqrtn
a<-table.element(a,round(mytstat,4))
a<-table.element(a,round(1-pt(abs(mytstat),lengthx),6))
a<-table.row.end(a)
}
a<-table.end(a)
table.save(a,file='mytable.tab')
a<-table.start()
a<-table.row.start(a)
a<-table.element(a,'Partial Autocorrelation Function',4,TRUE)
a<-table.row.end(a)
a<-table.row.start(a)
a<-table.element(a,'Time lag k',header=TRUE)
a<-table.element(a,hyperlink('basics.htm','PACF(k)','click here for more information about the Partial Autocorrelation Function'),header=TRUE)
a<-table.element(a,'T-STAT',header=TRUE)
a<-table.element(a,'P-value',header=TRUE)
a<-table.row.end(a)
for (i in 1:par1) {
a<-table.row.start(a)
a<-table.element(a,i,header=TRUE)
a<-table.element(a,round(mypacf[i],6))
mytstat <- mypacf[i]*sqrtn
a<-table.element(a,round(mytstat,4))
a<-table.element(a,round(1-pt(abs(mytstat),lengthx),6))
a<-table.row.end(a)
}
a<-table.end(a)
table.save(a,file='mytable1.tab')