Free Statistics

of Irreproducible Research!

Author's title

Author*The author of this computation has been verified*
R Software Modulerwasp_edauni.wasp
Title produced by softwareUnivariate Explorative Data Analysis
Date of computationWed, 23 Nov 2011 10:41:05 -0500
Cite this page as followsStatistical Computations at FreeStatistics.org, Office for Research Development and Education, URL https://freestatistics.org/blog/index.php?v=date/2011/Nov/23/t13220629042cygmenrdc9f5hj.htm/, Retrieved Fri, 19 Apr 2024 20:52:40 +0000
Statistical Computations at FreeStatistics.org, Office for Research Development and Education, URL https://freestatistics.org/blog/index.php?pk=146537, Retrieved Fri, 19 Apr 2024 20:52:40 +0000
QR Codes:

Original text written by user:
IsPrivate?No (this computation is public)
User-defined keywords
Estimated Impact89
Family? (F = Feedback message, R = changed R code, M = changed R Module, P = changed Parameters, D = changed Data)
-       [Univariate Explorative Data Analysis] [] [2011-11-23 15:41:05] [bd7a66e2f212a6bc9afe853e3942ee45] [Current]
Feedback Forum

Post a new message
Dataseries X:
58198
65968
7176
78306
127587
250877
65878
72513
72507
168544
66288
94815
45496
78277
66960
72377
61175
15580
71693
13397
38921
97709
47899
61674
77395
65152
85842
75108
182314
91493
56374
104756
50485
29013
90349
0
61484
65245
35361
106880
82577
53655
40064
58619
55561
31331
31350
93341
57002
60206
33820
49791
108716
87699
89612
62529
64319
25090
59080
19608
31969
29728
27697
42406
47859
55240
64606
61854
35185
12207
112537
43601
46737
40699
46357
17667
59058
54106
23795
34323
37071
78258
32392
55020
29613
56879
100802
24612
37664
53398
54198
66038
61352
48096
25189
118291
71853
19349
67369
51588
19719
25497
55049
24912
28591
24716
52452
17850
0
35269
27554
55167
42982
40920
3058
0
96347
37559
62694
36901
43410
78320
37972
34563
39841
16145
45310
57938
48187
11796
7627
62522
6836
28834
5118
20825
0
34363
12137
7131
4194
21416
19205
38232


Summary of computational transaction
Raw Inputview raw input (R code)
Raw Outputview raw output of R engine
Computing time2 seconds
R Server'Gertrude Mary Cox' @ cox.wessa.net

\begin{tabular}{lllllllll}
\hline
Summary of computational transaction \tabularnewline
Raw Input & view raw input (R code)  \tabularnewline
Raw Output & view raw output of R engine  \tabularnewline
Computing time & 2 seconds \tabularnewline
R Server & 'Gertrude Mary Cox' @ cox.wessa.net \tabularnewline
\hline
\end{tabular}
%Source: https://freestatistics.org/blog/index.php?pk=146537&T=0

[TABLE]
[ROW][C]Summary of computational transaction[/C][/ROW]
[ROW][C]Raw Input[/C][C]view raw input (R code) [/C][/ROW]
[ROW][C]Raw Output[/C][C]view raw output of R engine [/C][/ROW]
[ROW][C]Computing time[/C][C]2 seconds[/C][/ROW]
[ROW][C]R Server[/C][C]'Gertrude Mary Cox' @ cox.wessa.net[/C][/ROW]
[/TABLE]
Source: https://freestatistics.org/blog/index.php?pk=146537&T=0

Globally Unique Identifier (entire table): ba.freestatistics.org/blog/index.php?pk=146537&T=0

As an alternative you can also use a QR Code:  

The GUIDs for individual cells are displayed in the table below:

Summary of computational transaction
Raw Inputview raw input (R code)
Raw Outputview raw output of R engine
Computing time2 seconds
R Server'Gertrude Mary Cox' @ cox.wessa.net


Descriptive Statistics
# observations144
minimum0
Q128968.25
median48141.5
mean51992.0694444444
Q365900.5
maximum250877

\begin{tabular}{lllllllll}
\hline
Descriptive Statistics \tabularnewline
# observations & 144 \tabularnewline
minimum & 0 \tabularnewline
Q1 & 28968.25 \tabularnewline
median & 48141.5 \tabularnewline
mean & 51992.0694444444 \tabularnewline
Q3 & 65900.5 \tabularnewline
maximum & 250877 \tabularnewline
\hline
\end{tabular}
%Source: https://freestatistics.org/blog/index.php?pk=146537&T=1

[TABLE]
[ROW][C]Descriptive Statistics[/C][/ROW]
[ROW][C]# observations[/C][C]144[/C][/ROW]
[ROW][C]minimum[/C][C]0[/C][/ROW]
[ROW][C]Q1[/C][C]28968.25[/C][/ROW]
[ROW][C]median[/C][C]48141.5[/C][/ROW]
[ROW][C]mean[/C][C]51992.0694444444[/C][/ROW]
[ROW][C]Q3[/C][C]65900.5[/C][/ROW]
[ROW][C]maximum[/C][C]250877[/C][/ROW]
[/TABLE]
Source: https://freestatistics.org/blog/index.php?pk=146537&T=1

Globally Unique Identifier (entire table): ba.freestatistics.org/blog/index.php?pk=146537&T=1

As an alternative you can also use a QR Code:  

The GUIDs for individual cells are displayed in the table below:

Descriptive Statistics
# observations144
minimum0
Q128968.25
median48141.5
mean51992.0694444444
Q365900.5
maximum250877


Parameters (Session):
par1 = 0 ; par2 = 0 ;
Parameters (R input):
par1 = 0 ; par2 = 0 ;
R code (references can be found in the software module):
par1 <- as.numeric(par1)
par2 <- as.numeric(par2)
x <- as.ts(x)
library(lattice)
bitmap(file='pic1.png')
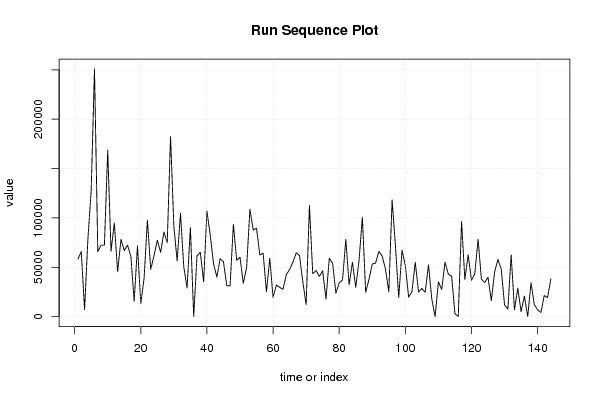
plot(x,type='l',main='Run Sequence Plot',xlab='time or index',ylab='value')
grid()
dev.off()
bitmap(file='pic2.png')
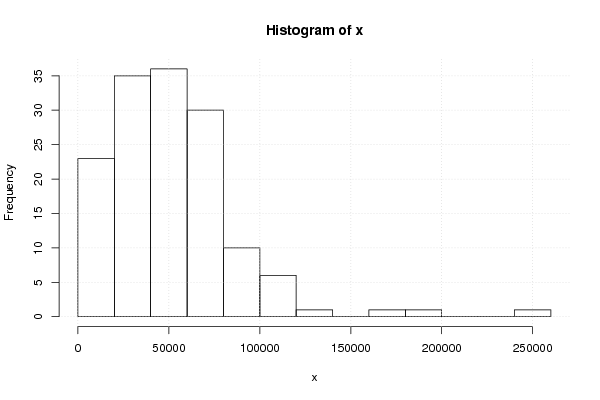
hist(x)
grid()
dev.off()
bitmap(file='pic3.png')
if (par1 > 0)
{
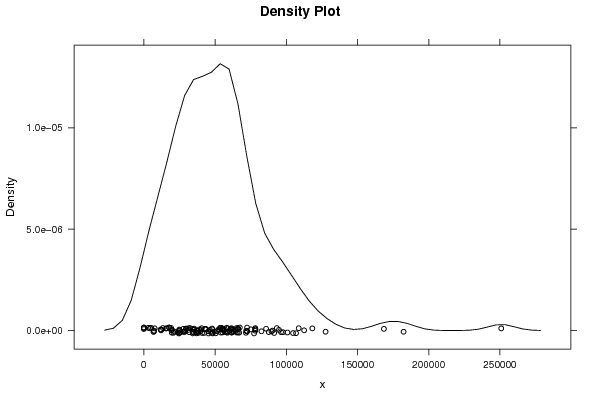
densityplot(~x,col='black',main=paste('Density Plot bw = ',par1),bw=par1)
} else {
densityplot(~x,col='black',main='Density Plot')
}
dev.off()
bitmap(file='pic4.png')
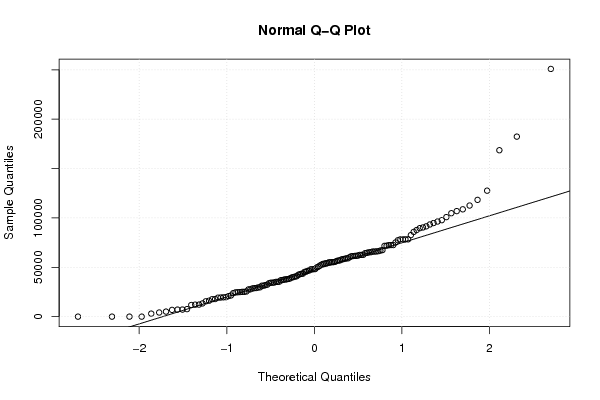
qqnorm(x)
qqline(x)
grid()
dev.off()
if (par2 > 0)
{
bitmap(file='lagplot1.png')
dum <- cbind(lag(x,k=1),x)
dum
dum1 <- dum[2:length(x),]
dum1
z <- as.data.frame(dum1)
z
plot(z,main='Lag plot (k=1), lowess, and regression line')
lines(lowess(z))
abline(lm(z))
dev.off()
if (par2 > 1) {
bitmap(file='lagplotpar2.png')
dum <- cbind(lag(x,k=par2),x)
dum
dum1 <- dum[(par2+1):length(x),]
dum1
z <- as.data.frame(dum1)
z
mylagtitle <- 'Lag plot (k='
mylagtitle <- paste(mylagtitle,par2,sep='')
mylagtitle <- paste(mylagtitle,'), and lowess',sep='')
plot(z,main=mylagtitle)
lines(lowess(z))
dev.off()
}
bitmap(file='pic5.png')
acf(x,lag.max=par2,main='Autocorrelation Function')
grid()
dev.off()
}
summary(x)
load(file='createtable')
a<-table.start()
a<-table.row.start(a)
a<-table.element(a,'Descriptive Statistics',2,TRUE)
a<-table.row.end(a)
a<-table.row.start(a)
a<-table.element(a,'# observations',header=TRUE)
a<-table.element(a,length(x))
a<-table.row.end(a)
a<-table.row.start(a)
a<-table.element(a,'minimum',header=TRUE)
a<-table.element(a,min(x))
a<-table.row.end(a)
a<-table.row.start(a)
a<-table.element(a,'Q1',header=TRUE)
a<-table.element(a,quantile(x,0.25))
a<-table.row.end(a)
a<-table.row.start(a)
a<-table.element(a,'median',header=TRUE)
a<-table.element(a,median(x))
a<-table.row.end(a)
a<-table.row.start(a)
a<-table.element(a,'mean',header=TRUE)
a<-table.element(a,mean(x))
a<-table.row.end(a)
a<-table.row.start(a)
a<-table.element(a,'Q3',header=TRUE)
a<-table.element(a,quantile(x,0.75))
a<-table.row.end(a)
a<-table.row.start(a)
a<-table.element(a,'maximum',header=TRUE)
a<-table.element(a,max(x))
a<-table.row.end(a)
a<-table.end(a)
table.save(a,file='mytable.tab')