| Multiple Linear Regression - Estimated Regression Equation |
| Jaar[t] = + 2002.30151203364 + 0.00615370318799464Januari[t] -0.00267791301964405Februari[t] -0.00355114795997903Maart[t] + e[t] |
| Multiple Linear Regression - Ordinary Least Squares | |||||
| Variable | Parameter | S.D. | T-STAT H0: parameter = 0 | 2-tail p-value | 1-tail p-value |
| (Intercept) | 2002.30151203364 | 0.753695 | 2656.6475 | 0 | 0 |
| Januari | 0.00615370318799464 | 0.005315 | 1.1577 | 0.254606 | 0.127303 |
| Februari | -0.00267791301964405 | 0.006477 | -0.4135 | 0.681715 | 0.340857 |
| Maart | -0.00355114795997903 | 0.004667 | -0.7609 | 0.451682 | 0.225841 |
| Multiple Linear Regression - Regression Statistics | |
| Multiple R | 0.202829006757096 |
| R-squared | 0.0411396059820703 |
| Adjusted R-squared | -0.0387654268527571 |
| F-TEST (value) | 0.5148562552638 |
| F-TEST (DF numerator) | 3 |
| F-TEST (DF denominator) | 36 |
| p-value | 0.67466504922187 |
| Multiple Linear Regression - Residual Statistics | |
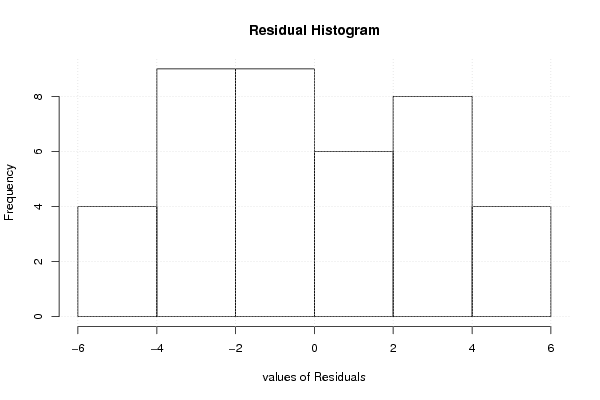
| Residual Standard Deviation | 2.96471813362265 |
| Sum Squared Residuals | 316.423930025915 |
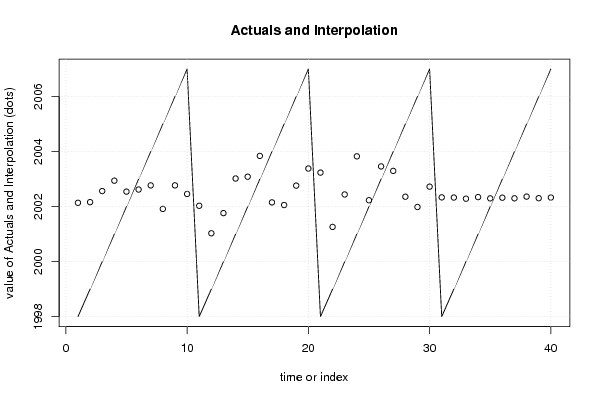
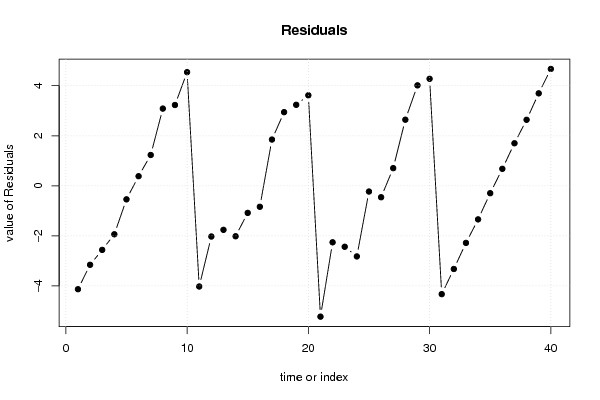
| Multiple Linear Regression - Actuals, Interpolation, and Residuals | |||
| Time or Index | Actuals | Interpolation Forecast | Residuals Prediction Error |
| 1 | 1998 | 2002.13699719354 | -4.13699719354392 |
| 2 | 1999 | 2002.16028215935 | -3.16028215935403 |
| 3 | 2000 | 2002.56354945484 | -2.56354945484046 |
| 4 | 2001 | 2002.94027749051 | -1.9402774905108 |
| 5 | 2002 | 2002.54303966398 | -0.543039663975543 |
| 6 | 2003 | 2002.61839019964 | 0.381609800355829 |
| 7 | 2004 | 2002.76908149486 | 1.23091850514352 |
| 8 | 2005 | 2001.91384886917 | 3.08615113083126 |
| 9 | 2006 | 2002.76988803547 | 3.23011196453437 |
| 10 | 2007 | 2002.45718903771 | 4.54281096228885 |
| 11 | 1998 | 2002.02830282043 | -4.02830282043261 |
| 12 | 1999 | 2001.02912339476 | -2.02912339476099 |
| 13 | 2000 | 2001.76186538638 | -1.76186538638374 |
| 14 | 2001 | 2003.01913180808 | -2.01913180808153 |
| 15 | 2002 | 2003.08420747326 | -1.08420747325736 |
| 16 | 2003 | 2003.84019201325 | -0.840192013253276 |
| 17 | 2004 | 2002.15157049705 | 1.84842950294497 |
| 18 | 2005 | 2002.05586474843 | 2.94413525156909 |
| 19 | 2006 | 2002.7614566881 | 3.23854331189574 |
| 20 | 2007 | 2003.38240075607 | 3.61759924393241 |
| 21 | 1998 | 2003.23394837256 | -5.23394837256271 |
| 22 | 1999 | 2001.26044450476 | -2.26044450476296 |
| 23 | 2000 | 2002.43896087287 | -2.43896087287493 |
| 24 | 2001 | 2003.82479019403 | -2.82479019402991 |
| 25 | 2002 | 2002.23032218001 | -0.230322180014529 |
| 26 | 2003 | 2003.45876849957 | -0.458768499565229 |
| 27 | 2004 | 2003.29534709503 | 0.704652904965763 |
| 28 | 2005 | 2002.35783805443 | 2.64216194556615 |
| 29 | 2006 | 2001.98403702196 | 4.01596297804379 |
| 30 | 2007 | 2002.72247838781 | 4.27752161218971 |
| 31 | 1998 | 2002.33408065044 | -4.33408065044425 |
| 32 | 1999 | 2002.32813587104 | -3.32813587103815 |
| 33 | 2000 | 2002.28515245611 | -2.28515245610681 |
| 34 | 2001 | 2002.34429585654 | -1.34429585654063 |
| 35 | 2002 | 2002.29768593586 | -0.297685935857683 |
| 36 | 2003 | 2002.32228359902 | 0.677716400983327 |
| 37 | 2004 | 2002.3005999223 | 1.69940007770134 |
| 38 | 2005 | 2002.36144549338 | 2.63855450661927 |
| 39 | 2006 | 2002.30442535179 | 3.69557464821428 |
| 40 | 2007 | 2002.32830049559 | 4.67169950441238 |
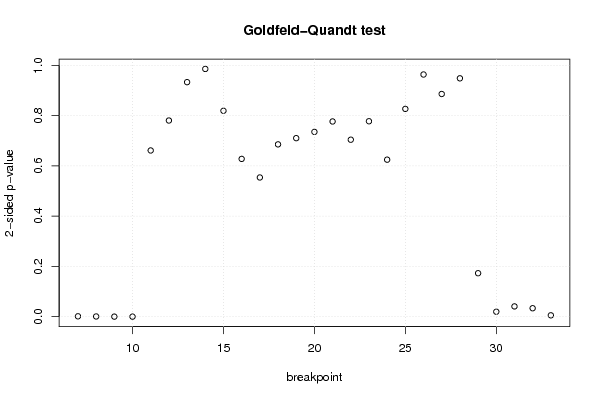
| Goldfeld-Quandt test for Heteroskedasticity | |||
| p-values | Alternative Hypothesis | ||
| breakpoint index | greater | 2-sided | less |
| 7 | 0.000718421861096067 | 0.00143684372219213 | 0.999281578138904 |
| 8 | 0.00035677763741873 | 0.000713555274837459 | 0.999643222362581 |
| 9 | 3.84043824409476e-05 | 7.68087648818951e-05 | 0.999961595617559 |
| 10 | 4.24760515605811e-06 | 8.49521031211622e-06 | 0.999995752394844 |
| 11 | 0.669419611609155 | 0.66116077678169 | 0.330580388390845 |
| 12 | 0.609817908274674 | 0.780364183450653 | 0.390182091725326 |
| 13 | 0.533507220792836 | 0.932985558414329 | 0.466492779207164 |
| 14 | 0.507248262111344 | 0.985503475777312 | 0.492751737888656 |
| 15 | 0.409527388992182 | 0.819054777984363 | 0.590472611007818 |
| 16 | 0.313836868060791 | 0.627673736121583 | 0.686163131939209 |
| 17 | 0.276868873324049 | 0.553737746648099 | 0.723131126675951 |
| 18 | 0.342709414111733 | 0.685418828223467 | 0.657290585888267 |
| 19 | 0.355054595178089 | 0.710109190356178 | 0.644945404821911 |
| 20 | 0.367558797714499 | 0.735117595428997 | 0.632441202285501 |
| 21 | 0.611729746364565 | 0.776540507270869 | 0.388270253635435 |
| 22 | 0.648037016806482 | 0.703925966387037 | 0.351962983193518 |
| 23 | 0.611261769394769 | 0.777476461210462 | 0.388738230605231 |
| 24 | 0.687715270780583 | 0.624569458438835 | 0.312284729219417 |
| 25 | 0.586711353764973 | 0.826577292470055 | 0.413288646235027 |
| 26 | 0.481713403146319 | 0.963426806292639 | 0.518286596853681 |
| 27 | 0.442933939537318 | 0.885867879074636 | 0.557066060462682 |
| 28 | 0.474136749262836 | 0.948273498525672 | 0.525863250737164 |
| 29 | 0.913584727093101 | 0.172830545813798 | 0.086415272906899 |
| 30 | 0.99017510498125 | 0.0196497900375003 | 0.00982489501875016 |
| 31 | 0.979584699211237 | 0.0408306015775256 | 0.0204153007887628 |
| 32 | 0.983260756552559 | 0.0334784868948817 | 0.0167392434474409 |
| 33 | 0.997340605162249 | 0.00531878967550269 | 0.00265939483775135 |
| Meta Analysis of Goldfeld-Quandt test for Heteroskedasticity | |||
| Description | # significant tests | % significant tests | OK/NOK |
| 1% type I error level | 5 | 0.185185185185185 | NOK |
| 5% type I error level | 8 | 0.296296296296296 | NOK |
| 10% type I error level | 8 | 0.296296296296296 | NOK |