Free Statistics

of Irreproducible Research!

Author's title

Author*The author of this computation has been verified*
R Software Modulerwasp_multipleregression.wasp
Title produced by softwareMultiple Regression
Date of computationWed, 23 Nov 2011 10:28:38 -0500
Cite this page as followsStatistical Computations at FreeStatistics.org, Office for Research Development and Education, URL https://freestatistics.org/blog/index.php?v=date/2011/Nov/23/t13220621711g8hz39lgfmfalf.htm/, Retrieved Sat, 20 Apr 2024 06:25:02 +0000
Statistical Computations at FreeStatistics.org, Office for Research Development and Education, URL https://freestatistics.org/blog/index.php?pk=146536, Retrieved Sat, 20 Apr 2024 06:25:02 +0000
QR Codes:

Original text written by user:
IsPrivate?No (this computation is public)
User-defined keywords
Estimated Impact143
Family? (F = Feedback message, R = changed R code, M = changed R Module, P = changed Parameters, D = changed Data)
-     [Multiple Regression] [Competence to learn] [2010-11-17 07:43:53] [b98453cac15ba1066b407e146608df68]
-   PD  [Multiple Regression] [Ws 7 - multiple r...] [2010-11-21 14:34:41] [603e2f5305d3a2a4e062624458fa1155]
-    D      [Multiple Regression] [Workshop 7] [2011-11-23 15:28:38] [5a15ab6cc81a4d08ac9d21b238bcb336] [Current]
Feedback Forum

Post a new message
Dataseries X:
1998	1073	965	1178
1999	1141	1094	1192
2000	1239	1158	1200
2001	1323	1152	1244
2002	1274	1140	1280
2003	1317	1151	1325
2004	1390	1289	1305
2005	1318	1305	1409
2006	1472	1379	1379
2007	1436	1299	1465
1998	5281	4944	5500
1999	5055	4819	5484
2000	5219	4966	5451
2001	5230	4604	5389
2002	5200	4772	5192
2003	5139	4567	5028
2004	5215	4924	5366
2005	5344	4922	5618
2006	5550	4990	5725
2007	5729	5253	5662
1998	3138	2732	3115
1999	3019	2921	3322
2000	3311	3197	3288
2001	3375	2930	3210
2002	3185	2992	3283
2003	3220	2924	3049
2004	3224	2912	3111
2005	3187	2945	3286
2006	3136	2856	3370
2007	3246	2959	3275
1998	63	61	54
1999	60	55	55
2000	51	57	50
2001	58	51	50
2002	50	54	47
2003	55	51	51
2004	60	56	62
2005	56	40	50
2006	44	43	43
2007	47	37	46


Summary of computational transaction
Raw Inputview raw input (R code)
Raw Outputview raw output of R engine
Computing time3 seconds
R Server'Gwilym Jenkins' @ jenkins.wessa.net

\begin{tabular}{lllllllll}
\hline
Summary of computational transaction \tabularnewline
Raw Input & view raw input (R code)  \tabularnewline
Raw Output & view raw output of R engine  \tabularnewline
Computing time & 3 seconds \tabularnewline
R Server & 'Gwilym Jenkins' @ jenkins.wessa.net \tabularnewline
\hline
\end{tabular}
%Source: https://freestatistics.org/blog/index.php?pk=146536&T=0

[TABLE]
[ROW][C]Summary of computational transaction[/C][/ROW]
[ROW][C]Raw Input[/C][C]view raw input (R code) [/C][/ROW]
[ROW][C]Raw Output[/C][C]view raw output of R engine [/C][/ROW]
[ROW][C]Computing time[/C][C]3 seconds[/C][/ROW]
[ROW][C]R Server[/C][C]'Gwilym Jenkins' @ jenkins.wessa.net[/C][/ROW]
[/TABLE]
Source: https://freestatistics.org/blog/index.php?pk=146536&T=0

Globally Unique Identifier (entire table): ba.freestatistics.org/blog/index.php?pk=146536&T=0

As an alternative you can also use a QR Code:  

The GUIDs for individual cells are displayed in the table below:

Summary of computational transaction
Raw Inputview raw input (R code)
Raw Outputview raw output of R engine
Computing time3 seconds
R Server'Gwilym Jenkins' @ jenkins.wessa.net


Multiple Linear Regression - Estimated Regression Equation
Jaar[t] = + 2002.30151203364 + 0.00615370318799464Januari[t] -0.00267791301964405Februari[t] -0.00355114795997903Maart[t] + e[t]

\begin{tabular}{lllllllll}
\hline
Multiple Linear Regression - Estimated Regression Equation \tabularnewline
Jaar[t] =  +  2002.30151203364 +  0.00615370318799464Januari[t] -0.00267791301964405Februari[t] -0.00355114795997903Maart[t]  + e[t] \tabularnewline
\hline
\end{tabular}
%Source: https://freestatistics.org/blog/index.php?pk=146536&T=1

[TABLE]
[ROW][C]Multiple Linear Regression - Estimated Regression Equation[/C][/ROW]
[ROW][C]Jaar[t] =  +  2002.30151203364 +  0.00615370318799464Januari[t] -0.00267791301964405Februari[t] -0.00355114795997903Maart[t]  + e[t][/C][/ROW]
[/TABLE]
Source: https://freestatistics.org/blog/index.php?pk=146536&T=1

Globally Unique Identifier (entire table): ba.freestatistics.org/blog/index.php?pk=146536&T=1

As an alternative you can also use a QR Code:  

The GUIDs for individual cells are displayed in the table below:

Multiple Linear Regression - Estimated Regression Equation
Jaar[t] = + 2002.30151203364 + 0.00615370318799464Januari[t] -0.00267791301964405Februari[t] -0.00355114795997903Maart[t] + e[t]


Multiple Linear Regression - Ordinary Least Squares
VariableParameterS.D.T-STATH0: parameter = 02-tail p-value1-tail p-value
(Intercept)2002.301512033640.7536952656.647500
Januari0.006153703187994640.0053151.15770.2546060.127303
Februari-0.002677913019644050.006477-0.41350.6817150.340857
Maart-0.003551147959979030.004667-0.76090.4516820.225841

\begin{tabular}{lllllllll}
\hline
Multiple Linear Regression - Ordinary Least Squares \tabularnewline
Variable & Parameter & S.D. & T-STATH0: parameter = 0 & 2-tail p-value & 1-tail p-value \tabularnewline
(Intercept) & 2002.30151203364 & 0.753695 & 2656.6475 & 0 & 0 \tabularnewline
Januari & 0.00615370318799464 & 0.005315 & 1.1577 & 0.254606 & 0.127303 \tabularnewline
Februari & -0.00267791301964405 & 0.006477 & -0.4135 & 0.681715 & 0.340857 \tabularnewline
Maart & -0.00355114795997903 & 0.004667 & -0.7609 & 0.451682 & 0.225841 \tabularnewline
\hline
\end{tabular}
%Source: https://freestatistics.org/blog/index.php?pk=146536&T=2

[TABLE]
[ROW][C]Multiple Linear Regression - Ordinary Least Squares[/C][/ROW]
[ROW][C]Variable[/C][C]Parameter[/C][C]S.D.[/C][C]T-STATH0: parameter = 0[/C][C]2-tail p-value[/C][C]1-tail p-value[/C][/ROW]
[ROW][C](Intercept)[/C][C]2002.30151203364[/C][C]0.753695[/C][C]2656.6475[/C][C]0[/C][C]0[/C][/ROW]
[ROW][C]Januari[/C][C]0.00615370318799464[/C][C]0.005315[/C][C]1.1577[/C][C]0.254606[/C][C]0.127303[/C][/ROW]
[ROW][C]Februari[/C][C]-0.00267791301964405[/C][C]0.006477[/C][C]-0.4135[/C][C]0.681715[/C][C]0.340857[/C][/ROW]
[ROW][C]Maart[/C][C]-0.00355114795997903[/C][C]0.004667[/C][C]-0.7609[/C][C]0.451682[/C][C]0.225841[/C][/ROW]
[/TABLE]
Source: https://freestatistics.org/blog/index.php?pk=146536&T=2

Globally Unique Identifier (entire table): ba.freestatistics.org/blog/index.php?pk=146536&T=2

As an alternative you can also use a QR Code:  

The GUIDs for individual cells are displayed in the table below:

Multiple Linear Regression - Ordinary Least Squares
VariableParameterS.D.T-STATH0: parameter = 02-tail p-value1-tail p-value
(Intercept)2002.301512033640.7536952656.647500
Januari0.006153703187994640.0053151.15770.2546060.127303
Februari-0.002677913019644050.006477-0.41350.6817150.340857
Maart-0.003551147959979030.004667-0.76090.4516820.225841


Multiple Linear Regression - Regression Statistics
Multiple R0.202829006757096
R-squared0.0411396059820703
Adjusted R-squared-0.0387654268527571
F-TEST (value)0.5148562552638
F-TEST (DF numerator)3
F-TEST (DF denominator)36
p-value0.67466504922187
Multiple Linear Regression - Residual Statistics
Residual Standard Deviation2.96471813362265
Sum Squared Residuals316.423930025915

\begin{tabular}{lllllllll}
\hline
Multiple Linear Regression - Regression Statistics \tabularnewline
Multiple R & 0.202829006757096 \tabularnewline
R-squared & 0.0411396059820703 \tabularnewline
Adjusted R-squared & -0.0387654268527571 \tabularnewline
F-TEST (value) & 0.5148562552638 \tabularnewline
F-TEST (DF numerator) & 3 \tabularnewline
F-TEST (DF denominator) & 36 \tabularnewline
p-value & 0.67466504922187 \tabularnewline
Multiple Linear Regression - Residual Statistics \tabularnewline
Residual Standard Deviation & 2.96471813362265 \tabularnewline
Sum Squared Residuals & 316.423930025915 \tabularnewline
\hline
\end{tabular}
%Source: https://freestatistics.org/blog/index.php?pk=146536&T=3

[TABLE]
[ROW][C]Multiple Linear Regression - Regression Statistics[/C][/ROW]
[ROW][C]Multiple R[/C][C]0.202829006757096[/C][/ROW]
[ROW][C]R-squared[/C][C]0.0411396059820703[/C][/ROW]
[ROW][C]Adjusted R-squared[/C][C]-0.0387654268527571[/C][/ROW]
[ROW][C]F-TEST (value)[/C][C]0.5148562552638[/C][/ROW]
[ROW][C]F-TEST (DF numerator)[/C][C]3[/C][/ROW]
[ROW][C]F-TEST (DF denominator)[/C][C]36[/C][/ROW]
[ROW][C]p-value[/C][C]0.67466504922187[/C][/ROW]
[ROW][C]Multiple Linear Regression - Residual Statistics[/C][/ROW]
[ROW][C]Residual Standard Deviation[/C][C]2.96471813362265[/C][/ROW]
[ROW][C]Sum Squared Residuals[/C][C]316.423930025915[/C][/ROW]
[/TABLE]
Source: https://freestatistics.org/blog/index.php?pk=146536&T=3

Globally Unique Identifier (entire table): ba.freestatistics.org/blog/index.php?pk=146536&T=3

As an alternative you can also use a QR Code:  

The GUIDs for individual cells are displayed in the table below:

Multiple Linear Regression - Regression Statistics
Multiple R0.202829006757096
R-squared0.0411396059820703
Adjusted R-squared-0.0387654268527571
F-TEST (value)0.5148562552638
F-TEST (DF numerator)3
F-TEST (DF denominator)36
p-value0.67466504922187
Multiple Linear Regression - Residual Statistics
Residual Standard Deviation2.96471813362265
Sum Squared Residuals316.423930025915


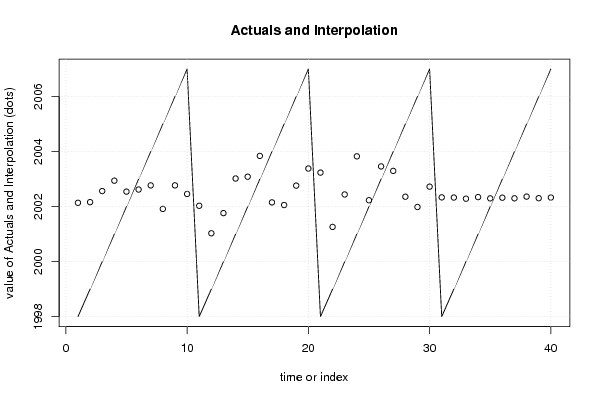
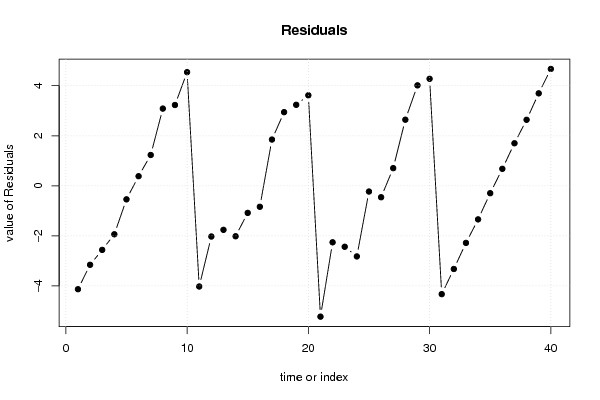
Multiple Linear Regression - Actuals, Interpolation, and Residuals
Time or IndexActualsInterpolationForecastResidualsPrediction Error
119982002.13699719354-4.13699719354392
219992002.16028215935-3.16028215935403
320002002.56354945484-2.56354945484046
420012002.94027749051-1.9402774905108
520022002.54303966398-0.543039663975543
620032002.618390199640.381609800355829
720042002.769081494861.23091850514352
820052001.913848869173.08615113083126
920062002.769888035473.23011196453437
1020072002.457189037714.54281096228885
1119982002.02830282043-4.02830282043261
1219992001.02912339476-2.02912339476099
1320002001.76186538638-1.76186538638374
1420012003.01913180808-2.01913180808153
1520022003.08420747326-1.08420747325736
1620032003.84019201325-0.840192013253276
1720042002.151570497051.84842950294497
1820052002.055864748432.94413525156909
1920062002.76145668813.23854331189574
2020072003.382400756073.61759924393241
2119982003.23394837256-5.23394837256271
2219992001.26044450476-2.26044450476296
2320002002.43896087287-2.43896087287493
2420012003.82479019403-2.82479019402991
2520022002.23032218001-0.230322180014529
2620032003.45876849957-0.458768499565229
2720042003.295347095030.704652904965763
2820052002.357838054432.64216194556615
2920062001.984037021964.01596297804379
3020072002.722478387814.27752161218971
3119982002.33408065044-4.33408065044425
3219992002.32813587104-3.32813587103815
3320002002.28515245611-2.28515245610681
3420012002.34429585654-1.34429585654063
3520022002.29768593586-0.297685935857683
3620032002.322283599020.677716400983327
3720042002.30059992231.69940007770134
3820052002.361445493382.63855450661927
3920062002.304425351793.69557464821428
4020072002.328300495594.67169950441238

\begin{tabular}{lllllllll}
\hline
Multiple Linear Regression - Actuals, Interpolation, and Residuals \tabularnewline
Time or Index & Actuals & InterpolationForecast & ResidualsPrediction Error \tabularnewline
1 & 1998 & 2002.13699719354 & -4.13699719354392 \tabularnewline
2 & 1999 & 2002.16028215935 & -3.16028215935403 \tabularnewline
3 & 2000 & 2002.56354945484 & -2.56354945484046 \tabularnewline
4 & 2001 & 2002.94027749051 & -1.9402774905108 \tabularnewline
5 & 2002 & 2002.54303966398 & -0.543039663975543 \tabularnewline
6 & 2003 & 2002.61839019964 & 0.381609800355829 \tabularnewline
7 & 2004 & 2002.76908149486 & 1.23091850514352 \tabularnewline
8 & 2005 & 2001.91384886917 & 3.08615113083126 \tabularnewline
9 & 2006 & 2002.76988803547 & 3.23011196453437 \tabularnewline
10 & 2007 & 2002.45718903771 & 4.54281096228885 \tabularnewline
11 & 1998 & 2002.02830282043 & -4.02830282043261 \tabularnewline
12 & 1999 & 2001.02912339476 & -2.02912339476099 \tabularnewline
13 & 2000 & 2001.76186538638 & -1.76186538638374 \tabularnewline
14 & 2001 & 2003.01913180808 & -2.01913180808153 \tabularnewline
15 & 2002 & 2003.08420747326 & -1.08420747325736 \tabularnewline
16 & 2003 & 2003.84019201325 & -0.840192013253276 \tabularnewline
17 & 2004 & 2002.15157049705 & 1.84842950294497 \tabularnewline
18 & 2005 & 2002.05586474843 & 2.94413525156909 \tabularnewline
19 & 2006 & 2002.7614566881 & 3.23854331189574 \tabularnewline
20 & 2007 & 2003.38240075607 & 3.61759924393241 \tabularnewline
21 & 1998 & 2003.23394837256 & -5.23394837256271 \tabularnewline
22 & 1999 & 2001.26044450476 & -2.26044450476296 \tabularnewline
23 & 2000 & 2002.43896087287 & -2.43896087287493 \tabularnewline
24 & 2001 & 2003.82479019403 & -2.82479019402991 \tabularnewline
25 & 2002 & 2002.23032218001 & -0.230322180014529 \tabularnewline
26 & 2003 & 2003.45876849957 & -0.458768499565229 \tabularnewline
27 & 2004 & 2003.29534709503 & 0.704652904965763 \tabularnewline
28 & 2005 & 2002.35783805443 & 2.64216194556615 \tabularnewline
29 & 2006 & 2001.98403702196 & 4.01596297804379 \tabularnewline
30 & 2007 & 2002.72247838781 & 4.27752161218971 \tabularnewline
31 & 1998 & 2002.33408065044 & -4.33408065044425 \tabularnewline
32 & 1999 & 2002.32813587104 & -3.32813587103815 \tabularnewline
33 & 2000 & 2002.28515245611 & -2.28515245610681 \tabularnewline
34 & 2001 & 2002.34429585654 & -1.34429585654063 \tabularnewline
35 & 2002 & 2002.29768593586 & -0.297685935857683 \tabularnewline
36 & 2003 & 2002.32228359902 & 0.677716400983327 \tabularnewline
37 & 2004 & 2002.3005999223 & 1.69940007770134 \tabularnewline
38 & 2005 & 2002.36144549338 & 2.63855450661927 \tabularnewline
39 & 2006 & 2002.30442535179 & 3.69557464821428 \tabularnewline
40 & 2007 & 2002.32830049559 & 4.67169950441238 \tabularnewline
\hline
\end{tabular}
%Source: https://freestatistics.org/blog/index.php?pk=146536&T=4

[TABLE]
[ROW][C]Multiple Linear Regression - Actuals, Interpolation, and Residuals[/C][/ROW]
[ROW][C]Time or Index[/C][C]Actuals[/C][C]InterpolationForecast[/C][C]ResidualsPrediction Error[/C][/ROW]
[ROW][C]1[/C][C]1998[/C][C]2002.13699719354[/C][C]-4.13699719354392[/C][/ROW]
[ROW][C]2[/C][C]1999[/C][C]2002.16028215935[/C][C]-3.16028215935403[/C][/ROW]
[ROW][C]3[/C][C]2000[/C][C]2002.56354945484[/C][C]-2.56354945484046[/C][/ROW]
[ROW][C]4[/C][C]2001[/C][C]2002.94027749051[/C][C]-1.9402774905108[/C][/ROW]
[ROW][C]5[/C][C]2002[/C][C]2002.54303966398[/C][C]-0.543039663975543[/C][/ROW]
[ROW][C]6[/C][C]2003[/C][C]2002.61839019964[/C][C]0.381609800355829[/C][/ROW]
[ROW][C]7[/C][C]2004[/C][C]2002.76908149486[/C][C]1.23091850514352[/C][/ROW]
[ROW][C]8[/C][C]2005[/C][C]2001.91384886917[/C][C]3.08615113083126[/C][/ROW]
[ROW][C]9[/C][C]2006[/C][C]2002.76988803547[/C][C]3.23011196453437[/C][/ROW]
[ROW][C]10[/C][C]2007[/C][C]2002.45718903771[/C][C]4.54281096228885[/C][/ROW]
[ROW][C]11[/C][C]1998[/C][C]2002.02830282043[/C][C]-4.02830282043261[/C][/ROW]
[ROW][C]12[/C][C]1999[/C][C]2001.02912339476[/C][C]-2.02912339476099[/C][/ROW]
[ROW][C]13[/C][C]2000[/C][C]2001.76186538638[/C][C]-1.76186538638374[/C][/ROW]
[ROW][C]14[/C][C]2001[/C][C]2003.01913180808[/C][C]-2.01913180808153[/C][/ROW]
[ROW][C]15[/C][C]2002[/C][C]2003.08420747326[/C][C]-1.08420747325736[/C][/ROW]
[ROW][C]16[/C][C]2003[/C][C]2003.84019201325[/C][C]-0.840192013253276[/C][/ROW]
[ROW][C]17[/C][C]2004[/C][C]2002.15157049705[/C][C]1.84842950294497[/C][/ROW]
[ROW][C]18[/C][C]2005[/C][C]2002.05586474843[/C][C]2.94413525156909[/C][/ROW]
[ROW][C]19[/C][C]2006[/C][C]2002.7614566881[/C][C]3.23854331189574[/C][/ROW]
[ROW][C]20[/C][C]2007[/C][C]2003.38240075607[/C][C]3.61759924393241[/C][/ROW]
[ROW][C]21[/C][C]1998[/C][C]2003.23394837256[/C][C]-5.23394837256271[/C][/ROW]
[ROW][C]22[/C][C]1999[/C][C]2001.26044450476[/C][C]-2.26044450476296[/C][/ROW]
[ROW][C]23[/C][C]2000[/C][C]2002.43896087287[/C][C]-2.43896087287493[/C][/ROW]
[ROW][C]24[/C][C]2001[/C][C]2003.82479019403[/C][C]-2.82479019402991[/C][/ROW]
[ROW][C]25[/C][C]2002[/C][C]2002.23032218001[/C][C]-0.230322180014529[/C][/ROW]
[ROW][C]26[/C][C]2003[/C][C]2003.45876849957[/C][C]-0.458768499565229[/C][/ROW]
[ROW][C]27[/C][C]2004[/C][C]2003.29534709503[/C][C]0.704652904965763[/C][/ROW]
[ROW][C]28[/C][C]2005[/C][C]2002.35783805443[/C][C]2.64216194556615[/C][/ROW]
[ROW][C]29[/C][C]2006[/C][C]2001.98403702196[/C][C]4.01596297804379[/C][/ROW]
[ROW][C]30[/C][C]2007[/C][C]2002.72247838781[/C][C]4.27752161218971[/C][/ROW]
[ROW][C]31[/C][C]1998[/C][C]2002.33408065044[/C][C]-4.33408065044425[/C][/ROW]
[ROW][C]32[/C][C]1999[/C][C]2002.32813587104[/C][C]-3.32813587103815[/C][/ROW]
[ROW][C]33[/C][C]2000[/C][C]2002.28515245611[/C][C]-2.28515245610681[/C][/ROW]
[ROW][C]34[/C][C]2001[/C][C]2002.34429585654[/C][C]-1.34429585654063[/C][/ROW]
[ROW][C]35[/C][C]2002[/C][C]2002.29768593586[/C][C]-0.297685935857683[/C][/ROW]
[ROW][C]36[/C][C]2003[/C][C]2002.32228359902[/C][C]0.677716400983327[/C][/ROW]
[ROW][C]37[/C][C]2004[/C][C]2002.3005999223[/C][C]1.69940007770134[/C][/ROW]
[ROW][C]38[/C][C]2005[/C][C]2002.36144549338[/C][C]2.63855450661927[/C][/ROW]
[ROW][C]39[/C][C]2006[/C][C]2002.30442535179[/C][C]3.69557464821428[/C][/ROW]
[ROW][C]40[/C][C]2007[/C][C]2002.32830049559[/C][C]4.67169950441238[/C][/ROW]
[/TABLE]
Source: https://freestatistics.org/blog/index.php?pk=146536&T=4

Globally Unique Identifier (entire table): ba.freestatistics.org/blog/index.php?pk=146536&T=4

As an alternative you can also use a QR Code:  

The GUIDs for individual cells are displayed in the table below:

Multiple Linear Regression - Actuals, Interpolation, and Residuals
Time or IndexActualsInterpolationForecastResidualsPrediction Error
119982002.13699719354-4.13699719354392
219992002.16028215935-3.16028215935403
320002002.56354945484-2.56354945484046
420012002.94027749051-1.9402774905108
520022002.54303966398-0.543039663975543
620032002.618390199640.381609800355829
720042002.769081494861.23091850514352
820052001.913848869173.08615113083126
920062002.769888035473.23011196453437
1020072002.457189037714.54281096228885
1119982002.02830282043-4.02830282043261
1219992001.02912339476-2.02912339476099
1320002001.76186538638-1.76186538638374
1420012003.01913180808-2.01913180808153
1520022003.08420747326-1.08420747325736
1620032003.84019201325-0.840192013253276
1720042002.151570497051.84842950294497
1820052002.055864748432.94413525156909
1920062002.76145668813.23854331189574
2020072003.382400756073.61759924393241
2119982003.23394837256-5.23394837256271
2219992001.26044450476-2.26044450476296
2320002002.43896087287-2.43896087287493
2420012003.82479019403-2.82479019402991
2520022002.23032218001-0.230322180014529
2620032003.45876849957-0.458768499565229
2720042003.295347095030.704652904965763
2820052002.357838054432.64216194556615
2920062001.984037021964.01596297804379
3020072002.722478387814.27752161218971
3119982002.33408065044-4.33408065044425
3219992002.32813587104-3.32813587103815
3320002002.28515245611-2.28515245610681
3420012002.34429585654-1.34429585654063
3520022002.29768593586-0.297685935857683
3620032002.322283599020.677716400983327
3720042002.30059992231.69940007770134
3820052002.361445493382.63855450661927
3920062002.304425351793.69557464821428
4020072002.328300495594.67169950441238


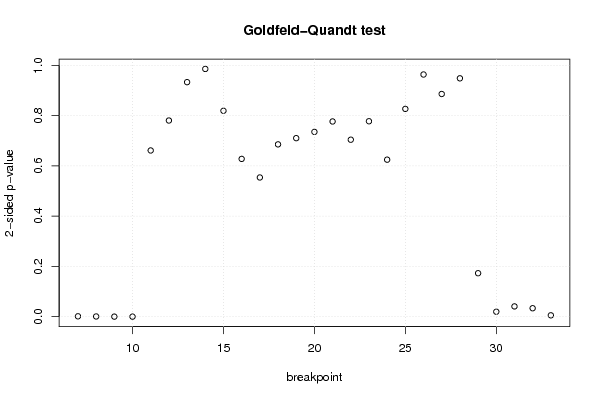
Goldfeld-Quandt test for Heteroskedasticity
p-valuesAlternative Hypothesis
breakpoint indexgreater2-sidedless
70.0007184218610960670.001436843722192130.999281578138904
80.000356777637418730.0007135552748374590.999643222362581
93.84043824409476e-057.68087648818951e-050.999961595617559
104.24760515605811e-068.49521031211622e-060.999995752394844
110.6694196116091550.661160776781690.330580388390845
120.6098179082746740.7803641834506530.390182091725326
130.5335072207928360.9329855584143290.466492779207164
140.5072482621113440.9855034757773120.492751737888656
150.4095273889921820.8190547779843630.590472611007818
160.3138368680607910.6276737361215830.686163131939209
170.2768688733240490.5537377466480990.723131126675951
180.3427094141117330.6854188282234670.657290585888267
190.3550545951780890.7101091903561780.644945404821911
200.3675587977144990.7351175954289970.632441202285501
210.6117297463645650.7765405072708690.388270253635435
220.6480370168064820.7039259663870370.351962983193518
230.6112617693947690.7774764612104620.388738230605231
240.6877152707805830.6245694584388350.312284729219417
250.5867113537649730.8265772924700550.413288646235027
260.4817134031463190.9634268062926390.518286596853681
270.4429339395373180.8858678790746360.557066060462682
280.4741367492628360.9482734985256720.525863250737164
290.9135847270931010.1728305458137980.086415272906899
300.990175104981250.01964979003750030.00982489501875016
310.9795846992112370.04083060157752560.0204153007887628
320.9832607565525590.03347848689488170.0167392434474409
330.9973406051622490.005318789675502690.00265939483775135

\begin{tabular}{lllllllll}
\hline
Goldfeld-Quandt test for Heteroskedasticity \tabularnewline
p-values & Alternative Hypothesis \tabularnewline
breakpoint index & greater & 2-sided & less \tabularnewline
7 & 0.000718421861096067 & 0.00143684372219213 & 0.999281578138904 \tabularnewline
8 & 0.00035677763741873 & 0.000713555274837459 & 0.999643222362581 \tabularnewline
9 & 3.84043824409476e-05 & 7.68087648818951e-05 & 0.999961595617559 \tabularnewline
10 & 4.24760515605811e-06 & 8.49521031211622e-06 & 0.999995752394844 \tabularnewline
11 & 0.669419611609155 & 0.66116077678169 & 0.330580388390845 \tabularnewline
12 & 0.609817908274674 & 0.780364183450653 & 0.390182091725326 \tabularnewline
13 & 0.533507220792836 & 0.932985558414329 & 0.466492779207164 \tabularnewline
14 & 0.507248262111344 & 0.985503475777312 & 0.492751737888656 \tabularnewline
15 & 0.409527388992182 & 0.819054777984363 & 0.590472611007818 \tabularnewline
16 & 0.313836868060791 & 0.627673736121583 & 0.686163131939209 \tabularnewline
17 & 0.276868873324049 & 0.553737746648099 & 0.723131126675951 \tabularnewline
18 & 0.342709414111733 & 0.685418828223467 & 0.657290585888267 \tabularnewline
19 & 0.355054595178089 & 0.710109190356178 & 0.644945404821911 \tabularnewline
20 & 0.367558797714499 & 0.735117595428997 & 0.632441202285501 \tabularnewline
21 & 0.611729746364565 & 0.776540507270869 & 0.388270253635435 \tabularnewline
22 & 0.648037016806482 & 0.703925966387037 & 0.351962983193518 \tabularnewline
23 & 0.611261769394769 & 0.777476461210462 & 0.388738230605231 \tabularnewline
24 & 0.687715270780583 & 0.624569458438835 & 0.312284729219417 \tabularnewline
25 & 0.586711353764973 & 0.826577292470055 & 0.413288646235027 \tabularnewline
26 & 0.481713403146319 & 0.963426806292639 & 0.518286596853681 \tabularnewline
27 & 0.442933939537318 & 0.885867879074636 & 0.557066060462682 \tabularnewline
28 & 0.474136749262836 & 0.948273498525672 & 0.525863250737164 \tabularnewline
29 & 0.913584727093101 & 0.172830545813798 & 0.086415272906899 \tabularnewline
30 & 0.99017510498125 & 0.0196497900375003 & 0.00982489501875016 \tabularnewline
31 & 0.979584699211237 & 0.0408306015775256 & 0.0204153007887628 \tabularnewline
32 & 0.983260756552559 & 0.0334784868948817 & 0.0167392434474409 \tabularnewline
33 & 0.997340605162249 & 0.00531878967550269 & 0.00265939483775135 \tabularnewline
\hline
\end{tabular}
%Source: https://freestatistics.org/blog/index.php?pk=146536&T=5

[TABLE]
[ROW][C]Goldfeld-Quandt test for Heteroskedasticity[/C][/ROW]
[ROW][C]p-values[/C][C]Alternative Hypothesis[/C][/ROW]
[ROW][C]breakpoint index[/C][C]greater[/C][C]2-sided[/C][C]less[/C][/ROW]
[ROW][C]7[/C][C]0.000718421861096067[/C][C]0.00143684372219213[/C][C]0.999281578138904[/C][/ROW]
[ROW][C]8[/C][C]0.00035677763741873[/C][C]0.000713555274837459[/C][C]0.999643222362581[/C][/ROW]
[ROW][C]9[/C][C]3.84043824409476e-05[/C][C]7.68087648818951e-05[/C][C]0.999961595617559[/C][/ROW]
[ROW][C]10[/C][C]4.24760515605811e-06[/C][C]8.49521031211622e-06[/C][C]0.999995752394844[/C][/ROW]
[ROW][C]11[/C][C]0.669419611609155[/C][C]0.66116077678169[/C][C]0.330580388390845[/C][/ROW]
[ROW][C]12[/C][C]0.609817908274674[/C][C]0.780364183450653[/C][C]0.390182091725326[/C][/ROW]
[ROW][C]13[/C][C]0.533507220792836[/C][C]0.932985558414329[/C][C]0.466492779207164[/C][/ROW]
[ROW][C]14[/C][C]0.507248262111344[/C][C]0.985503475777312[/C][C]0.492751737888656[/C][/ROW]
[ROW][C]15[/C][C]0.409527388992182[/C][C]0.819054777984363[/C][C]0.590472611007818[/C][/ROW]
[ROW][C]16[/C][C]0.313836868060791[/C][C]0.627673736121583[/C][C]0.686163131939209[/C][/ROW]
[ROW][C]17[/C][C]0.276868873324049[/C][C]0.553737746648099[/C][C]0.723131126675951[/C][/ROW]
[ROW][C]18[/C][C]0.342709414111733[/C][C]0.685418828223467[/C][C]0.657290585888267[/C][/ROW]
[ROW][C]19[/C][C]0.355054595178089[/C][C]0.710109190356178[/C][C]0.644945404821911[/C][/ROW]
[ROW][C]20[/C][C]0.367558797714499[/C][C]0.735117595428997[/C][C]0.632441202285501[/C][/ROW]
[ROW][C]21[/C][C]0.611729746364565[/C][C]0.776540507270869[/C][C]0.388270253635435[/C][/ROW]
[ROW][C]22[/C][C]0.648037016806482[/C][C]0.703925966387037[/C][C]0.351962983193518[/C][/ROW]
[ROW][C]23[/C][C]0.611261769394769[/C][C]0.777476461210462[/C][C]0.388738230605231[/C][/ROW]
[ROW][C]24[/C][C]0.687715270780583[/C][C]0.624569458438835[/C][C]0.312284729219417[/C][/ROW]
[ROW][C]25[/C][C]0.586711353764973[/C][C]0.826577292470055[/C][C]0.413288646235027[/C][/ROW]
[ROW][C]26[/C][C]0.481713403146319[/C][C]0.963426806292639[/C][C]0.518286596853681[/C][/ROW]
[ROW][C]27[/C][C]0.442933939537318[/C][C]0.885867879074636[/C][C]0.557066060462682[/C][/ROW]
[ROW][C]28[/C][C]0.474136749262836[/C][C]0.948273498525672[/C][C]0.525863250737164[/C][/ROW]
[ROW][C]29[/C][C]0.913584727093101[/C][C]0.172830545813798[/C][C]0.086415272906899[/C][/ROW]
[ROW][C]30[/C][C]0.99017510498125[/C][C]0.0196497900375003[/C][C]0.00982489501875016[/C][/ROW]
[ROW][C]31[/C][C]0.979584699211237[/C][C]0.0408306015775256[/C][C]0.0204153007887628[/C][/ROW]
[ROW][C]32[/C][C]0.983260756552559[/C][C]0.0334784868948817[/C][C]0.0167392434474409[/C][/ROW]
[ROW][C]33[/C][C]0.997340605162249[/C][C]0.00531878967550269[/C][C]0.00265939483775135[/C][/ROW]
[/TABLE]
Source: https://freestatistics.org/blog/index.php?pk=146536&T=5

Globally Unique Identifier (entire table): ba.freestatistics.org/blog/index.php?pk=146536&T=5

As an alternative you can also use a QR Code:  

The GUIDs for individual cells are displayed in the table below:

Goldfeld-Quandt test for Heteroskedasticity
p-valuesAlternative Hypothesis
breakpoint indexgreater2-sidedless
70.0007184218610960670.001436843722192130.999281578138904
80.000356777637418730.0007135552748374590.999643222362581
93.84043824409476e-057.68087648818951e-050.999961595617559
104.24760515605811e-068.49521031211622e-060.999995752394844
110.6694196116091550.661160776781690.330580388390845
120.6098179082746740.7803641834506530.390182091725326
130.5335072207928360.9329855584143290.466492779207164
140.5072482621113440.9855034757773120.492751737888656
150.4095273889921820.8190547779843630.590472611007818
160.3138368680607910.6276737361215830.686163131939209
170.2768688733240490.5537377466480990.723131126675951
180.3427094141117330.6854188282234670.657290585888267
190.3550545951780890.7101091903561780.644945404821911
200.3675587977144990.7351175954289970.632441202285501
210.6117297463645650.7765405072708690.388270253635435
220.6480370168064820.7039259663870370.351962983193518
230.6112617693947690.7774764612104620.388738230605231
240.6877152707805830.6245694584388350.312284729219417
250.5867113537649730.8265772924700550.413288646235027
260.4817134031463190.9634268062926390.518286596853681
270.4429339395373180.8858678790746360.557066060462682
280.4741367492628360.9482734985256720.525863250737164
290.9135847270931010.1728305458137980.086415272906899
300.990175104981250.01964979003750030.00982489501875016
310.9795846992112370.04083060157752560.0204153007887628
320.9832607565525590.03347848689488170.0167392434474409
330.9973406051622490.005318789675502690.00265939483775135


Meta Analysis of Goldfeld-Quandt test for Heteroskedasticity
Description# significant tests% significant testsOK/NOK
1% type I error level50.185185185185185NOK
5% type I error level80.296296296296296NOK
10% type I error level80.296296296296296NOK

\begin{tabular}{lllllllll}
\hline
Meta Analysis of Goldfeld-Quandt test for Heteroskedasticity \tabularnewline
Description & # significant tests & % significant tests & OK/NOK \tabularnewline
1% type I error level & 5 & 0.185185185185185 & NOK \tabularnewline
5% type I error level & 8 & 0.296296296296296 & NOK \tabularnewline
10% type I error level & 8 & 0.296296296296296 & NOK \tabularnewline
\hline
\end{tabular}
%Source: https://freestatistics.org/blog/index.php?pk=146536&T=6

[TABLE]
[ROW][C]Meta Analysis of Goldfeld-Quandt test for Heteroskedasticity[/C][/ROW]
[ROW][C]Description[/C][C]# significant tests[/C][C]% significant tests[/C][C]OK/NOK[/C][/ROW]
[ROW][C]1% type I error level[/C][C]5[/C][C]0.185185185185185[/C][C]NOK[/C][/ROW]
[ROW][C]5% type I error level[/C][C]8[/C][C]0.296296296296296[/C][C]NOK[/C][/ROW]
[ROW][C]10% type I error level[/C][C]8[/C][C]0.296296296296296[/C][C]NOK[/C][/ROW]
[/TABLE]
Source: https://freestatistics.org/blog/index.php?pk=146536&T=6

Globally Unique Identifier (entire table): ba.freestatistics.org/blog/index.php?pk=146536&T=6

As an alternative you can also use a QR Code:  

The GUIDs for individual cells are displayed in the table below:

Meta Analysis of Goldfeld-Quandt test for Heteroskedasticity
Description# significant tests% significant testsOK/NOK
1% type I error level50.185185185185185NOK
5% type I error level80.296296296296296NOK
10% type I error level80.296296296296296NOK


Parameters (Session):
par1 = 1 ; par2 = Do not include Seasonal Dummies ; par3 = No Linear Trend ;
Parameters (R input):
par1 = 1 ; par2 = Do not include Seasonal Dummies ; par3 = No Linear Trend ;
R code (references can be found in the software module):
library(lattice)
library(lmtest)
n25 <- 25 #minimum number of obs. for Goldfeld-Quandt test
par1 <- as.numeric(par1)
x <- t(y)
k <- length(x[1,])
n <- length(x[,1])
x1 <- cbind(x[,par1], x[,1:k!=par1])
mycolnames <- c(colnames(x)[par1], colnames(x)[1:k!=par1])
colnames(x1) <- mycolnames #colnames(x)[par1]
x <- x1
if (par3 == 'First Differences'){
x2 <- array(0, dim=c(n-1,k), dimnames=list(1:(n-1), paste('(1-B)',colnames(x),sep='')))
for (i in 1:n-1) {
for (j in 1:k) {
x2[i,j] <- x[i+1,j] - x[i,j]
}
}
x <- x2
}
if (par2 == 'Include Monthly Dummies'){
x2 <- array(0, dim=c(n,11), dimnames=list(1:n, paste('M', seq(1:11), sep ='')))
for (i in 1:11){
x2[seq(i,n,12),i] <- 1
}
x <- cbind(x, x2)
}
if (par2 == 'Include Quarterly Dummies'){
x2 <- array(0, dim=c(n,3), dimnames=list(1:n, paste('Q', seq(1:3), sep ='')))
for (i in 1:3){
x2[seq(i,n,4),i] <- 1
}
x <- cbind(x, x2)
}
k <- length(x[1,])
if (par3 == 'Linear Trend'){
x <- cbind(x, c(1:n))
colnames(x)[k+1] <- 't'
}
x
k <- length(x[1,])
df <- as.data.frame(x)
(mylm <- lm(df))
(mysum <- summary(mylm))
if (n > n25) {
kp3 <- k + 3
nmkm3 <- n - k - 3
gqarr <- array(NA, dim=c(nmkm3-kp3+1,3))
numgqtests <- 0
numsignificant1 <- 0
numsignificant5 <- 0
numsignificant10 <- 0
for (mypoint in kp3:nmkm3) {
j <- 0
numgqtests <- numgqtests + 1
for (myalt in c('greater', 'two.sided', 'less')) {
j <- j + 1
gqarr[mypoint-kp3+1,j] <- gqtest(mylm, point=mypoint, alternative=myalt)$p.value
}
if (gqarr[mypoint-kp3+1,2] < 0.01) numsignificant1 <- numsignificant1 + 1
if (gqarr[mypoint-kp3+1,2] < 0.05) numsignificant5 <- numsignificant5 + 1
if (gqarr[mypoint-kp3+1,2] < 0.10) numsignificant10 <- numsignificant10 + 1
}
gqarr
}
bitmap(file='test0.png')
plot(x[,1], type='l', main='Actuals and Interpolation', ylab='value of Actuals and Interpolation (dots)', xlab='time or index')
points(x[,1]-mysum$resid)
grid()
dev.off()
bitmap(file='test1.png')
plot(mysum$resid, type='b', pch=19, main='Residuals', ylab='value of Residuals', xlab='time or index')
grid()
dev.off()
bitmap(file='test2.png')
hist(mysum$resid, main='Residual Histogram', xlab='values of Residuals')
grid()
dev.off()
bitmap(file='test3.png')
densityplot(~mysum$resid,col='black',main='Residual Density Plot', xlab='values of Residuals')
dev.off()
bitmap(file='test4.png')
qqnorm(mysum$resid, main='Residual Normal Q-Q Plot')
qqline(mysum$resid)
grid()
dev.off()
(myerror <- as.ts(mysum$resid))
bitmap(file='test5.png')
dum <- cbind(lag(myerror,k=1),myerror)
dum
dum1 <- dum[2:length(myerror),]
dum1
z <- as.data.frame(dum1)
z
plot(z,main=paste('Residual Lag plot, lowess, and regression line'), ylab='values of Residuals', xlab='lagged values of Residuals')
lines(lowess(z))
abline(lm(z))
grid()
dev.off()
bitmap(file='test6.png')
acf(mysum$resid, lag.max=length(mysum$resid)/2, main='Residual Autocorrelation Function')
grid()
dev.off()
bitmap(file='test7.png')
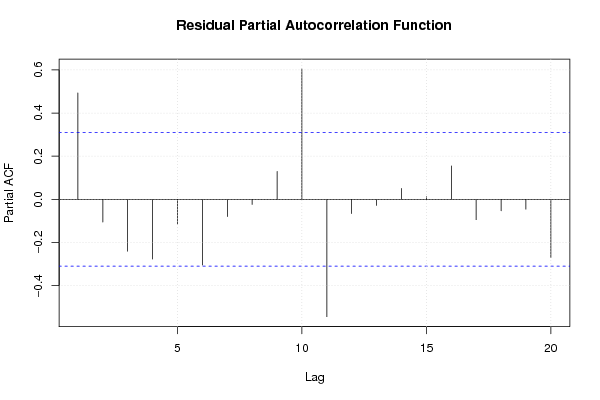
pacf(mysum$resid, lag.max=length(mysum$resid)/2, main='Residual Partial Autocorrelation Function')
grid()
dev.off()
bitmap(file='test8.png')
opar <- par(mfrow = c(2,2), oma = c(0, 0, 1.1, 0))
plot(mylm, las = 1, sub='Residual Diagnostics')
par(opar)
dev.off()
if (n > n25) {
bitmap(file='test9.png')
plot(kp3:nmkm3,gqarr[,2], main='Goldfeld-Quandt test',ylab='2-sided p-value',xlab='breakpoint')
grid()
dev.off()
}
load(file='createtable')
a<-table.start()
a<-table.row.start(a)
a<-table.element(a, 'Multiple Linear Regression - Estimated Regression Equation', 1, TRUE)
a<-table.row.end(a)
myeq <- colnames(x)[1]
myeq <- paste(myeq, '[t] = ', sep='')
for (i in 1:k){
if (mysum$coefficients[i,1] > 0) myeq <- paste(myeq, '+', '')
myeq <- paste(myeq, mysum$coefficients[i,1], sep=' ')
if (rownames(mysum$coefficients)[i] != '(Intercept)') {
myeq <- paste(myeq, rownames(mysum$coefficients)[i], sep='')
if (rownames(mysum$coefficients)[i] != 't') myeq <- paste(myeq, '[t]', sep='')
}
}
myeq <- paste(myeq, ' + e[t]')
a<-table.row.start(a)
a<-table.element(a, myeq)
a<-table.row.end(a)
a<-table.end(a)
table.save(a,file='mytable1.tab')
a<-table.start()
a<-table.row.start(a)
a<-table.element(a,hyperlink('ols1.htm','Multiple Linear Regression - Ordinary Least Squares',''), 6, TRUE)
a<-table.row.end(a)
a<-table.row.start(a)
a<-table.element(a,'Variable',header=TRUE)
a<-table.element(a,'Parameter',header=TRUE)
a<-table.element(a,'S.D.',header=TRUE)
a<-table.element(a,'T-STAT
H0: parameter = 0',header=TRUE)
a<-table.element(a,'2-tail p-value',header=TRUE)
a<-table.element(a,'1-tail p-value',header=TRUE)
a<-table.row.end(a)
for (i in 1:k){
a<-table.row.start(a)
a<-table.element(a,rownames(mysum$coefficients)[i],header=TRUE)
a<-table.element(a,mysum$coefficients[i,1])
a<-table.element(a, round(mysum$coefficients[i,2],6))
a<-table.element(a, round(mysum$coefficients[i,3],4))
a<-table.element(a, round(mysum$coefficients[i,4],6))
a<-table.element(a, round(mysum$coefficients[i,4]/2,6))
a<-table.row.end(a)
}
a<-table.end(a)
table.save(a,file='mytable2.tab')
a<-table.start()
a<-table.row.start(a)
a<-table.element(a, 'Multiple Linear Regression - Regression Statistics', 2, TRUE)
a<-table.row.end(a)
a<-table.row.start(a)
a<-table.element(a, 'Multiple R',1,TRUE)
a<-table.element(a, sqrt(mysum$r.squared))
a<-table.row.end(a)
a<-table.row.start(a)
a<-table.element(a, 'R-squared',1,TRUE)
a<-table.element(a, mysum$r.squared)
a<-table.row.end(a)
a<-table.row.start(a)
a<-table.element(a, 'Adjusted R-squared',1,TRUE)
a<-table.element(a, mysum$adj.r.squared)
a<-table.row.end(a)
a<-table.row.start(a)
a<-table.element(a, 'F-TEST (value)',1,TRUE)
a<-table.element(a, mysum$fstatistic[1])
a<-table.row.end(a)
a<-table.row.start(a)
a<-table.element(a, 'F-TEST (DF numerator)',1,TRUE)
a<-table.element(a, mysum$fstatistic[2])
a<-table.row.end(a)
a<-table.row.start(a)
a<-table.element(a, 'F-TEST (DF denominator)',1,TRUE)
a<-table.element(a, mysum$fstatistic[3])
a<-table.row.end(a)
a<-table.row.start(a)
a<-table.element(a, 'p-value',1,TRUE)
a<-table.element(a, 1-pf(mysum$fstatistic[1],mysum$fstatistic[2],mysum$fstatistic[3]))
a<-table.row.end(a)
a<-table.row.start(a)
a<-table.element(a, 'Multiple Linear Regression - Residual Statistics', 2, TRUE)
a<-table.row.end(a)
a<-table.row.start(a)
a<-table.element(a, 'Residual Standard Deviation',1,TRUE)
a<-table.element(a, mysum$sigma)
a<-table.row.end(a)
a<-table.row.start(a)
a<-table.element(a, 'Sum Squared Residuals',1,TRUE)
a<-table.element(a, sum(myerror*myerror))
a<-table.row.end(a)
a<-table.end(a)
table.save(a,file='mytable3.tab')
a<-table.start()
a<-table.row.start(a)
a<-table.element(a, 'Multiple Linear Regression - Actuals, Interpolation, and Residuals', 4, TRUE)
a<-table.row.end(a)
a<-table.row.start(a)
a<-table.element(a, 'Time or Index', 1, TRUE)
a<-table.element(a, 'Actuals', 1, TRUE)
a<-table.element(a, 'Interpolation
Forecast', 1, TRUE)
a<-table.element(a, 'Residuals
Prediction Error', 1, TRUE)
a<-table.row.end(a)
for (i in 1:n) {
a<-table.row.start(a)
a<-table.element(a,i, 1, TRUE)
a<-table.element(a,x[i])
a<-table.element(a,x[i]-mysum$resid[i])
a<-table.element(a,mysum$resid[i])
a<-table.row.end(a)
}
a<-table.end(a)
table.save(a,file='mytable4.tab')
if (n > n25) {
a<-table.start()
a<-table.row.start(a)
a<-table.element(a,'Goldfeld-Quandt test for Heteroskedasticity',4,TRUE)
a<-table.row.end(a)
a<-table.row.start(a)
a<-table.element(a,'p-values',header=TRUE)
a<-table.element(a,'Alternative Hypothesis',3,header=TRUE)
a<-table.row.end(a)
a<-table.row.start(a)
a<-table.element(a,'breakpoint index',header=TRUE)
a<-table.element(a,'greater',header=TRUE)
a<-table.element(a,'2-sided',header=TRUE)
a<-table.element(a,'less',header=TRUE)
a<-table.row.end(a)
for (mypoint in kp3:nmkm3) {
a<-table.row.start(a)
a<-table.element(a,mypoint,header=TRUE)
a<-table.element(a,gqarr[mypoint-kp3+1,1])
a<-table.element(a,gqarr[mypoint-kp3+1,2])
a<-table.element(a,gqarr[mypoint-kp3+1,3])
a<-table.row.end(a)
}
a<-table.end(a)
table.save(a,file='mytable5.tab')
a<-table.start()
a<-table.row.start(a)
a<-table.element(a,'Meta Analysis of Goldfeld-Quandt test for Heteroskedasticity',4,TRUE)
a<-table.row.end(a)
a<-table.row.start(a)
a<-table.element(a,'Description',header=TRUE)
a<-table.element(a,'# significant tests',header=TRUE)
a<-table.element(a,'% significant tests',header=TRUE)
a<-table.element(a,'OK/NOK',header=TRUE)
a<-table.row.end(a)
a<-table.row.start(a)
a<-table.element(a,'1% type I error level',header=TRUE)
a<-table.element(a,numsignificant1)
a<-table.element(a,numsignificant1/numgqtests)
if (numsignificant1/numgqtests < 0.01) dum <- 'OK' else dum <- 'NOK'
a<-table.element(a,dum)
a<-table.row.end(a)
a<-table.row.start(a)
a<-table.element(a,'5% type I error level',header=TRUE)
a<-table.element(a,numsignificant5)
a<-table.element(a,numsignificant5/numgqtests)
if (numsignificant5/numgqtests < 0.05) dum <- 'OK' else dum <- 'NOK'
a<-table.element(a,dum)
a<-table.row.end(a)
a<-table.row.start(a)
a<-table.element(a,'10% type I error level',header=TRUE)
a<-table.element(a,numsignificant10)
a<-table.element(a,numsignificant10/numgqtests)
if (numsignificant10/numgqtests < 0.1) dum <- 'OK' else dum <- 'NOK'
a<-table.element(a,dum)
a<-table.row.end(a)
a<-table.end(a)
table.save(a,file='mytable6.tab')
}